The Globular Cluster System of the Virgo Giant Elliptical Galaxy NGC 4636: I. Subaru/FOCAS Spectroscopy and Database∗
Abstract
We present a spectroscopic study of the globular clusters (GCs) in the giant elliptical galaxy NGC 4636 in the Virgo cluster. We selected target GC candidates using the Washington photometry derived from the deep CCD images taken at the KPNO 4m. Then we obtained the spectra of 164 target objects in the field of NGC 4636 using the Multi-Object Spectroscopy (MOS) mode of Faint Object Camera and Spectrograph (FOCAS) on the SUBARU 8.2m Telescope. We have measured the velocities for 122 objects: 105 GCs in NGC 4636, the nucleus of NGC 4636, 11 foreground stars, 2 background galaxies, and 3 probable intracluster GCs in the Virgo cluster. The GCs in NGC 4636 are located in the projected galactocentric radius within (corresponding to 43 kpc). The measured velocities for the GCs range from km s-1 to km s-1 , with a mean value of km s-1 , which is in good agreement with the velocity for the nucleus of NGC 4636, km s-1 . The velocity dispersion of the GCs in NGC 4636 is derived to be km s-1 and the velocity dispersion of the blue GCs is slightly larger than that of the red GCs. Combining our results with data in the literature, we produce a master catalog of radial velocities for 238 GCs in NGC 4636. The velocity dispersion of the GCs in the master catalog is found to be km s-1 for the entire sample, km s-1 for 108 blue GCs, and km s-1 for 130 red GCs.
1 Introduction
Globular clusters (GCs) are invaluable fossils that provide critical clues for understanding the formation and early evolution of their host galaxies. GCs are found from the central region to the outer halo in their host galaxies, and thousands of them are often found in nearby giant elliptical galaxies (gEs). Thus GCs are an excellent tool to study the structure and kinematics of the halo of nearby gEs.
While there are numerous studies based on the photometry of the GCs in gEs (e.g., see the reviews by Lee 2003; Brodie & Strader 2006), there are only a small number of studies based on the spectroscopy of the GCs in gEs : M49 (Zepf et al., 2000; Côté et al., 2003), M60 (Pierce et al., 2006; Bridges et al., 2006; Lee et al., 2008a; Hwang et al., 2008), M87 (Cohen & Ryzhov, 1997; Kissler-Patig & Gebhardt, 1998; Côté et al., 2001), NGC 4636 (Schuberth et al., 2006), NGC 1399 (Kissler-Patig et al., 1998; Minniti et al., 1998; Kissler-Patig et al., 1999; Richtler et al., 2004, 2008), NGC 5128 (Peng et al., 2004a, b; Woodley et al., 2007), and NGC 1407 (Romanowsky et al., 2009). Recent results on the kinematics of the GCs in gEs are summarized as follows.
Côté et al. (2001) presented a kinematic study of 278 GCs in M87 located close to the dynamical center of the Virgo Cluster. All the GCs, the blue GCs, and the red GCs appear to rotate with similar rotation amplitudes. However the blue GCs rotate around the photometric minor axis in the outer region ( ), while they appear to rotate around the photometric major axis in the inner region ( ). The entire GC system has an almost perfectly isotropic velocity ellipsoid, The blue GC orbits are modestly tangentially biased, while the red GG orbits are radially biased.
Côté et al. (2003) presented a kinematic study of 263 GCs in M49, the brightest galaxy in Virgo, finding that the GC system of M49 exhibits a slow rotation that is mainly due to a net rotation of the blue GCs alone. The red GCs show essentially no rotation, but they show a weak rotation beyond 0.5 in the opposite direction to that of the blue GCs. In the outer region ( ) of M49, the velocity dispersion for the blue GCs exceeds that for the red GCs by . The entire GC system in M49 is consistent with an almost perfectly isotropic velocity ellipsoid.
Richtler et al. (2004) presented a kinematic study of 468 GCs in NGC 1399 located at the center of the Fornax cluster. The velocity dispersion for the red GCs is smaller than those for the blue GCs. Little rotation is found for either of the blue or red GCs. The red GC orbits are isotropic, and the blue GCs are slightly tangentially biased.
Woodley et al. (2007) presented a kinematic study of 336 GCs in NGC 5128. The kinematics of the red GCs and blue GCs are quite similar. The GCs in the inner region (within 5 kpc) have a lower rotation signal than those in the outer regions. The velocity dispersions for both the blue and red GCs display a steady increase with galactocentric radius.
Hwang et al. (2008) presented a kinematic study of 121 GCs in M60, a gE in Virgo. The velocity dispersion of the red GCs is marginally larger than that of the blue GCs. The GC system shows a significant overall rotation, and the rotation of the blue GCs is slightly weaker than or similar to that of the red GCs. The GC system is found to have a tangentially biased velocity ellipsoid. The blue GC orbits are modestly tangentially biased, while the red GC orbits are modestly radially biased.
Romanowsky et al. (2009) presented a kinematic study of 172 GCs in NGC 1407. They found a weak rotation in the outer region of NGC 1407, and a rotational misalignment between the blue and red GCs. The GC system has somewhat tangential anisotropy, which is mainly due to the blue GCs. The red GC orbits are almost isotropic.
These previous studies showed that the kinematics of the GC systems in these gEs is diverse, showing a large difference in velocity dispersion, rotation, and their radial variation. It is not yet known whether this kinematic diversity is an intrinsic property, or is due to a small number of GCs in each gE or a small number of gEs in previous studies. It is needed to increase the sample size of the GCs in these gEs and to extend the kinematic study of the GC systems to more galaxies.
We have been carrying a project to investigate the spectroscopic properties of the GCs in gEs. We presented our study on the kinematics of the GC system in M60 in Virgo in Lee et al. (2008a) and Hwang et al. (2008). In this paper and its companion paper (Lee et al., 2009) we present a study of the kinematics of the GC system in another gE, NGC 4636, in Virgo.
NGC 4636 is located (about 2.8 Mpc) south east from the Virgo center, and is considered to be a major member of a small group falling into the Virgo center (Nolthenius, 1993). NGC 4636 is relatively less luminous ( mag) among the gEs in Virgo, but it shows several interesting features. First, it is one of the most X-ray luminous elliptical galaxies in the nearby universe, with ergs s-1(Forman et al., 1985). It shows a large diffuse X-ray emission extending out to about , arm-like asymmetric features involved with shocks in the central region, and a few hundreds of point sources in the X-ray images(Forman et al., 1985; Matsushita et al., 1998; Jones et al., 2002; Loewenstein & Mushotzky, 2003; O’Sullivan et al., 2005; Kim et al., 2006; Posson-Brown et al., 2009). Second, the color distribution of most GCs is bimodal, while the brightest GCs have an intermediate color (Dirsch et al., 2005). These results were found from Washington photometry of a field obtained using the MOSAIC wide-field CCD camera at the CTIO 4m telescope. Third, its specific frequency of GCs, =, is known to be much higher than that of normal elliptical galaxies (Kissler et al., 1994; Dirsch et al., 2005). Fourth, Loewenstein & Mushotzky (2003) and Chakrabarty & Raychaudury (2008) suggested that the fraction of dark matter in this galaxy is much larger compared with other galaxies, while Schuberth et al. (2006) claimed from the study of kinematics of the GC system in this galaxy that it is only 20 to 30 %. Finally, it has a kinematically decoupled core showing an irregular velocity curve in the central region (Caon et al., 2000).
We have been doing a spectroscopic study of the GCs in NGC 4636 using the spectra obtained at the 8.2m Subaru Telescope. We present the measurement of radial velocities for the GCs in NGC 4636 in this paper, and will present the kinematic analysis of the data in the companion paper (Lee et al., 2009). During our study, Schuberth et al. (2006, S06) presented a kinematic study of 174 GCs in NGC 4636, using the radial velocity data obtained at the VLT. Our study is complementary to this study.
We adopted a distance to NGC 4636, 14.7 Mpc [], as given by Tonry et al. (2001) based on the surface brightness fluctuation method, for which one arcsec in the sky corresponds to 71 pc. Foreground reddening toward NGC 4636 is very small, (Schlegel et al., 1998), corresponding to and and . Effective radius, ellipticity, and position angle of NGC 4636 are kpc, , and PA deg, kpc, , and PA deg, kpc, , and PA deg, respectively (Kim et al., 2006; Park et al., 2009).
This paper is composed as follows. Section 2 describes the selection of the targets for spectroscopy, spectroscopic observation, data reduction, and radial velocity measurement. In §3 we present the data for the radial velocities for the objects measured in this study, and compare our measurements with previous studies. We produce a master catalog for the radial velocities for GCs and other objects in the field of NGC 4636, combining our measurements with the data in the literature. Using this catalog we select the genuine GCs of NGC 4636. Then we show the distribution of the radial velocity of the GCs with respect to color, magnitude, position angle and galactocentric distance. Primary results are summarized in the final section.
2 Observation and Data Reduction
2.1 Spectroscopic Target Selection
We selected the spectroscopic targets using the catalog of GC candidates obtained from Washington images of a field including the center of NGC 4636 taken at the KPNO 4m telescope. A photometric study of the GCs in NGC 4636 based on these data will be given in Park et al. (2009). GCs in NGC 4636 appear as point sources in the KPNO images, and there are some foreground stars and distant background galaxies as well as GCs among the point sources found in the KPNO images. Most of the bright GCs in Virgo gEs have colors (Lee, 2003; Dirsch et al., 2005; Park et al., 2009). We selected, as the spectroscopic targets, the bright GC candidates with and mag. We also included two small galaxies and the nucleus of NGC 4636 in the list of targets for comparison. The number of the targets in the final sample is 168.
2.2 Observation
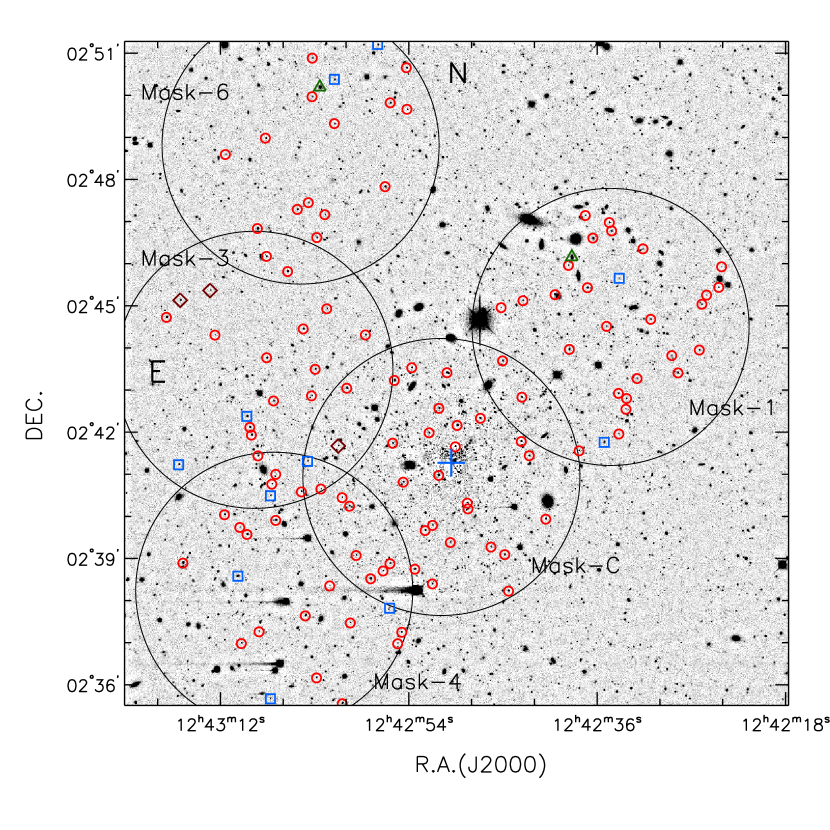
Spectroscopic data of 168 targets were obtained using the Multi-Object Spectrograpy (MOS) mode of Faint Object Camera and Spectrograph (FOCAS; Kashikawa et al. 2002) at the Subaru 8.2m Telescope on 2002 April 20 and 21. A mask covers a circular field of view with diameter of . We observed five masks, and the positions of the observed masks are shown in Figure 1.
Figure 1 displays the grayscale map of the image of NGC 4636 taken at the KPNO 4m, showing the positions of the masks. We created first the model image of the galaxy halo light using the ellipse fitting task IRAF/ELLIPSE111IRAF is distributed by the National Optical Astronomy Observatories, which are operated by the Association of Universities for Research in Astronomy, Inc., under contract to the National Science Foundation.. Then the model image of the halo light of NGC 4636 was subtracted from the original image to show better the point sources including GCs in NGC 4636, as seen in Figure 1.
Table 1 lists the log of our observation. We obtained our spectra in the MOS mode with the medium-dispersion blue grism (300B) resulting in a dispersion of 1.34 Å pixel -1 and the order-cut filter L600 covering Å. Seeing during the observation was . We obtained mask images of the fields with filter with exposure times of 180 sec and 300 sec in the camera mode of FOCAS under the seeing of on 2002 March 9. Using these images we made masks with Mask Design Pipeline (MDP), which is a software utility for making masks of MOS (Saito et al., 2003). The slit width along the dispersion axis was 0.8″ in designing the MOS mask, giving a spectral resolution of .
We obtained three or four 1200 sec exposures for targets in all but one mask field, with comparison spectra taken with Th-Ar lamps before and/or after each exposure. For the calibration of the flux, radial velocity and metallicity, we used the long-slit spectroscopy mode of FOCAS. We observed BD+33d2642, standard star for flux calibration, with 2.0″ slit width along the dispersion axis and 10 sec exposure time. Also we observed five Galactic GCs (NGC 5904 (M5), NGC 6205 (M13), NGC 6341 (M92), NGC 6171 (M107), and NGC 6624) for the velocity and metallicity templates, with stepping scan mode to sample an area larger than that covered by the slit by moving the slit along the dispersion direction. We covered a total area of for each cluster. Basic information of the five Galactic GCs is listed in Table 2 (Harris 1996 and references therein). The metallicity of these Galactic GCs ranges from [Fe/H] = 2.3 to 0.4, and their radial velocity ranges from km s-1 to km s-1 .
2.3 Data Reduction
We applied basic processing (overscan correction, bias subtraction, and removing cosmic ray) to the CCD images before combining a pair of CCD images using IRAF tasks. task in IDL(Saito et al., 2003) was used for connecting two CCD images and correcting the optics distortion. Then we flattened multi-slit images with IRAF tasks. The spectra of the targets from the combined images were traced, extracted, and sky-subtracted using the IRAF/APALL task. We could not extract spectra of four faint targets because of low signal-to-noise (S/N) ratio. We used the Th-Ar lamp spectra for wavelength calibration. There are about 40 useful emission lines in the range of Å. The resulting error for wavelength calibration is Å. Figure 2 represents spectra of two sample GCs in NGC 4636, the nucleus of NGC 4636, and two Galactic GCs. Several typical absorption lines for old stellar systems such as G band, H and Mgb are clearly seen in the spectra of Galactic GCs, but they are not clearly seen in the spectra of the GCs in NGC 4636 because of low S/N ratio. The absorption lines such as Mgb and FeI for the red GC in NGC 4636 are much stronger than those for the blue GC in NGC 4636, like the Galactic globular clusters (Brodie & Hanes, 1986; Cohen et al., 1998; Beasley et al., 2000; Brodie & Strader, 2006). Absorption features in the spectrum of the NGC 4636 nucleus are much broader than those in the GCs due to its large velocity dispersion.
2.4 Velocity Determination
We determined the radial velocities for the targets using the Fourier cross-correlation task, IRAF/FXCOR (Tonry & Davis, 1979). We fitted the continuum of the spectra using the spline-fit with clipping for low level and clipping for high level, and subtracted the resulting fit from the original spectra. We used the resulting spectra to measure the radial velocity.
Since the S/N at Å is low for most spectra, and the strong night sky emission line appears near 5600 Å, we decided to use the wavelength range Å for cross-correlation. We measured the radial velocities for the targets, using five templates of Galactic GCs. The values derived using four templates (M5, M13, M92 and NGC 6624) are consistent with each other within one , while those derived using M107 show two difference. Therefore we took the error-weighted average of these four measurements to get the final value for each target. The error of the measured radial velocity is then estimated using .
3 Results
3.1 Velocity Data
The final number of targets for which we determined the radial velocities is 122. We could not determine the radial velocities for 42 objects among the 164 targets because of poor qualities of the spectra. The mean S/N of spectra measured the radial velocity is about 13 at Å.
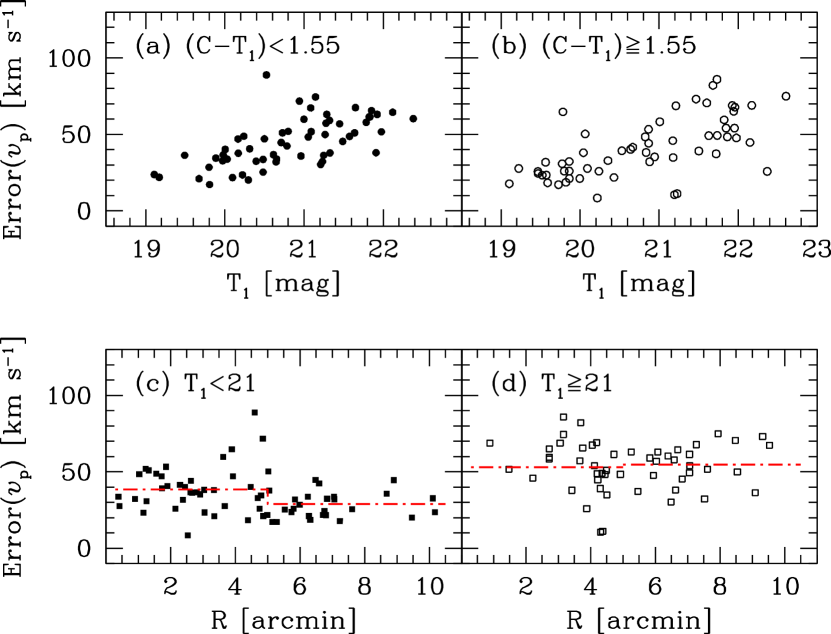
Figure 3 displays the errors of the measured radial velocities versus magnitudes and galactocentric distances of the 119 targets, excluding the nucleus of NGC 4636 and two small galaxies having no photometric data. The errors for our radial velocity measurements range mostly from 20 to 80 km s-1 with a mean of km s-1. The mean errors increase with increasing magnitude. The error spread for the red objects () is similar to that for the blue objects (), unlike the case seen in the Schuberth et al. (2006) data (their Figure 3) which show a much larger error spread for the blue objects than for the red objects. The mean errors of the objects show little dependence on the galactocentric distance.
3.2 Comparison with Previous Studies
Schuberth et al. (2006) published a catalog of spectroscopic data including radial velocities for 174 GCs in NGC 4636 based on the spectra obtained using FORS2/XMU at the VLT. We compared our list with theirs, finding that there are 45 objects in common between the two. We compared our velocity measurements with their measurements for these common objects, as displayed in Figure 4. It shows a good agreement between the two studies for most objects, but shows significant differences for two objects (ID 224 and ID 1049 in this study). Our values, and km s-1 (for ID 224 and 1049, respectively), are significantly larger than their values, and km s-1 . The reason for these differences for the two objects is not known. Further spectroscopic observation is needed to check this difference.
From the weighted linear fit to the data discarding these two objects, we derive a transformation relation between the two measurements, with km s-1 ,
| (1) |
The of the relation between the two studies is rather high. The cause for this rather high is the existence of some outliers in the common sample between the two studies. If we use the data without the outliers with more than two times , the will be reduced to 61 km/s, which is marginally similar to the mean error ( km s-1) of this study.
We have determined the radial velocity for the nucleus of NGC 4636 as km s-1. This value is consistent with the value, km s-1 given by Smith et al. (2000) and km s-1 in Schuberth et al. (2006). The larger error in our estimate of the nucleus velocity is primarily due to the fact that we used, as templates, the spectra of GCs with much smaller velocity dispersion to estimate the velocity for the nucleus of NGC 4636 that has much larger velocity dispersion.
3.3 A Master Catalog of Velocity Data
We have produced a master catalog of radial velocities for the objects in NGC 4636, combining the catalog in this study with the catalog of 174 GCs in NGC 4636 given by Schuberth et al. (2006). The total number of the objects in the master catalog is 255, including the nucleus of NGC 4636. We transformed the radial velocities given by Schuberth et al. (2006) to our system, using the transformation equation (1) for the following analysis.
In Table 3, we list the photometric and kinematic data set for all 255 spectroscopic targets with measured radial velocities. The first column represents identification numbers. The second and third columns give, respectively, the right ascension and the declination (J2000). The galactocentric radius and position angle are given in columns 4 and 5, respectively. The magnitude and color information in columns 6 and 7 are from Park et al. (2009). The eighth column gives the radial velocity and its error measured in this study. The ninth and tenth columns give the radial velocity (transformed into our velocity system) and its error measured in Schuberth et al. (2006), and their IDs, respectively. The final column gives a merged, weighted mean velocity for all objects. We have determined the membership of the objects in the master catalog as described in the following section. The genuine NGC 4636 GCs are listed first in the table, followed by eleven foreground stars, two background galaxies and the NGC 4636 nucleus, and three probable intracluster GCs of the Virgo cluster.
3.4 Velocity Distribution and Membership
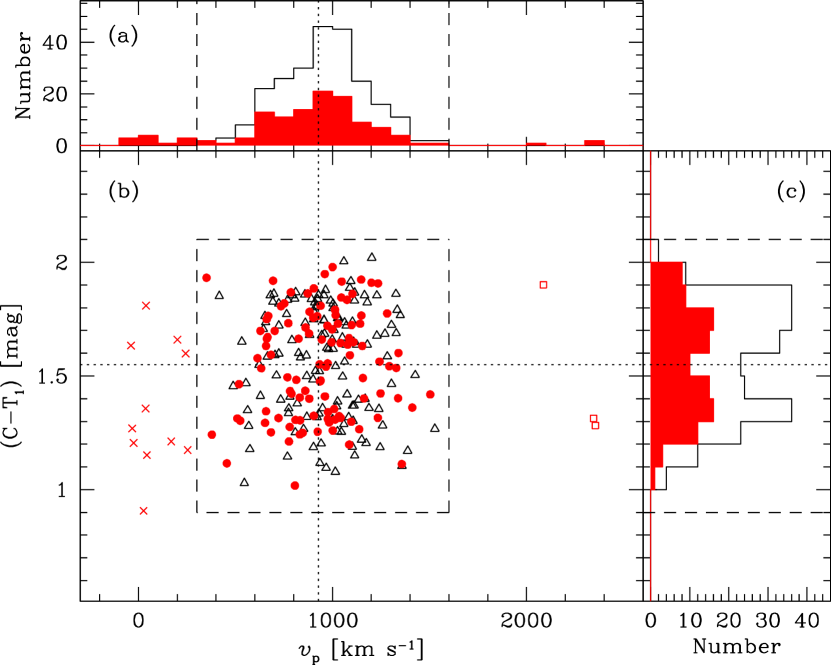
We have determined the membership of the objects in the master catalog using the distribution of radial velocity. In Figure 5 we plot () colors versus the radial velocities, the radial velocity distribution, and the color distribution for the objects in the master catalog. The color distribution of the GCs in NGC 4636 is bimodal, which is fit well by two Gaussians with peaks at () and 1.76 () (Lee, 2003; Dirsch et al., 2005; Park et al., 2009). The minimum between the two components is at , which was used for diving the entire sample into the blue GCs and red GCs.
The radial velocity distribution of the 252 objects excluding the galaxies is approximately Gaussian centered around the radial velocity for the NGC 4636 nucleus, km s-1, with a weak excess around the zero velocity. Figure 5 shows that the radial velocity of the objects with larger than that of NGC 4636 nucleus is distributed up to km s-1 . Considering a symmetric distribution for the radial velocity of NGC 4636 GCs, we adopted 300 km s-1 as a lower limit for the radial velocity of NGC 4636 GCs to avoid a contamination of the objects with low velocity. Finally we selected, as genuine NGC 4636 GCs, those for which radial velocities are in the range of and () colors are in the range of . The dashed-line box in Figure 5 represents the boundary for selecting GCs. The selection color range is equivalent to a metallicity range of 2.24 [Fe/H] 0.33 dex using the color-metallicity relations in Lee et al. (2008b). The total number of the GCs in NGC 4636 in this catalog is 238, which includes 108 blue GCs and 130 red GCs, respectively.
There are five objects that have radial velocities larger than the upper boundary for the NGC 4636 GCs: IDs 644, 1192, 1293, g1, and g2. We searched for these objects in the NASA Extragalactic Database (NED), but found none. Two (g1 and g2) of these with 26,000 km s-1 are background galaxies beyond the Virgo cluster. The other three with km s-1 are probably the intracluster GCs of the Virgo cluster. There are 11 objects with radial velocities smaller than the lower boundary for the NGC 4636 GCs. We consider these objects as foreground stars.
Among the 119 GC candidates with radial velocities derived in this study, 105 objects are found to be GCs in NGC 4636, 3 objects are found to be probable intracluster GCs belonging to the Virgo cluster, and 11 objects turned out to be foreground stars. Therefore the success rate of photometric searching for GCs, becomes about 90%, showing that the method to select the GC candidates using the color and the morphological classifier is very efficient (see Park et al. 2009; Lee et al. 2008b for more details).
3.5 The Final Sample of Globular Clusters in NGC 4636
The positions of the GCs are marked in Figure 1. These GCs are located in the range of projected galactocentric distance 23″ to 926″ (corresponding to 1.63 to 65.75 kpc and 0.26 to 10.36 ), most of which are within . The velocity dispersion obtained using the biweight scale of Beers et al. (1990) is estimated to be km s-1 for the 105 GCs measured in this study, and km s-1 for all 238 GCs in the master catalog. The velocity dispersion of all 108 blue GCs is derived to be km s-1, which is slightly larger than that of the 130 red GCs ( km s-1). The mean value of the radial velocity derived using the biweight location of Beers et al. (1990) is km s-1 for the GCs measured in this study, and km s-1 for all GCs in the master catalog. These values are very similar to the radial velocity for the NGC 4636 nucleus, km s-1.
The GCs close to the color boundary () used for dividing the blue and red GCs will be overlapped by the red tail and the blue tail of the color distribution. To check the effect of this problem in calculating the velocity disperion, we selected the blue GCs with and the red GCs with , and calculated their velocity dispersion. The velocity dispersions thus derived are km s-1 for the blue GCs, and km s-1 for the red GCs. These values are consistent with those of the sub-samples simply divided in the above ( km s-1, and km s-1, respectively). Therefore the effect of the color tail contamination in selecting the sub-samples is minor.
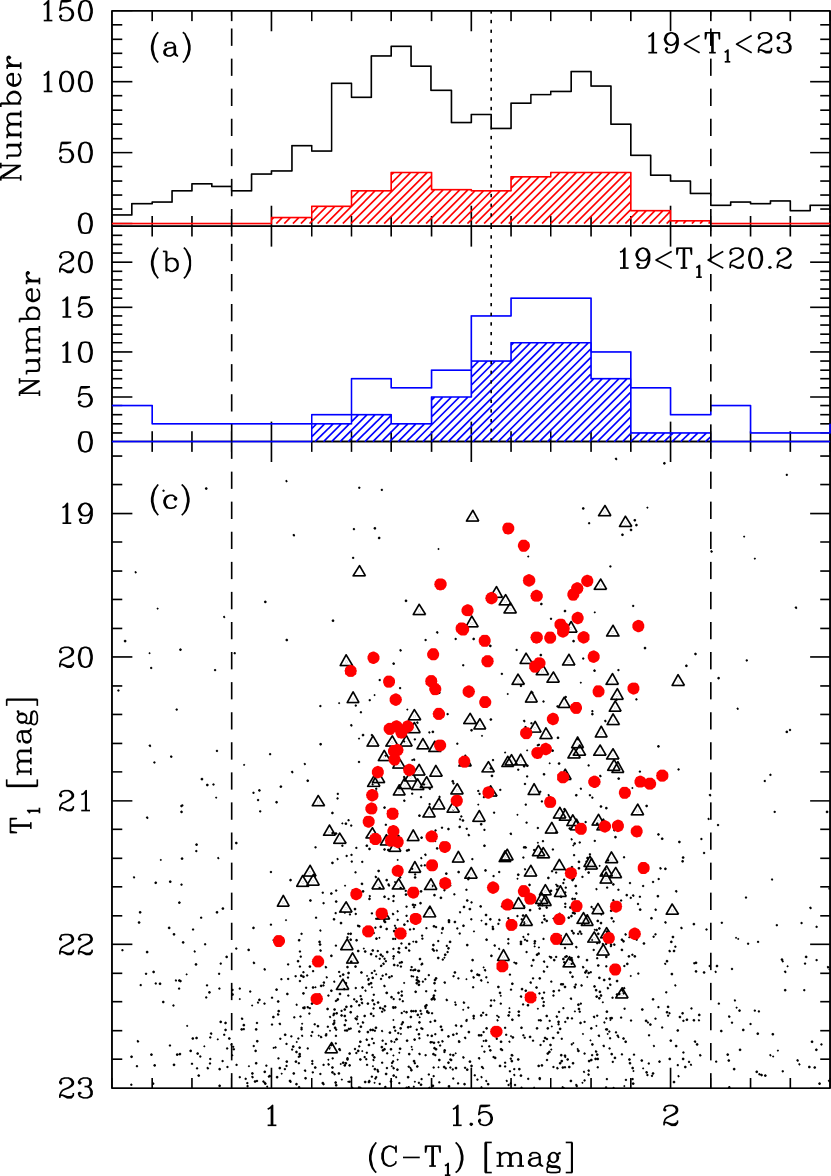
Figure 6 displays the color magnitude diagram and color distribution for all the GCs and the brightest GCs in NGC 4636. For comparison we also plot the point sources in the photometric sample given in Park et al. (2009). Most of the objects with in the photometric sample are probably GCs. The GCs in the master catalog have magnitudes , belonging to the brightest population in NGC 4636, and the ranges of color and magnitude of the GCs in this study and Schuberth et al. (2006) are similar. The color distribution of the GCs is clearly bimodal in the spectroscopic sample like in the photometric sample. It is noted that the color distribution of the brightest objects with shows a dominant red peak and a much weaker blue peak. This was also seen in the case of NGC 1399 (Ostrov et al., 1998; Dirsch et al., 2003). The velocity dispersion of these objects is km s-1, which is very similar to that of the red GCs. The radial number density profile of these bright objects is also similar to that of the red GCs. Therefore most of these brightest objects are considered to be genuine GCs in NGC 4636. Details of the property of these GCs will be given in Park et al. (2009).
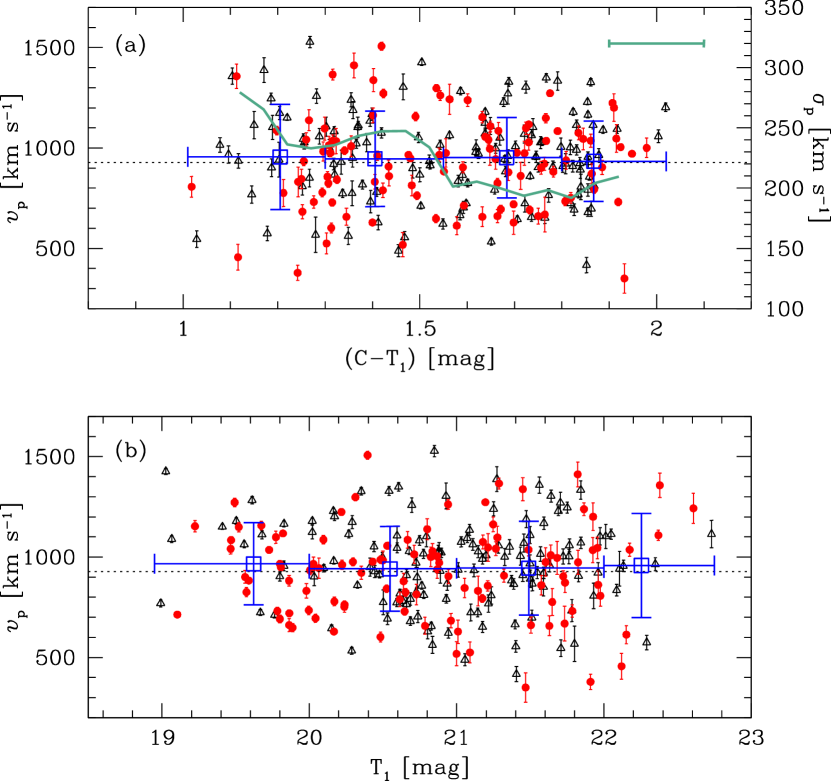
In Figure 7 we plot radial velocities versus colors and magnitudes of the GCs of NGC 4636. The mean value of the radial velocities for the GCs, represented by squares with errorbars, shows little dependence on the magnitude or color of the GCs. However, the scatter in the velocity for the blue GCs is slightly larger than that for the red GCs. Also we derived a mean velocity dispersion profile for all the GCs as a function of color, using a moving color bin (width of 0.2 mag and step of 0.05), as plotted in Figure 7(a). The profile shows that the mean velocity dispersion decreases by km s-1 as the color increases (from blue to red).
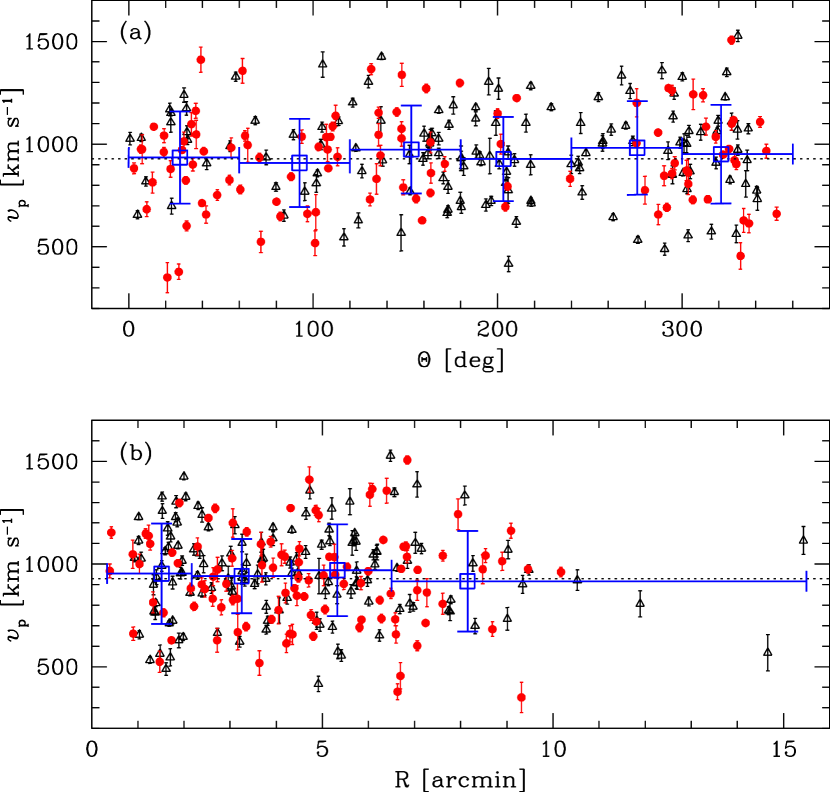
In Figure 8 we display radial velocities versus position angle (measured to east from the north) and projected galactocentric radius of the GCs. The mean value and scatter of the radial velocities for the GCs change little depending on the position angle or galactocentric radius. These two figures also show that the radial velocity distributions against color, magnitude, , and in this study and Schuberth et al. (2006) are similar.
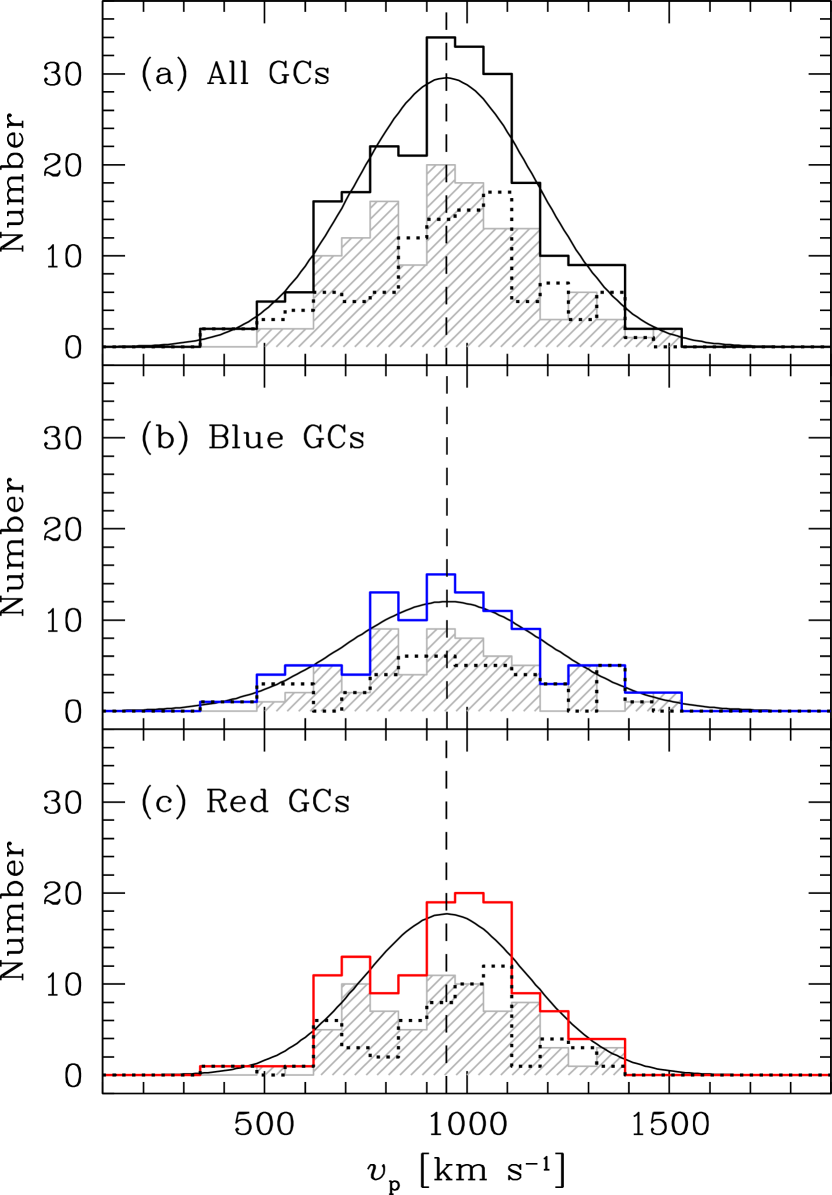
Figure 9 shows the radial velocity distributions for all the GCs, the blue GCs, and the red GCs of NGC 4636 in the master catalog. It also displays the distributions of the bright GCs ( mag) and the faint GCs ( mag). The radial velocity distribution for the blue GCs shows a larger velocity dispersion than that for the red GCs, as derived previously. The radial velocity distributions for the brights and faint GCs look similar. There appears to be a small peak at km s-1 in the case of the red GCs. We checked the significance of this peak using the KMM test (Ashman et al., 1994) and the stastistic (Teague et al., 1990). The KMM test showed that the probability that the radial velocity distribution for the red GCs is bimodal is only 23 %. The value for the red GCs is calculated to be 0.972, which is smaller than the critical value for rejecting the Gaussian hypothesis at the 90% confidence level, =1.040, showing that the distribution for the red GCs is Gaussian. These show that the existence of the small peak at km s-1 is not significant. It is noted that Richtler et al. (2004) also concluded that the significance of a weak peak seen at km s-1 in the velocity distribution of the GCs in NGC 1399 is doubtful. A full dynamical analysis of the kinematics of the GC system of NGC 4636 using these data will be given in the companion paper (Lee et al., 2009).
4 Summary
We have presented a spectroscopic database of GCs in NGC 4636. The spectroscopic targets were selected from the catalog of GC candidates derived from and images taken at the KPNO 4m(Park et al., 2009). The spectra of those objects were obtained using MOS mode of FOCAS on the SUBARU Telescope. We classified our targets into 105 GCs in NGC 4636, 11 stars, and 3 probable intracluster GCs in Virgo, using the color and the radial velocity. Primary results in this study are summarized as follows.
-
1.
We measured the radial velocities for 122 objects in the field of NGC 4636: 105 GCs (51 blue GCs and 54 red GCs), 2 background galaxies, 3 probable intracluster GCs in Virgo, the nucleus of NGC 4636, and 11 foreground stars.
-
2.
The mean value and dispersion of radial velocities for the 105 GCs measured in this study are derived to be km s-1 and km s-1, respectively.
-
3.
We combined our result with the data for 174 GCs of NGC 4636 given by Schuberth et al. (2006), and created a master catalog of radial velocity for 255 objects in the field of NGC 4636. The number of the GCs in the master catalog is 238. The numbers of the blue GCs and red GCs are 108 and 130, respectively.
-
4.
The mean value and dispersion of radial velocities for all GCs are derived to be km s-1 and km s-1, respectively. The velocity dispersions of the blue GCs and red GCs are estimated to be km s-1 and km s-1, respectively.
-
5.
The mean radial velocities for the GCs change little depending on the magnitude, color, position angle or galactocentric radius.
References
- Ashman et al. (1994) Ashman, K. M., Bird, C. M., & Zepf, S. E. 1994, AJ, 108, 2348
- Beasley et al. (2000) Beasley, M. A., Sharples, R. M., Bridges, T. J., Hanes, D. A., Zepf, S. E., Ashman, K. M., & Geisler, D. 2000, MNRAS, 318, 1249
- Beers et al. (1990) Beers, T. C., Flynn, K., & Gebhardt, K. 1990, AJ, 100, 32
- Bridges et al. (2006) Bridges, T., et al. 2006, MNRAS, 373, 157
- Brodie & Hanes (1986) Brodie, J. P., & Hanes, D. A. 1986, ApJ, 300, 258
- Brodie & Strader (2006) Brodie, J. P., & Strader, J. 2006, ARA&A, 44, 193
- Caon et al. (2000) Caon, N., Macchetto, D., & Pastoriza, M. 2000, ApJS, 127, 39
- Chakrabarty & Raychaudury (2008) Chakrabarty, D. & Raychaudury, S. 2008, AJ, 135, 2350
- Cohen & Ryzhov (1997) Cohen, J. G., & Ryzhov, A. 1997, ApJ, 486, 230
- Cohen et al. (1998) Cohen, J. G., Blakeslee, J. P., & Ryzhov, A. 1998, ApJ, 496, 808
- Côté et al. (2001) Côté, P., et al. 2001, ApJ, 559, 828
- Côté et al. (2003) Côté, P., McLaughlin D. E., Cohen J. G., & Blakeslee J. P. 2003, ApJ, 591, 850
- Dirsch et al. (2003) Dirsch, B., Richtler, T., Geisler, D., Forte, J. C., Bassino, L. P., & Gieren, W. P. 2003, AJ, 125, 1908
- Dirsch et al. (2005) Dirsch, B., Schuberth, Y., & Richtler, T. 2005, A&A, 433, 43
- Forman et al. (1985) Forman, W., Jones, C., & Tucker, W. 1985, ApJ, 293, 102
- Harris (1996) Harris, W. E. 1996, AJ, 112, 1487 (February 2003 version)
- Hwang et al. (2008) Hwang, H. S., et al. 2008, ApJ, 674, 869
- Jones et al. (2002) Jones, C., Forman, W., Vikhlinin, A., Markevitch, M., David, L, Warmflash, A., & Murray, S. 2002, ApJ, 567, L115
- Kashikawa et al. (2002) Kashikawa, N., et al. 2002, PASP, 54, 819
- Kim et al. (2006) Kim, E., Kim, D.-W., Fabbiano, G., Lee, M. G., Park, H. S., & Dirsch, B. 2006, ApJ, 647, 276
- Kissler et al. (1994) Kissler, M., Richtler, T., Held, E. V., Grebel, E. K., Wagner, S. J., & Capaccioli, M. 1994, A&A, 287, 463
- Kissler-Patig et al. (1998) Kissler-Patig, M., Brodie, J. P., Schroder, L. L., Forbes, D. A., Grillmair, C. J., & Huchra, J. P. 1998, AJ, 115, 105
- Kissler-Patig & Gebhardt (1998) Kissler-Patig, M., & Gebhardt, K. 1998, AJ, 116, 2237
- Kissler-Patig et al. (1999) Kissler-Patig M., Grillmair C. J., Meylan G., Brodie, J. P., Minniti, D., & Goudfrooij, P. 1999, AJ, 117, 1206
- Lee (2003) Lee, M. G. 2003, Jour. Korean Astron. Soc., 36, 189
- Lee et al. (2008a) Lee, M. G., et al. 2008a, ApJ, 674, 857
- Lee et al. (2008b) Lee, M. G., Park, H. S., Kim, E., Hwang, H. S., Kim, S. C., & Geisler, D. 2008b, ApJ, 682, 135
- Lee et al. (2009) Lee, M. G., Park, H. S., Hwang, H. S., Arimoto, N., Tamura, N., & Onodera, M. 2009, ApJ, submitted (Paper II)
- Loewenstein & Mushotzky (2003) Loewenstein, M., & Mushotzky, R. F. 2003, Nucl. Phys. B. Proc. Suppl., 124, 91
- Matsushita et al. (1998) Matsushita, K., Makishima, K., Ikebe, Y., Rokunanda, E., Uamasaki, N. Y., & Ohashi, T. 1998, ApJ, 499, L13
- Minniti et al. (1998) Minniti, D., Kissler-Patig, M., Goudfrooij, P., & Meylan, G. 1998, AJ, 115, 121
- Nolthenius (1993) Nolthenius, R. 1993, ApJS, 85, 1
- Ostrov et al. (1998) Ostrov, P. G., Forte. J. C., & Geisler, D. 1998, AJ, 116, 2854
- O’Sullivan et al. (2005) O’Sullivan, E., Vrtilek, J. M., & Kempner, J. C. 2005, ApJ, 624, L77
- Park et al. (2009) Park, H. S., Lee, M. G., et al. 2009, in preparation
- Peng et al. (2004a) Peng, E. W., Ford, H. C., & Freeman, K. C. 2004a, ApJS, 150, 367
- Peng et al. (2004b) Peng, E. W., Ford, H. C., & Freeman, K. C. 2004b, ApJ, 602, 705
- Pierce et al. (2006) Pierce, M., et al. 2006, MNRAS, 368, 325
- Posson-Brown et al. (2009) Posson-Brown, J., Raychaudhury, S., Forman, W., Hank D. R., & Jones, C. 2009, ApJ, 695, 1094
- Richtler et al. (2004) Richtler, T., et al. 2004, AJ, 127, 2094
- Richtler et al. (2008) Richtler, T., Schuberth, Y., Hilker, M., Dirsch, B., Bassino, L., & Romanowsky, A. J. 2008, A&A, 478, L23
- Romanowsky et al. (2009) Romanowsky, A. J., Strader, J., Spitler, L. R ., Johnson, R., Brodie, J. P., Forbes, D. A., & Ponman, T. 2009, AJ, 137, 4956
- Smith et al. (2000) Smith, R. J., Lucey, J. R., Hudson, M. J., Schlegel, D. J., & Davies, R. L. 2000, MNRAS, 313, 469
- Saito et al. (2003) Saito, Y., et al. 2003, Proc. SPIE, 4841, 1180
- Schlegel et al. (1998) Schlegel, D. J., Finkbeiner, D. P., & Davis, M. 1998, ApJ, 500, 525
- Schuberth et al. (2006) Schubert, Y., Richtler, T., Dirsch, B., Hilker, M., Larsen, S. S., Kissler-Patig, M., & Mebold, U. 2006, A&A, 459, 391
- Teague et al. (1990) Teague, P. F., Carter, D., & Gray, P. M. 1990, ApJS, 72, 715
- Tonry & Davis (1979) Tonry, J., & Davis, M. 1979, AJ, 82, 954
- Tonry et al. (2001) Tonry, J., et al. 2001, ApJ, 546, 681
- Woodley et al. (2007) Woodley, K. A., Harris, W. E., Beasley, M. A., Peng, E. W., Bridges, T. J., Forbes, D. A., & Harris, G. L. H. 2007, ApJ, 134, 494
- Zepf et al. (2000) Zepf, S. E., Beasley, M. A., Bridges, T. J., Hanes, D. A., Sharples, R. M., Ashman, K. M., & Geisler, D. 2000, AJ, 120, 2928
| Mask Name | R.A.(J2000) | Decl.(J2000) | N(objects) | T(exp) | seeing (″) | Date(UT) |
|---|---|---|---|---|---|---|
| Mask-C | 12 42 50.0 | 2 40 47.4 | 36 | 21200, 1800 s | 0.8 | Apr 20, 2002 |
| Mask-1 | 12 42 33.6 | 2 44 25.8 | 35 | 31200 s | 0.8 | Apr 20, 2002 |
| Mask-3 | 12 43 08.2 | 2 43 23.4 | 34 | 31200 s | 0.6 | Apr 21, 2002 |
| Mask-4 | 12 43 06.3 | 2 38 01.8 | 36 | 31200 s | 0.6 | Apr 21, 2002 |
| Mask-6 | 12 43 03.7 | 2 48 49.8 | 27 | 41200 s | 0.6 | Apr 21, 2002 |
| Cluster | [Fe/H]aafootnotemark: | aafootnotemark: | aafootnotemark: | T(exp) |
|---|---|---|---|---|
| (dex) | (km s-1) | (sec) | ||
| NGC 6341 (M92) | 2.28 | 0.02 | 300 | |
| NGC 6205 (M13) | 1.54 | 0.02 | 300 | |
| NGC 5904 (M5) | 1.27 | 0.03 | 240 | |
| NGC 6171 (M107) | 1.04 | 0.33 | 300 | |
| NGC 6624 | 0.44 | 0.28 | 300 |
| IDa | R.A. | Decl. | (S06) | ID(S06) | ||||||
|---|---|---|---|---|---|---|---|---|---|---|
| (J2000) | (J2000) | (arcsec) | (deg) | (mag) | (mag) | (km s-1) | (km s-1) | (km s-1) | ||
| Globular Clusters | ||||||||||
| 627 | 12:42:51.95 | 2:41:58.5 | 53.3 | 36.6 | … | |||||
| 321 | 12:42:43.17 | 2:41:46.3 | 104.6 | 287.0 | 1.1-093 | |||||
| 566 | 12:42:55.43 | 2:41:43.5 | 88.3 | 71.7 | … | |||||
| ………. | ||||||||||
| Stars | ||||||||||
| 1348 | 12:42:33.86 | 2:45:39.7 | 356.4 | 317.8 | … | |||||
| 204 | 12:42:35.24 | 2:41:45.4 | 220.7 | 277.7 | … | |||||
| 90 | 12:43:09.34 | 2:42:21.4 | 299.5 | 77.3 | … | |||||
| ………. | ||||||||||
| Galaxies | ||||||||||
| g1 | 12:42:38.39 | 2:46:10.2 | 340.8 | 329.8 | … | |||||
| g2 | 12:43:02.44 | 2:50:11.4 | 568.0 | 19.4 | … | |||||
| NGC 4636 | 12:42:49.84 | 2:41:15.7 | 0.0 | 0.0 | … | |||||
| Probable Intracluster Globular Clusters in the Virgo Cluster | ||||||||||
| 1192 | 12:43:12.88 | 2:45:21.1 | 423.4 | 54.6 | … | |||||
| 1293 | 12:43:00.62 | 2:41:39.4 | 163.3 | 81.6 | … | |||||
| 644 | 12:43:15.71 | 2:45:07.0 | 451.3 | 59.2 | … | |||||
Note. — The complete version of this table is in the electronic edition of the Journal. The printed edition contains only a sample.