11email: jj@iiap.res.in
Long-term variations in the mean meridional motion of thesunspot groups
Abstract
Aims. We seek the long-term variations close to the length of a solar cycle in the mean meridional motion of sunspot groups (a proxy of the meridional plasma flow).
Methods. Using the largest set of available reliable sunspot group data, the combined Greenwich and Solar Optical Observation Network sunspot group data during the period 1879 – 2008, we determined variations in the mean meridional motion of the sunspot groups in the Sun’s whole northern and southern hemispheres and also in different latitude intervals. We determined the variations from the yearly data and for the sake of better statistics by binning the data into 3 – 4 year moving time intervals (MTIs) successively shifted by one year. We determined the periodicities in the mean meridional motion from the fast Fourier transform (FFT) power spectrum analysis. The values of the periodicities are determined from the maximum entropy method (MEM) and the temporal dependencies of the periodicities are determined from the Morlet-wavelet analyses.
Results. We find that the mean meridional motion of the spot groups varies considerably on a time scale of about 5 – 20 years. The maximum amplitude of the variation is about 10 – 15 m s-1 in both the northern and the southern hemispheres. Variation in the mean motion is considerably different during different solar cycles. At the maximum epoch (year 2000) of the current cycle 23, the mean motion is relatively strong in the past 100 years and northbound in both the northern and the southern hemispheres. This abnormal behavior of the mean motion may be related to the low strength and the long duration of the current cycle, and also to the violation of the Gnevyshev and Ohl rule by the cycles pair 22,23. The power spectral analyses suggest the existence of 3.2- and 4.3-year periodicities in the mean motion of the spot groups in the southern hemisphere, whereas a 13 – 16 year periodicity is found to exist in the mean motion of the northern hemisphere. There is strong evidence for a latitude-time dependency in the periodicities of the mean motion. The north-south difference in the mean motion also varies by about 10 m s-1. During the recent cycles, the north-south difference is negligibly small. Approximate 12- and 22-year periodicities are found to exist in the north-south difference. The implications of all these results are briefly discussed.
Key Words.:
Sun: rotation – Sun: magnetic fields – Sun: activity – Sun: sunspots1 Introduction
The study of the variations in the meridional flows is important for understanding the underlying mechanism of the solar cycle (Babcock 1961; Ulrich & Boyden 2005). Surface Doppler measurements and helioseismology measurements of the surface and the subsurface flows (e.g., Ulrich & Boyden 2005; González Hernández et al. 2008) suggest poleward flows of about 10 – 20 m s-1 and a considerable north-south asymmetry in the meridional flow. Surface Doppler measurements are available for about 3 cycles (Ulrich & Boyden 2005). Doppler measurements suffer from errors caused by the scatter light and the B-angle influences (Beckers 2007). The motions of many magnetic tracers, particularly sunspots, have been used for a long time as a proxy of the fluid motions to study the solar rotational and the meridional flows (Schröter 1985; Javaraiah & Gokhale 2002). The sunspot data have been available for more than 100 years. However, the derived rates of rotation and meridional flows depend on the method of the selection of the spots or the spot groups (e.g., Howard et al. 1984; Balthasar et al. 1986; Zappalá & Zuccarello 1991; Zuccarello 1993; Javaraiah & Gokhale 1997a; Javaraiah 1999; Hiremath 2002; Sivaraman et al. 2003). Proper motions and evolutionary factors of the spot groups may also influence the derived rates of the flows to some extent. The proper motions are random in nature, hence their effect can be reduced with the use of a large data set. Recently, Ruždjak et al. (2005) have found that evolutionary factors of the sunspot groups in the determination of the positions of the spot groups is small in the estimated mean meridional motion of the spot groups.
A number of scientists studied the solar cycle variations of the mean meridional motion of the spot groups (see Javaraiah & Ulrich 2006). Since yearly data are inadequate for this purpose, particularly around a solar cycle minimum, some authors have used the superposed epoch analysis of the data during a few or all cycles for which the data were available and studied the mean solar cycle variation (Balthasar et al. 1986; Howard & Gilman 1986). Recently, by using the same method, Javaraiah & Ulrich (2006) analyzed the combined Greenwich and Solar Optical Observation Network sunspot group data during the period 1879 – 2004 and determined the mean solar cycle variation in the meridional motions of the sunspot groups. In that early paper, the spot group data during the cycles 12 – 20 were superposed according to the minima of these cycles. This yielded an average solar cycle variation of the meridional motion over about 5 – 9 cycles, which suggests that only around the end of a solar cycle the meridional motion is considerably significant from zero and it is poleward in both the northern and the southern hemispheres. However, during some individual cycles the variations may be considerably different from this average solar cycle variation. Javaraiah & Ulrich (2006) also determined the cycle-to-cycle variation of the mean (over the duration of a cycle) meridional motion of the spot groups during cycles 12 – 23 and found the existence of a weak long-period cycle (Gleissberg cycle) in the cycle-to-cycle variation of the mean motion. Since the meridional speed is negligibly small or zero in some phases of a cycle or even with opposite signs during different phases of some cycles, hence, the motions are washed out in the average over the cycle. In order to get rid of this problem in the study of long-term variations in the mean meridional motion, it is necessary to analyse the spot or the spot group data in the intervals considerably shorter than the length of a solar cycle.
In the present paper we have analyzed the annual spot group data during 1879 – 2008 and determined the variations in the mean meridional motions of the spot groups in the northern and the southern hemispheres. As expected the statistics is poor in case of the results derived from the annual data, particularly at the cycles minima. We have taken some additional precautions, so it is possible to see the patterns of the variations when they are close to a solar cycle length, even in the annual time series. However, we have also determined the variation in the mean meridional motion of the spot groups by binning the spot group data into the moving-time intervals (MTIs) of lengths (3 – 4 years) considerably greater than a year, but reasonably smaller than the length of a cycle; , less than the half of the length of a cycle. In such a time-series which comprised the longer time intervals, it is relatively easy to detect the long-term variations near the length of a solar cycle (Javaraiah & Gokhale 1995, 1997b). In addition, the sizes of these series reasonably large. Hence, it enabled us to find the periodicities that approach the length of a solar cycle from the power spectral analysis.
In the next section we describe the data and analysis. In Sect. 3 we present the variations in the mean meridional motion of the spot groups in the whole northern and the southern hemispheres, as well as in different latitude intervals–and the corresponding differences between the whole northern and the southern hemispheres–during the period 1879 – 2008 and point out their important features. In the same section, we show the periodicities in the mean meridional motion of the spot groups from the traditional FFT analyses. From the MEM analyses, we determined the values of the periodicities, and from the Morlet-wavelet analyses we determined the temporal dependencies of the detected periodicities. In Sect. 4 we summarize the results and the conclusions, and briefly discuss the implications of these results for understanding the solar long-term variability.
2 Data and analysis
We have used the combined Greenwich (1879 – 1976) and Solar Optical Observation Network (SOON) (1977 – 2008) sunspot group data, which are taken from David Hathaway’s website http://solarscience.msfc.nasa.gov/greenwch.shtml. These data include the observation time (the Greenwich data contain the date with the fraction of the day, the SOON data do not contain the fraction of the day), heliographic latitude and longitude, and central meridian distance (CMD), etc., of the spot groups for each day of observation. The positions of the groups are geometrical positions of the centers of the groups. The Greenwich data were compiled from the majority of the white light photographs, which were secured at the Royal Greenwich Observatory and at the Royal Observatory, Cape of Good Hope. The gaps in their observations were filled with photographs from other observatories, including the Kodaikanal Observatory, India. The SOON data included measurements made by the United States Air Force (USAF) from the sunspot drawings of a network of the observatories that includes telescopes in Boulder, Colorado, Hawaii, etc. David Hathaway scrutinized the Greenwich and SOON data and produced a reliable continuous data series from 1874 up to now. However, in this corrected data there may be some minor differences mainly in the values of the areas of the spot groups of the two datasets (Hathaway & Choudhary 2008). We did not use the data before 1879 because of the large uncertainties in the 1878 Greenwich data (Balthasar et. al. 1986; Javaraiah & Gokhale 1995).
Here the data reduction and the determination of the meridional motions of the spot groups is the same as described in Javaraiah & Ulrich (2006). The data on the recurrent and the non-recurrent spot groups are combined. The meridional velocity (daily rate of the latitudinal drift) of a spot group is computed using the difference between the epochs of its observation in consecutive days and the heliographic latitudes of the spot group at these epochs. For the sake of convenience in determining the north-south difference in the mean meridional motion of the spot groups, we used the sign convention, a positive value represents the northbound motion in both the northern and the southern hemispheres. As in the paper referred to above, we have taken the following precaution to substantially reduce the uncertainties in the derived results (Ward 1966; Javaraiah & Gokhale 1995): We excluded the data corresponding to the on any day of the spot group’s life span. Furthermore, we excluded the data corresponding to the ‘abnormal’ motions, e.g., displacements exceeding day-1 in the longitude or day-1 in the latitude. In addition, we did not use the data corresponding to the time-difference 2 days of the spot group’s life span.
We determined the variations in the mean meridional motion of the sunspot groups in the whole northern hemisphere and in the whole southern hemisphere, and also in the separate latitude intervals. The variations in the mean motion of the spot groups in a whole hemisphere are determined from the yearly data and from the data in 3- and 4-year MTIs during the period 1979 – 2008. For the separate latitude intervals, we used only the 4-year MTIs because, in a shorter than 4-year interval, the data are found to be inadequate and the error bars are too large to plot the results, particularly during the cycle minima. The accuracy in determining the heliographic coordinates of the mass center of a sunspot group can be estimated as close to and therefore error in the calculations of daily velocity values can be estimated to day-1 ( cm s-1) (Balthasar & Wöhl 1980; Zappalá & Zuccarello 1991). However, error in determining the mean velocity is inversely proportional to the square root of the number of observations used, and for example, it is on the order of day-1 ( cm s-1) for 200 observations. The number of data points are considerably more in several years of the annual series and in most of the intervals of the aforementioned MTIs series. As a result, the determined mean velocity is highly accurate with respect to the mentioned error. To determine the periodicities in the mean meridional motion of the spot groups using the power spectral techniques, we applied some corrections to the original data, described in the next section, where we describe the time series.
Since the lengths of the time series are inadequate for precisely measuring the values of 11-year periodicities from the FFT analysis, the uncertainties are large in the such periodicities determined here from the FFT analysis. A different approach to determining the values of the periodicities in a short time series with higher accuracy is to compute the power spectrum using MEM. MEM analysis is a parametric modeling approach to estimating the power spectrum of a time series. The method is data adaptive, since it is used upon an autoregressive modeling process. An important step in this method is the optimum selection of the order () of the autoregressive process, which is the number of immediately previous points that are used in calculating a new point. If is chosen too low, the spectrum is over-smoothed and the high resolution potential is lost. If is chosen too high, frequency shifting and spontaneous splitting of the spectral peaks occurs. The MEM code that we used here takes the values for in the range (, ) (Ulrych & Bishop 1975) or (Berryman 1978), where is the total number of intervals in the analyzed time series. To find the correct values of the periodicities found in the FFT power spectrum, we computed MEM power spectra by choosing various values for in the range (, ) and . We find that is suitable in the present MEM analysis; , in the derived spectra the peaks are considerably sharp and well separated.
The wavelet analysis is a powerful method for analyzing localized variations in the power within a time series at many different frequencies (Torrence & Compo 1998). We did the Morlet wavelet analysis to determine the temporal dependencies in the periodicities found in the mean meridional motion of the spot groups from the FFT and MEM analysis.
3 Results


3.1 Temporal variations
Figure 1 shows the variations in the mean meridional motion of the sunspot groups in the northern and the southern hemispheres and the corresponding north-south difference, determined from the yearly spot group data during 1879 – 2008. Figure 2 is the same as Fig. 1, but determined from the data in 4-year MTIs (3-years MTIs series is not shown because it is found to be almost the same as that of 4-year MTIs series). Figure 3 shows the variations in the mean meridional motion of the spot groups in different 10∘ latitude intervals determined from the data in 4-year MTIs. To study the solar cycle variations in the mean meridional motion, we also show the variations in the sunspot activity in all these figures.
As can be seen in Fig. 1(a), in the case of the original annual series, the error bars are large. (The error bars are at the 1 level, where is the standard error, and are the standard deviation and the number of data points in a given interval, respectively.) In addition, there are some large spikes in the time series during the minima of some cycles. We therefore applied the corrections to those values whose values exceeded 2.6 times (correspond to 99% confidence level) the corresponding median values or to those values 15 m s-1; , these values are replaced with the average of the corresponding values and their respective two neighbors. (For the beginnings of the time-series it is the average of the values in the intervals 1 and 2 and in the endings it is the average of the values in the intervals and .) In the north-south differences (, lower panels of Figs. 1 and 2), the error bar represents the 1 level (, where and represent the standard errors of the mean values of the northern and southern hemispheres, respectively). As can be seen in Fig. 2, in the case of the variations determined from 4-year MTIs (in case of Fig. 3 in the lower latitude intervals), the size of a error bar is small. However, we also applied the aforementioned corrections to the MTIs time-series. In these cases, the corrected time series included the values that are 10 m s-1. We used 15 m s-1 limit in the case of the annual time series because the amplitude of the variation is much larger than in the MTIs series, and to exclude only extreme outliers in the time series.
In Figs. 1 – 3 we can see the following:
-
•
The pattern of the solar cycle variation in the mean meridional motion of the spot groups is different during different solar cycles. At the maximum epoch (year 2000, see Fig. 1) of the current cycle 23, the mean motion is stronger than in the last 100 years and northbound in all the latitude intervals in both the northern and the southern hemispheres. (The mean meridional motion is strong and poleward in the northern hemisphere and strong and equatorward in the southern hemisphere.) In this cycle the overall pattern of the variation in the mean motion closely resembles the shape of this cycle; , there is a high correlation between the activity and the mean meridional motion.
-
•
Overall there is a suggestion that the mean meridional motion of the spot groups varies considerably on time scales of 5 – 20 years. The maximum amplitudes of the mean variations in the northern and the southern hemispheres determined from the annual data is about 10 – 15 m s-1. The amplitude of the mean variations determined from the 4-MTIs is on average about 5 m s-1 and seems to be slightly large in the individual 10∘ latitude intervals (see Fig. 3).
-
•
The difference between the mean motions in the northern and the southern hemispheres also varies on 5 – 20 year time scales with the maximum amplitude 5 – 10 m s-1. However, the north-south difference is statistically significant mainly during the early cycles, 12 – 16, which are relatively weak ones, and mainly contributed from the differences in the motion of the high latitudes. The difference is negligibly small during the recent cycles. That is, during the recent cycles, particularly in the current cycle 23, the motion is highly symmetric about the equator.
Besides the above main features, in Figs. 1 – 3 one can also see the following features:
-
•
Around the maxima of the large amplitudes cycles (e.g., 17, 18, 19, and 21), the average motion in the whole Sun seems to be slightly southward, whereas for weak cycles the motion is either not significantly different from zero (cf., cycles 16 and 20), or very different from zero and has northward direction (cf., 12, 14 and 23). During the minima of several cycles, the motion seems to be strongly southward, and in some cycles (cf., 16 and 20) it seems to go in opposite directions in the northern and the southern hemispheres.
-
•
The behavior (changes in the phase seem to be taken place) of the meridional motions is very different between the northern and the southern hemispheres during the start of cycles 16 and 20 (see Fig. 2), which are weak cycles that are four cycles apart. A 44-year cyclic behavior is seen in the sunspot activity (Javaraiah 2008).
-
•
Near the maxima of the much longer cycles (e.g., 13 and 23) in the high latitudes of both the northern and southern hemispheres, the mean motion is largely northbound. Javaraiah & Ulrich (2006) found a positive correlation between the mean meridional motion of the spot groups of a cycle, mainly in the latitude interval of the northern hemisphere, and the length of the same cycle. In Fig. 3 the pattern of the variation in the mean meridional motion of the spot groups in the latitude interval of the northern hemisphere is largely consistent with this result.
3.2 FFT power spectra
Figure 4 shows the FFT power spectra of the corrected annual time series of the mean meridional motions of the spot groups in the northern and the southern hemispheres and that of the corresponding north-south difference, during 1879 – 2008. Figure 5 shows the FFT power spectra (low-frequency sides) of the mean meridional motions of the spot groups in 4-year MTIs. It should be noted here that, in the FFT power spectrum of the data binned in the longer intervals (e.g. 4-year MTIs), the peaks corresponding to the high-frequency side are washed out and the low-frequency peaks are became broader.

As can be seen in Fig. 4, there are several peaks in each of the FFT spectra of the yearly data of the mean meridional motion of the spot groups. However, only the following peaks are significant on more than 99% confidence level ( levels): In the spectrum of the northern hemisphere, the peak at frequency year-1 (period years); in the spectrum of the southern hemisphere, the two peaks of relatively high frequencies which are closer to year-1 ( years) and year-1 ( years); and in the spectrum of the north-south difference, the peak at frequency year-1 (period years). In the spectrum of the northern hemisphere, the peak at year-1 ( years) is significant on a 99% confidence level. As can be seen in Fig. 5, which shows the low-frequency sides of the power spectra of the data in the 4-year MTIs, in the spectrum of the northern hemisphere the broad peak of the year period is significant on a 99% confidence level. In the corresponding spectrum of the southern hemisphere, the peak at year-1 ( years) is significant on a 99% confidence level, and the peak at year-1 ( years) is significant on a 95% confidence level. (A similar peak is also present in the yearly data.) In the spectrum of the north-south difference, a peak at year-1 ( years) is significant on more than a 99% confidence level, and the peak at 1/18 year -1 significant on a 95% confidence level. Overall, all these results suggest that there are around 5 – 20 years periodicities in the mean meridional motion of the spot groups and that there are considerable differences in their levels of significance between the northern and the southern hemispheres.

Figure 6 shows the FFT power spectra of the mean meridional motion of the spot groups in different latitude intervals of the northern and the southern hemispheres during 4-year MTIs. As can be seen in these spectra, there is considerable latitude dependence in the periodicity of the mean motion of the spot groups in a hemisphere. For example, the statistically significant year periodicity found above in the mean motions of the spot groups in the northern hemisphere seems to contain more contribution from the motions of the groups in – 30∘ latitude interval. Besides this, the FFT spectrum of the mean motion in this latitude interval has a strong peak around year-1 ( year). In addition, there is a suggestion that this (11 – 13 year) periodicity was strong in the mean meridional motion of the spot groups in the – 30∘ latitude interval of the northern hemisphere, whereas it was strong in the mean meridional motion of the spot groups in – latitude interval of the southern hemisphere.
We would like to mention that most of the relatively high peaks in the FFT spectra seem to appear at frequencies that correspond to the integral multiples of one of the frequencies. Hence, they may look suspiciously like mathematical artifacts. However, they may not be mathematical artifacts since the length of the data used here is longer than double the longest period that we find here. In addition, before computing the FFT, the mean value was subtracted and a cosine bell function was applied to both the first and the last 10% of the time series. These processes detrend the time series and minimize the aliasing and leakage effects (Brault & White 1971). The existence of the ‘harmonics’ and ‘subharmonics’ may be a consequence of the Sun’s behavior as a forced nonlinear oscillator (e.g., Bracewell 1988; Gokhale et al. 1992; Gokhale & Javaraiah 1995).


3.3 MEM power spectra
Figures 7 and 8 show the MEM power spectra of the mean meridional motion of the spot groups determined from the corrected data of the annual and the 4-year MTIs time-series. As can be seen in these figures, each MEM spectrum shows a number of well-defined peaks. The MEM spectrum of the annual data of the southern hemisphere show the values 4.3-year and 3.2-year, and that of the north-south difference shows the value 11.9-year, for the corresponding significant periodicities found from the FFT analyses. The MEM spectrum of the 4-year MTIs of the southern hemisphere shows the value 50-year for the year peak found in the corresponding FFT spectrum. The high significant broad peak of the 16-year periodicity found in the FFT spectra of the northern hemisphere data is broken into 13.1-year and 18-year peaks in the corresponding MEM spectra. The 13.1-year periodicity peaks are well-defined in the MEM spectra of both the annual and the 4-MTIs time series of the northern hemisphere data. In addition, the MEM spectrum of the 4-year MTIs also shows a well-defined peak with 29.8-year periodicity.


The 3.5-year periodicity found in the FFT spectrum of the annual data of the northern hemisphere is also present in the corresponding MEM spectrum, but the corresponding peak is not clearly defined. The peaks of 2.3-year and 4.3-year periodicities are present in the MEM spectra of all the three annual time series. The MEM spectrum of the annual data of the north-south asymmetry also shows the peaks of 5.6-year and 2.7-year periodicities and the spectrum of corresponding 4-year MTIs shows a peak of 22.2-year periodicity.


Figure 9 shows the MEM spectra of the corrected data in the different latitude intervals of the northern and the southern hemispheres during the 4-year MTIs. As can be seen in this figure, the results from the MEM analysis are consistent with the results found from the FFT analyses and suggest that there is a strong hemispheric and latitude dependency in the periodicities of the mean motion of the spot groups.
3.4 Wavelet power spectra
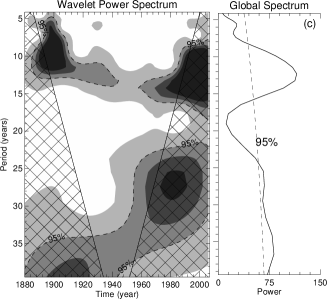
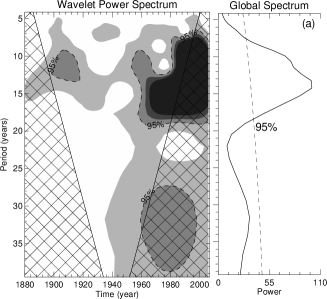
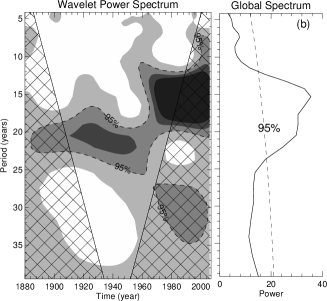
Figures 10 and 11 show the Morlet wavelet power spectra, normalized by (here is the standard deviation of the concerned data sample), and the corresponding global spectra of the mean meridional motion of the spot groups determined from the corrected annual and 4-MTIs time series, respectively. As can be seen in Fig. 10, during the period 1880 – 2007, the 3.2-year and 4.3-year periodicities occurred relatively consistently in the mean meridional motion of the spot groups in the southern hemisphere. This result is highly consistent with the result that the aforementioned periodicities are found statistically significant in the FFT analysis. The 3.2-year periodicity and also a 2.3-year periodicity were prominent around 1990. In the wavelet spectra, Figs. 10(b) and 11(b), of the mean motion of the spot groups in the southern hemisphere, there is a suggestion that the dominant periodicity evolved slowly with time, from 15 years to 30 years, over the period 1880 – 2007. In Figs. 10(a) and 11(a) there is a suggestion that the 13.1-year periodicity and a 20-year periodicity of the mean motion of the spot groups in the northern hemisphere are strong after 1980 and before 1920. The 30-year periodicity seems to have occurred throughout the period 1880 – 2007, with more powerfully before 1920 and after 1960.
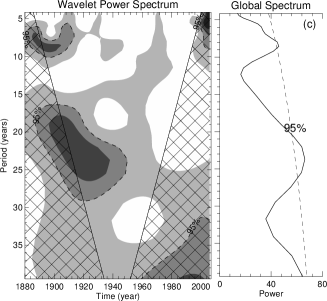
In Figs. 10(c) and 11(c) there is an evidence that the 11.9-year periodicity occurred consistently in the north-south difference in the mean motion. This is consistent with that the same periodicity is found to be highly significant in the FFT analysis of the north-south difference. The 29-year periodicity in the north-south difference (found in the MEM analysis) was weak or absent after around 1970. In fact, the north-south difference is itself very small and statistically insignificant during the recent cycles (see Figs. 1 and 2).
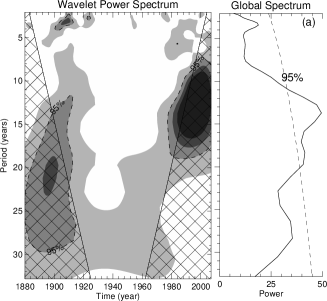
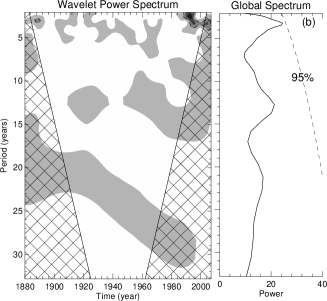
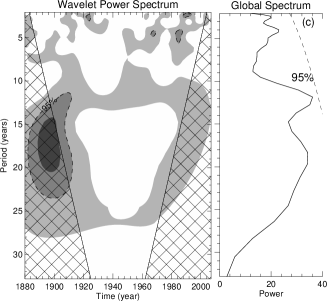
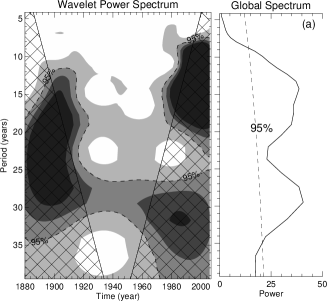
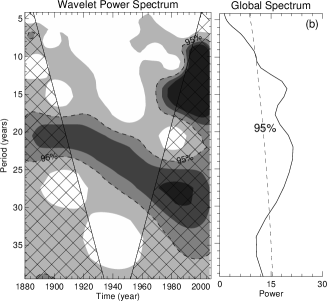
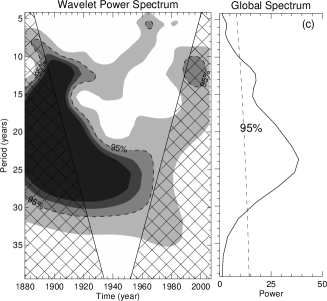
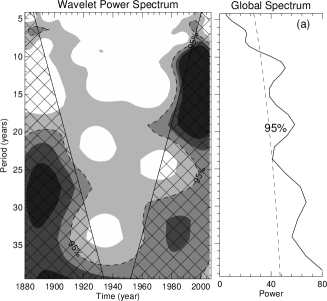
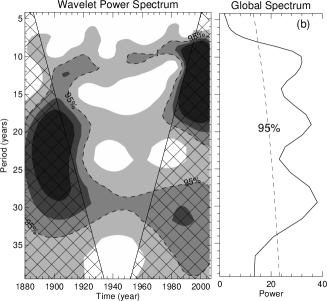
Figure 12 shows the wavelet power spectra of the corrected data in the different latitude intervals of the northern and the southern hemispheres, in the 4-year MTIs. As can be seen in this figure, there is a considerable latitude-time dependence in the periodicities of the mean meridional motion of the spot groups. The 20-year and the 30-year periodicities probably exist in the mean meridional motion of the spot groups of the lower latitudes of the northern hemisphere, throughout the period 1880 – 2007. The evolution of a 15-year periodicity to a 30-year periodicity, seen above in the spectrum of the mean motion of the whole southern hemisphere (see Fig. 10(b)), is not clearly visible in the spectrum of the mean motion in any latitude interval of this hemisphere. On the other hand, there is a suggestion that, in latitude interval of the northern hemisphere, a periodicity in the mean motion evolved from 16 years to 10 years over the period 1880 – 2007. It was the opposite in the – latitude-interval. In this latitude interval, the 40-year periodicity might have evolved to a 25-year periodicity. Overall the wavelet analyses suggest that there is a considerable latitude-time dependency in the periodicities in the mean meridional motion of the spot groups.
4 Conclusions and discussion
From the analysis of the largest available reliable sunspot group data; , the combined Greenwich and SOON sunspot group data during the period 1879 – 2008, we find the following.
-
1.
The mean meridional motion of the sunspot groups varies considerably on 5 – 20 year timescales during the period 1879 – 2008. The maximum amplitude of the variation is 10 – 15 m s-1.
-
2.
The pattern and amplitude of the solar cycle variation in the mean motion are significantly different during the different cycles. During the maximum epoch (year 2000) of the current cycle, the mean motion is relatively stronger than in the past 100 years, and it is northbound in both the northern and the southern hemispheres.
-
3.
The north-south difference (north-south asymmetry) in the mean meridional motion of the spot groups also varies with a maximum amplitude of about 10 m s-1. The north-south difference was considerably larger during the early cycles (with a strong contribution from the high latitudes). It is negligible during the recent cycles.
-
4.
Power spectral analyses suggest that 3.2- and 4.3-year periodicities exist in the mean meridional motion of the spot groups of the southern hemisphere, whereas a 13 – 16 year periodicity is found in the mean motion of the spot groups of the northern hemisphere.
-
5.
The 12- and 22-year periodicities are found to exist in the north-south difference of the mean motion.
-
6.
There is a considerable latitude-time dependence in the periodicities of the mean meridional motion of the spot groups. There is a strong suggestion that, in the – latitude-interval of the northern hemisphere, a periodicity slowly evolved from 16 year to 10 year, over the period 1880 – 2007, and it evolved in the opposite way, 10 year to 16 year, in – latitude interval.
The behavior of the mean motion of the spot groups in cycle 23 is similar to that of cycle 14, which is a low-amplitude (lowest in the last century) and considerably long-duration cycle. Cycle 23 is also a relatively low-amplitude and long-duration cycle, so that the result above (conclusion (2)) may be a part of a real long-term behavior in the mean meridional motion of the spot groups; , most probably it is not an artifact of the differences (if any) between the Greenwich and the SOON datasets, within the continuous time series of the combined dataset used here.
Most of the helioseismic measurements of the meridional flows during the current sunspot cycle 23 suggest an increase in the amplitudes of the surface and the subsurface poleward meridional flows with a decrease in magnetic activity (González Hernández et al. 2008), whereas we find a strong northbound mean meridional motion of the spot groups during the maximum of cycle 23. A reason for this discrepancy may be that sunspot motions may not represent the Sun’s plasma motions (D’Silva & Howard 1994), or the motions of the magnetic structures may represent the motions of the deeper layers of the Sun’s convection zone where these structures are anchored (Javaraiah & Gokhale 1997a; Hiremath 2002; Sivaraman et al. 2003; Meunier 2005). In addition, the mean meridional motion of the sunspot groups may only represent the mean solar meridional plasma motion at low and middle latitudes, because sunspots data are confined to only these latitudes. The magnetic structures of the only large spot groups during their initial days might be anchored near the base of the convection zone (Javaraiah & Gokhale 1997a; Hiremath 2002; Sivaraman et al. 2003), hence might have largely equatorward motions (Javaraiah 1999). While rising through the convection zone, the magnetic structures of the large spot groups may be fragmented into the smaller structures (Javaraiah 2003; Schüssler & Rempel 2005). The small structures may move mainly toward the poles (Švanda et al. 2007). However, as can be seen in Figs. 1 – 3 there are also equatorward motions (may be due to an effect of the reverse meridional flows), mainly near minima of the cycles where a spot group is relatively small.
Meridional flows can transport magnetic flux and cause cancellation/enhancement of magnetic flux, and it is believed that poleward meridional flows play a major role in the polarity reversals of the polar magnetic fields (, Wang 2004). The 12-year and the 22-year periodicities of the north-south difference in the mean meridional motion of the spot groups may have a close relationship with the 11-year solar activity (the emerging magnetic flux) cycle and the 22-year solar magnetic cycle, respectively. Many of the other periodicities found here also exist in several activity phenomena (Knaack et al. 2005; Song et al. 2009, and references therein) and solar differential rotation determined from sunspot data (Javaraiah & Gokhale 1995, 1997b; Javaraiah & Komm 1999; Brajša et al. 2006). They may be closely related to the Rossby type waves that were discussed by Ward (1965) and others (e.g., Knaack et al. 2005; Chowdhury et al. 2009).
According to the well known Gnevyshev and Ohl rule (G-O rule), an odd cycle is stronger than its immediately preceding even cycle (Gnevyshev & Ohl 1948). Cycle pair 22,23 violated the G-O rule. The duration of the current cycle 23 is very long, and during the declining phase of this cycle, the activity in the southern hemisphere is considerably stronger than in the northern hemisphere. All these properties of the cycle 23 could be strongly related to the large and northbound mean meridional motion of the spot groups during this cycle. As already mentioned above, motions of magnetic structures such as sunspots mimic the motions of deeper layers of the Sun (see also Javaraiah & Gokhale 2002). Therefore, the magnetic flux cancellation/enhancement due to the mean meridional motion of sunspot groups may take place in the subsurface layers of the Sun. By considering the poleward meridional plasma flows detected by surface Doppler measurements and by helioseismology, the deeper counter-motion (suggested by the mean meridional motion of spot groups) might amplify the action of the near-surface dynamo in the southern hemisphere during cycle 23 for causing stronger magnetic activity on this hemisphere.
Acknowledgements.
I am thankful to the anonymous referee for the critical review and very useful comments and suggestions. I also thank Dr. L. Bertello for useful comments and suggestions. Wavelet software was provided by C. Torrence and G. Compo, and is available at URL: http//paos.colorado.edu/research/wavelets/. The MEM FORTRAN code was provided to us by Dr. A. V. Raveendran.References
- (1) Babcock, H. W., 1961, ApJ, 133, 572
- (2) Balthasar, H., & Wöhl, H., 1980, A&A, 92, 111
- (3) Balthasar, H., Vázquez, M., & Wöhl, H., 1986, A&A, 155, 87
- (4) Beckers, J. M., 2007, Sol. Phys., 240, 3
- (5) Berryman, J. G., 1978, Geophys., 43, 1384
- (6) Bracewell, R. N., 1988, MNRAS, 230, 535
- (7) Brajša, R., Ruždjak, D., & Wöhl, H., 2006, Sol. Phys., 237, 365
- (8) Brault, J. W., & White, O. R., 1971, A&A, 13, 169
- (9) Chowdhury, P., Khan, M., & Ray, P. C., 2009, MNRAS, 392, 1159
- (10) D’Silva, S., & Howard, R. F., 1994, Sol. Phys., 151, 213
- (11) Gnevyshev, M. N., & Ohl, A. I., 1948, Astron. ZH., 25, 18
- (12) Gokhale, M. H., & Javaraiah, J., 1995, Sol. Phys., 156, 157
- (13) Gokhale, M. H., Javaraiah, J., Kutty, K. N., & Verghese, B. A., 1992, Sol. Phys., 138, 35
- (14) González Hernández, I., Kholikov, S., Hill, F., Howe, R., & Komm, R., 2008, Sol. Phys., 252, 235
- (15) Hathaway, D. H., & Choudhary, D. P., 2008, Sol. Phys. 250, 269
- (16) Hiremath, K. M., 2002, A&A, 386, 674
- (17) Howard, R., & Gilman, P. A., 1986, ApJ, 307, 389
- (18) Howard, R., Gilman, P. I., & Gilman, P. A., 1984, ApJ, 283, 373
- (19) Javaraiah, J., 1999, Sol. Phys., 189, 289
- (20) Javaraiah, J., 2003, in Current Theoretical Models and Future High Resolution Solar Observations: Preparing for ATST, ed. A. A. Pevtsov & H. Uitenbroek (San Francisco: Astronomical Society of the Pacific, ISBN: 1-58381-129-X), ASP Conf. Ser., 286, 325
- (21) Javaraiah, J., 2005, MNRAS, 362, 1311
- (22) Javaraiah, J., 2008, Sol. Phys., 252, 419
- (23) Javaraiah, J., & Gokhale, M. H., 1995, Sol. Phys., 158, 173
- (24) Javaraiah, J., & Gokhale, M. H., 1997a, A&A, 327, 795
- (25) Javaraiah, J., & Gokhale, M. H., 1997b, Sol. Phys., 170, 389
- (26) Javaraiah, J., & Gokhale, M. H. (eds.), 2002, The Sun’s Rotation, New York: NovaScience
- (27) Javaraiah, J., & Komm, R. W., 1999, Sol. Phys., 184, 41
- (28) Javaraiah, J., & Ulrich, R. K., 2006, Sol. Phys., 237, 245
- (29) Knaack, R., Stenflo, J. O., & Berdyugina, S. V., 2005, A&A , 438, 1067
- (30) Meunier, N., 2005, A&A, 436, 1075
- (31) Ruždjak, D., Brajša, R., Sudar, D., & Wöhl, H., 2005, Sol. Phys., 229, 35
- (32) Schröter, E. H., 1985, Sol. Phys., 100, 141
- (33) Schüssler, M., & Rempel, M. 2005, A&A, 441, 337
- (34) Sivaraman, K. R., Sivaraman, H., Gupta, S. S., & Howard, R.F., 2003, Sol. Phys., 214, 65
- (35) Song, W. B., Feng, X. S., Shen, F. & Zhang, Y. Z., 2009, Sol. Phys. 257, 83
- (36) Švanda, M., Kosovichev, A. G., & Zhao, J., 2007, ApJ, 670, L69
- (37) Torrence, Ch., & Compo, G. P. 1998, Bull. Am. Meteor. Soc., 79, 61
- (38) Ulrich, R. K., & Boyden, J. E., 2005, ApJ, 620, L123
- (39) Ulrych, T. J., & Bishop, T. N., 1975, Rev. Geophys. Space Phys., 13, 183
- (40) Wang, Y.-M., 2004, Sol. Phys. 224, 21
- (41) Ward, F., 1965, ApJ, 141, 534
- (42) Zappalá, R. A., & Zuccarello, F., 1991, A&A, 242, 480
- (43) Zuccarello, F., 1993, A&A, 272, 587