Contribution of Cross-Correlations to the 21cm Angular Power Spectrum in the Epoch of Reionization
Abstract
Measurement of the 21cm hyperfine transition of neutral hydrogen provides a unique probe of the epoch of reionization and the Dark Ages. Three major mechanisms are believed to dominate the radiation process: emission from neutral hydrogen surrounding the ionized bubbles of first galaxies and/or quasars, emission from neutral hydrogen inside minihalos, and absorption of diffuse neutral hydrogen against the cosmic microwave background. In the present work, by simply combining the existing analytic models for the three mechanisms, we investigate the contribution of cross-correlation between these three components to the total 21cm angular power spectrum, in the sense that neutral hydrogen associated with different radiation processes traces the large-scale structures of underlying density perturbations. While the overall 21cm power spectrum remains almost unchanged with the inclusion of the cross-correlations, the cross-correlation may play a key role in the determination of the 21cm power spectrum during the transition of 21cm radiation from emission-dominated phase to absorption-dominated phase at redshift . A significant suppression in the 21cm angular power spectrum during this transition is anticipated as the result of negative contribution of the cross-correlation between the absorption of diffuse neutral hydrogen and the emission components. Therefore, an accurate prediction of the cosmic 21cm power spectrum should take the cross-correlation into account especially at the transition phase.
keywords:
cosmology: theory — large-scale structure of universe — diffuse radiation — intergalactic medium1 Introduction
The 21cm hyperfine transition of neutral hydrogen in the form of either emission or absorption against the cosmic microwave background (CMB) provides a unique probe of the history of our universe between the surface of last scattering () and the end of reionization (). While the expected brightness temperature of these 21cm signals is two orders of magnitude smaller than the CMB temperature and can be easily swamped by extremely strong foreground such as the Milky Way, many ambitious radio facilities (e.g. 21CMA111See http://cosmo.bao.ac.cn, LOFAR222See http://www.lofar.org, MWA333See http://www.haystack.mit.edu/arrays/MWA, PAPER444See http://astro.berkeley.edu/dbacker/eor, SKA555See http://www.skatelescope.org, etc) have been constructed and are being planned to search for the weak signals primarily from the epoch of reionization (EOR) at . Indeed, the Dark Ages and the EOR may constitute the last frontier of observational cosmology.
There have been many efforts - both theoretical and numerical - over the past few years aimed at understanding various physical processes in the intergalactic medium (IGM) during the EOR [see Furlanetto, Oh & Briggs 2006 and Morales & Wyithe 2009 for a review]. In order to make the 21cm signals visible, the spin temperature of neutral hydrogen must differ from the temperature of the CMB, , and an effective mechanism exists to couple the spin temperature to the gas temperature. Apart from some exotic scenarios such as dark matter particle decay, three mechanisms are believed to play dominant roles in the generation of observable 21cm signals from the Dark Ages to the EOR: scattering of UV photons of first stars primarily through the so-called Wouthuysen-Field effect (Wouthuysen 1952; Field 1959), heating of IGM by collision mainly within minihalos (Madau, Meiksin & Rees 1997; Iliev et al. 2002), and absorption of uncollapsed IGM against the CMB radiation prior to the formation of first cosmic structures (Scott & Rees 1990; Loeb & Zaldarriaga 2004; Madau et al. 1997; Lewis & Challinor 2007). Among these three mechanisms, the foreground absorption of neutral hydrogen against the CMB dominates the 21cm background through the epoch of the Dark Ages down to redshift , while for the energy release of first luminous objects (stars and/or quasars) plays a leading role in generating the 21cm emission in excess of the CMB (e.g. Scott & Rees 1990; Barkana & Loeb 2004). During the transition phase or the ’Grey Ages’ between the end of the Dark Ages and the dawn of reionization at , a combined mechanism may come into effect in the redshifted 21cm background.
If we decompose the surface brightness temperature of 21cm background from the Dark Ages through the EOR into three components: emission from neutral hydrogen surrounding the ionized bubbles of first galaxies and/or quasars , emission inside minihalos , and absorption of IGM against the CMB , the 21cm power spectrum can be formally determined by three auto-correlation terms , and three cross-correlation terms . In particular, two of the cross-correlations relevant to the absorption have negative amplitudes as a result of , where is the spin temperature of neutral hydrogen. Although quite a lot of work has been done in recent literature on the theoretical estimate of the three auto-correlation terms (e.g. Iliev et al. 2002; Zaldarriaga, Furlanetto & Hernquist 2004; Loeb & Zaldarriaga 2004; Furlanetto, Zaldarriaga & Hernquist 2004a, b; Furlanetto, Oh & Briggs 2006; Santos et al. 2008; Lewis & Challinor 2007; Mao et al. 2008), it has remained unclear so far to what extent the three cross-correlations contribute to the total 21cm power spectrum, especially in the Grey Ages. The essentials of three cross-correlations arise from the fact that both collapsed and uncollapsed neutral hydrogen may trace underlying gravitational potentials of large-scale density perturbations, through which their 21cm emission/absorption signals are correlated at large-scales. Furlanetto, Oh & Briggs (2006) have actually included the cross-correlation between and in the study of the power spectrum of 21cm fluctuations, although their work focused mainly on the observational distinction between signatures of minihalos and those of IGM, in which massive halos (galaxies) are ignored. In the present study we will concentrate on the evaluation of each of the cross-correlations in terms of the 21cm angular power spectrum for different frequencies or redshifts.
Note, however, that two of the cross-correlations, and , should be safely treated as a mathematical elegance rather than a physically realistic situation through most of the period of the Dark Ages to the EOR. The latter requires the co-existence of 21cm emission from ’hot’ IGM around first galaxies and 21cm absorption from ’cold’ IGM, represented by , and the co-existence of 21cm emission from ’hot’ IGM around first galaxies and 21cm emission from ’hot’ IGM inside minihalos, represented by , within the same regions. Unless an inhomogeneous heating scenario is considered (Barkana & Loeb 2004; Pritchard & Furlanetto 2007; Santos et al. 2008; Mesinger 2009), the two correlation terms and may become physically meaningless except for the very rapid transition phase or the Grey Ages. In this regard, the last cross-correlation between the 21cm emission from minihalos and the 21cm absorption from the diffuse IGM, , is probably the only physically plausible term that is worth investigating during and even before the Grey Ages.
The main difficulty of evaluating accurately the cross-correlations at present within the framework of analytic description of the reionization process is perhaps the absence of a unification scheme in which the three mechanisms of generating cosmic 21cm signals can be incorporated and treated at any redshifts through the Dark Ages to the EOR. The emission scenario associated with first galaxies which has been extensively discussed in recent literature applies only to lower redshifts at , while the absorption model of uncollapsed IGM is restricted to higher redshifts beyond . During the Grey Ages when the effect of the cross-correlations between different mechanisms is expected to be visible in the cosmic 21cm power spectrum, our theoretical prediction relies on the extrapolation of the current emission and absorption models unless we make an attempt at exploring the unification scheme in which the distribution and evolution of both neutral hydrogen and its reionization can be correctly described through the entire period of the Dark Ages and the EOR including the transition phase. It is likely that numerical simulation (e.g. Zahn et al. 2007; Trac & Cen 2007; Iliev et al. 2008; Santos et al. 2008) should be eventually used so that various physical processes can be incorporated in the estimate of the cross-correlations in the cosmic 21cm power spectrum.
Having realized these difficulties and limitations, we still intend to take the three cross-correlations into account in the calculation of the cosmic 21cm power spectrum. By simple combining the existing analytic scenarios of generating the cosmic 21cm signals at the Dark Ages and the EOR, we address the question of what and how large observational effect one may expect to see if the three correlation terms are included. Our goal in the present paper is to call the attention of the 21cm cosmology community to the possible role of the cross-correlations in the 21cm power spectrum especially at the Grey Ages rather than the detailed modelling of the evolution of cosmic neutral hydrogen and reionization process. It is hoped that future numerical simulation can provide a more sophisticated treatment of the problem.
2 General Framework
We concentrate our attention on the following three mechanisms only: 21cm emission from the neutral hydrogen surrounding the Strömgren spheres of the first galaxies/quasars, 21cm emission from minihalos, and 21cm absorption against the CMB from the uncollapsed IGM. If we use the surface brightness temperature to denote the cosmic 21cm radiation, the total background can be written as
| (1) |
We usually work with the two-point correlation function or power spectrum in the Fourier space to extract the considerably faint 21cm signals in a statistical manner. This yields
| (2) |
or in terms of power spectrum
| (3) |
In what follows we utilize the angular power spectrum by specifying the observing frequency (or redshift) instead of the 3D power spectrum . Moreover, we adopt a small-angle approximation, which allows us to convert the 3D power spectrum of a perturbation field into the corresponding angular power spectrum in terms of the Limber’s equation. If the frequency response function of 21cm experiment is or centered on or , where is the comoving distance, then two-point angular power spectrum can be obtained by
| (4) |
In fact, in the calculation of both auto and cross angular power spectra of the 21cm background, many of the perturbations can be related to the underlying matter density fluctuations. Consequently, in most cases simply represents the power spectrum of dark matter, and other coefficients can be absorbed into the window function. For the window function, we will take a Gaussian form of
| (5) |
in which the resolution in is related to the observing frequency bandwidth through
| (6) |
We evaluate the power spectrum of density perturbation following the analytical halo approach to include non-linear structures (Seljak 2000; Cooray, Hu & Miralda-Escudé 2000). The non-linear dark matter power spectrum consists of a single halo term plus a clustering term :
| (7) | |||||
| (8) |
where is the Fourier transform of dark matter density profile of a halo at , and is the mean mass density of the background universe at . We adopt the functional form suggested by numerical simulations (Navarro, Frenk & White 1997) for and fix the concentration parameter in terms of the empirical fitting formula of Bullock et al. (2002). is the bias parameter, for which we use the analytic prescription of Mo & White (1996). The mass function of dark halos is assumed to follow the standard Press-Schechter function
| (9) |
in which is the linear theory variance of the mass density fluctuation in sphere of mass :
| (10) |
and is the Fourier representation of the window function. For a top-hat window function, we have . We use the present-day linear matter power spectrum given by Bardeen et al. (1986) and a power-law form () for the primordial matter density fluctuation. Moreover, we adopt the concordance cosmological model (CDM) with the following choice of cosmic parameters: , , , , and .
Since our attention is concentrated on the evaluation of the 21cm angular power spectrum of each of the cross-correlations rather than the detailed modelling of the underlying physical process of 21cm transition, we adopt the existing analytic algorithms developed in the recent literature to calculate the cosmic 21cm emission/absorption signal. In what follows we summarize very briefly each of the analytic or semi-analytic approaches in the computation of auto-correlation angular power spectrum and extend the work to the evaluation of the corresponding cross-correlations.
3 Power Spectra
3.1 Auto-correlation:
We follow essentially the prescription of Zaldarriaga et al.(2004) to estimate the 21cm emission angular power spectrum from neutral hydrogen surrounding the ionized bubbles of first galaxies. In their treatment, the reionization process is associated with the growth of HII regions around individual galaxies, manifested by a sphere of radius of . We use an analytic form of Mpc to account for the cosmic evolution of , which roughly matches the values adopted by Zaldarriaga et al. (2004) at different redshifts. The overall cosmic evolution of reionization is specified by the mean neutral hydrogen fraction, for which a simple analytic expression is assumed: , with a choice of and in our calculation. The brightness temperature in excess of is
| (11) | |||||
| (12) |
in which we have assumed that the spin temperature of neutral hydrogen is much higher than , and the peculiar motion of the IGM is neglected. The perturbation in arises from a combination of fluctuations in both the matter density and the neutral fraction , giving rise to the power spectrum
| (13) |
Namely, the power spectrum of comprises two auto-correlations and one cross-correlation between the two fields. An analytic model was used to construct and in Zaldarriaga et al. (2004) and a refined model was proposed in their subsequent work (Furlanetto et al. 2004a). The observed 21cm brightness temperature in the direction at frequency is thus
| (14) |
Applying the Limber’s equation, we can obtain the corresponding angular power spectrum by replacing with in Eq.(4).
3.2 Auto-correlation:
It is argued that collisional excitation of the neutral hydrogen inside minihalos may constitute a non-negligible fraction of the cosmic 21cm background, especially at the Grey Ages. Many investigations, based on both semi-analytical treatment and numerical simulations, have been made towards the modeling of the radiation process and the signatures of the resultant 21cm background (e.g. Carilli, Gnedin & Owen 2002; Iliev et al. 2002, 2003; Ciardi et al. 2006; Furlanetto, Oh & Briggs 2006; Shapiro et al. 2006) Minihalos are restricted by two mass thresholds: the Jeans mass that sets the low-mass limit on collapsed halos, and the upper limit beyond which the atomic cooling becomes efficient. In the CDM cosmological model, the two mass limits can be estimated by Shapiro et al. (2006)
| (15) | |||||
| (16) |
It is unlikely that present and even future radio telescopes/arrays will be able to resolve minihalos because of their small size and low surface brightness (Jy). We therefore deal with the total 21cm flux of each minihalo, and neglect the contribution of the Poisson term in the calculation of power spectrum. In order to simplify the procedure, also guided by the result of numerical simulations, we assume that the 21cm flux of a minihalo is proportional to its total mass . We then fit the simulated line-integrated flux versus minihalo mass of Iliev et al. (2002) to the following linear relation in the Log F-Log M space:
| (17) |
where the only free parameter , which characterizes the cosmic evolution of minihalos, is determined and extrapolated at each redshift in terms of Figure 1 of Iliev et al. (2002). Note that the cosmological parameters adopted in Iliev et al. (2002) are slightly different from ours. Here we have neglected the possible modification to the above relationship. The overall surface brightness temperature of all minihalos is given by
| (18) |
where is the Boltzmann constant, and is the comoving volume per unit redshift per unit solid angle. Note that we have converted the total flux into the surface brightness temperature in terms of the Rayleigh-Jeans approximation. The angular power spectrum of can be obtained using the Limber’s equation
| (19) |
where , and is the Hubble constant at .
3.3 Auto-correlation:
It was formulated long time ago that before the formation of first stars at , neutral hydrogen may absorb the CMB flux since the baryon temperature dropped faster than the CMB temperature in the framework of adiabatic cooling of baryon with evolution of the universe (Field 1959). The fluctuation of such a 21cm absorption field arises purely from the underlying matter density perturbation, . The 21cm absorption surface brightness temperature along the line-of-sight is
| (20) |
The corresponding angular power spectrum can be derived using the Limber’s equation
| (21) |
Finally we can use essentially the approach of Loeb & Zaldarriaga (2004) to calculate the brightness temperature variation with respect to , .
3.4 Cross-correlation:
Neutral hydrogen both surrounding the ionized bubbles of first galaxies/quasars and inside minihalos contributes to the cosmic 21cm emission. If galaxies/quasars (massive halos) and minihalos trace common gravitational potentials of underlying density perturbations at large scales, their 21cm emission signals should be strongly correlated, and the combined effect raises the amplitude of the total 21cm power spectrum. Yet, the above scenario is too simplistic because it is implicitly assumed that the minihalos may survive within HII regions for relatively long time. This may happen during the Grey Ages when the population of first luminous galaxies are rare and evaporation process is still inefficient. Another possibility is that minihalos were not yet swallowed by the expanding bubbles of first galaxies/quasars and both of them shared the same density perturbation field. The cross-correlation eventually vanishes with the evaporation process of minihalos. A combination of Eqs.(11), (12) and (18) yields
| (22) |
Replacing by and removing the global component, we can easily derive the 3D power spectrum
| (23) |
in which . Furthermore, the corresponding angular power spectrum under the small-angle approximation is
| (24) |
Note again, however, that the above expressions apply only to the regimes outsides the ionized bubbles surrounding the first galaxies. We use the characteristic radius in Sec.3.1 to denote this restriction, i.e. the cross-correlation turns to be zero on scales smaller than . In the calculation of the angular power spectrum, the power vanishes if .
3.5 Cross-correlation:
Before the EOR, most of IGM is still neutral, and the mean global fraction of ionized hydrogen at is well below unity. So, one may have an intuition that there should exist a strong correlation between the 21cm emission generated by neutral hydrogen surrounding the ionized bubbles of first galaxies/quasars and the 21cm absorption from the uncollapsed, diffuse neutral hydrogen. This arises because both the collapsed and uncollapsed baryons trace the common large-scale density perturbations of the universe. Yet, the co-existence of ’hot’ IGM around first galaxies and ’cold’ IGM within the same region vanishes rapidly with the formation of more first generation stars, unless the inhomogeneous nature of Ly and/or X-ray backgrounds are introduced (Barkana & Loeb 2004; Pritchard & Furlanetto 2007; Santos et al. 2008; Mesinger 2009). Recall that first galaxies formed in overdense regions, in which the heating of ambient diffuse IGM by energy release of the first stars proceeds more efficiently than that in underdense regions. In other words, the mean neutral fraction of the universe should not be used as a unique indicator of the significance of the cross correlation . Indeed, the signature of cross-correlation on the total 21cm cosmic angular power spectrum could only be detected during the transition phase. This arises because the population of the first stars even in the overdense regions are rare during this rapid transition process and most of the radiation energy is not yet delivered to the uncollapsed IGM in the same regions. Such a cross-correlation makes a negative contribution to, and may therefore suppress the total 21cm cosmic angular power spectrum. The cross-correlation can be represented by
| (25) |
The angular power spectrum weighted by window function and under small-angle approximation is
| (26) |
Note that the ionized bubbles surrounding the first galaxies are excised in the above computation to account for the null effect of 21cm absorption from neutral hydrogen.
3.6 Cross-correlation:
Unlike the above two cross-correlations which may manifest themselves only in the rapid transition phase, the 21cm emission of minihalos should naturally exhibit a correlation with the 21cm absorption of uncollapsed IGM through the entire period of the Dark Ages till the Grey Ages. The cross-correlation between these two components is
| (27) |
The fluctuation arises purely from the density perturbation , and therefore its power spectrum is simply
| (28) |
Finally, we can estimate the angular power spectrum modulated by window function through
| (29) |
One may argue that the fraction of neutral hydrogen in the above calculations may be overestimated because the contribution of minihalos to the total baryonic matter of the universe has not been excluded in the treatment of the uncollapsed IGM. To clarify the point, we have calculated the hydrogen mass inside minihalos at different redshifts and found that its contribution to the total fraction of global neutral hydrogen is negligibly small.
4 Results
We adopt a frequency resolution of MHz to conduct our numerical computations of the angular power spectra of three auto-correlations and three cross-correlations. The total 21cm angular power spectrum is then obtained by summing up the six components following Eq.(3). We demonstrate all the resultant angular power spectra in the conventional way, , which provides a direct measurement of rms fluctuation of the 21cm brightness temperature in the corresponding multipole range.
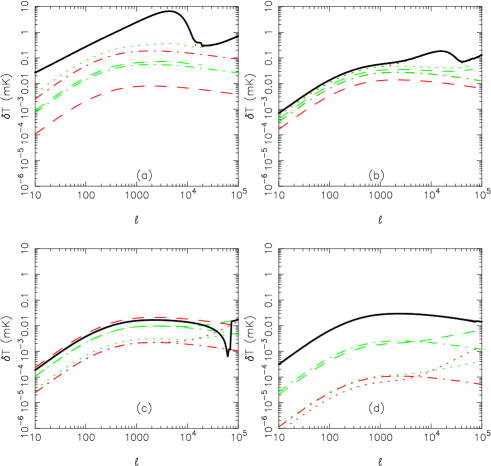
Figure 1 shows the angular power spectra of three auto-correlations (, and ) and three cross-correlations (, and ) calculated at four different redshifts, z=10, 15, 20 and 25. The results of the three auto-correlations are certainly not novel and have already been demonstrated in the literature (see, for examples, Iliev et al. 2002; Loeb & Zaldarriaga 2004; Zaldarriaga et al. 2004). As what is expected, the overall power spectrum for up to is governed by the auto-correlation term, at lower redshifts and at higher redshifts, respectively, and the transition occurs at . The auto-correlation of minihalos contributes only a small fraction to the total power spectrum. Nonetheless, the cross-correlation of minihalos with other two mechanisms constitutes the second largest components to the total power spectrum: at redshifts below and at redshifts beyond , though their absolute values are still small as compared with the contribution of corresponding auto-correlation ( at lower redshifts and at higher redshifts).
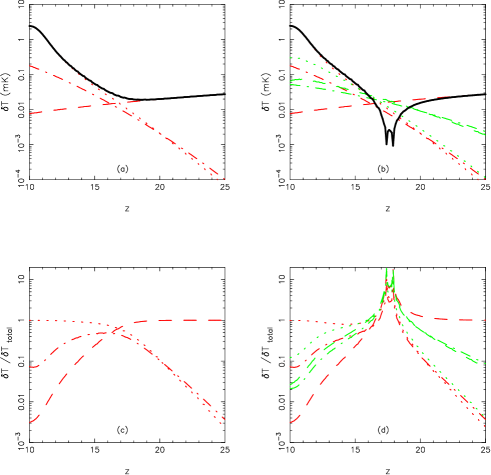
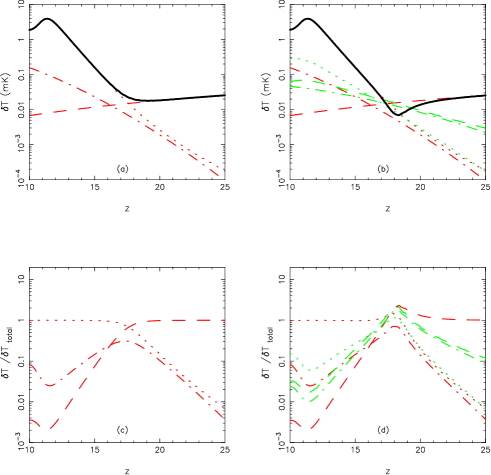
While the effect of cross-correlations on the overall 21cm angular power spectrum is insignificant, the cross-correlation may exceed the auto-correlation during the transition phase which occurs at a certain redshift between and in terms of the present models. To demonstrate the point clearly, we take the 21cm power spectrum of each component at two multipoles, and , and illustrate in Figure 2 and Figure 3 its time evolution as well as its fractions in the total power spectra. Note that under certain circumstances some fractions may be larger than unity because of the negative contribution of the two terms, and , to the total power, which is actually a good indicator of the significance of cross-correlations at the corresponding multipole range. For comparison, we have also displayed the results when only the auto-correlations are taken into account. It turns out that inclusion of the cross-correlations leads to a suppression of the angular power spectrum during the transition phase, and the extent and position of such a suppression varies with multipole . For the example of shown in Figure 2, there is a drop of up to an order of magnitude around with regard to the angular power spectrum without the inclusion of cross-correlations for the same .
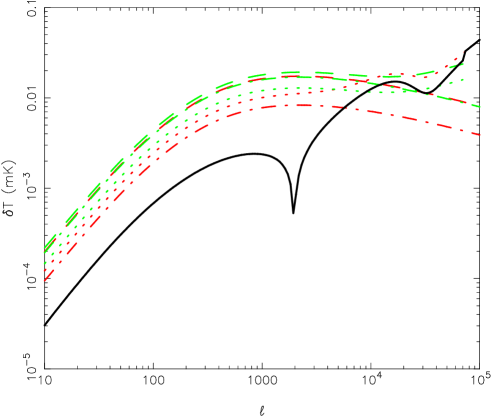
It is not difficult to understand the cause for the above power suppression during the transition phase. If we neglect the contribution of minihalos, the total power spectrum reduces to . Before and after the transition, is dominated by either or , depending on redshifts. During the transition phase, however, the two effects make more or less the same contribution to the total power spectrum, or the auto-correlation is roughly the same as the cross-correlation in amplitude, hence reducing greatly the power. In other words, the two components almost cancel each other because the cross-correlation has a negative sign. We illustrate the point in Figure 4 by plotting the angular power spectrum at redshift , the transition phase in terms of our present models. It appears that a combination of the auto- and cross-correlations yields a much lower angular power spectrum.
5 Discussion and Conclusions
Using a simple analytic prescription of both 21cm emission and absorption of neutral hydrogen in the epoch of the Grey Ages, we have calculated the cross-correlation between three major mechanisms of cosmic 21 cm radiation, namely, the emission from neutral hydrogen surrounding the ionized bubbles of first galaxies, the emission of neutral hydrogen inside minihalos, and the absorption of diffuse neutral hydrogen against the CMB radiation. It has been shown that inclusion of the three cross correlations does not alter the overall angular power spectrum of cosmic 21cm background. However, during the transition of 21cm radiation field from emission-dominated phase to absorption-dominated phase, the cross-correlation may play a key role in the determination of the shape and magnitude of the 21cm power spectrum. This arises primarily from the negative contribution of cross-correlation between the absorption of diffuse IGM and the other two emission mechanisms, which leads to a significant power suppression on the fluctuation of 21cm radiation field during the transition phase. In our naive models for the above three mechanisms, especially the oversimplified scenario for the 21cm emission from the IGM associated with first galaxies, the transition occurs around redshift , which varies slightly with multipole .
The effect of cross-correlations on the 21cm angular power spectrum could be detected as a remarkable drop of power at a certain frequency range corresponding to the transition phase. The precise value of the transition frequency depends on the combined effects of various mechanisms of 21cm radiation in the epoch of the Grey Ages. An extension of the present work to the adoption of more sophisticated models for the 21cm radiation field at the Grey Ages may provide a more accurate prediction of the 21cm angular power spectrum.
Finally, we must caution that the effect of the cross-correlations on the total cosmic 21cm power spectrum could be considerably exaggerated as a result of our ’toy model’, and some of our numerical results may even be artificial because of the ’artificial’ split between the three major mechanisms of 21cm radiation. Numerical simulation should be applied to clarify the issue.
Acknowledgments
We gratefully acknowledge an anonymous referee for valuable comments. This work was supported by the Ministry of Science and Technology of China, under Grant No. 2009CB824900.
References
- Barkana & Loeb (2004) Barkana, R., & Loeb, A. 2004, ApJ, 601, 64
- Bardeen et al. (1986) Bardeen, J. M., Bond, J. R., Kaiser, N., & Szalay, A. S. 1986, ApJ, 340, 15
- Bullock et al. (2002) Bullock, J. S., Wechsler, R. H., & Somerville, R. S. 2002, MNRAS, 329, 46
- Cooray, Hu & Miralda-Escudé (2000) Cooray, A., Hu, W., & Miralda-Escude, J. 2000, ApJ, 535,9
- Carilli, Gnedin & Owen (2002) Carilli, C. L., Gnedin, N. Y., & Owen, F. 2002, ApJ, 577, 22
- Ciardi et al. (2006) Ciardi B., Scannapieco E., Stoehr F., Ferrara A., Iliev I. T., & Shapiro P. R. 2006, MNRAS, 366, 689
- Field (1959) Field, G. B. 1959, ApJ, 129, 536
- Furlanetto & Oh (2006) Furlanetto, S. R., & Peng Oh, S. 2006, ApJ, 652, 849
- Furlanetto, Zaldarriaga & Hernquist (2004a) Furlanetto, S. R., Zaldarriaga, M., & Hernquist, L. 2004a, ApJ, 613, 1
- Furlanetto, Zaldarriaga & Hernquist (2004b) Furlanetto, S. R., Zaldarriaga, M., & Hernquist, L. 2004b, ApJ, 613, 16
- Furlanetto, Oh & Briggs (2006) Furlanetto, S. R., Peng Oh, S., & Briggs, F. H. 2006, Phys.Rept, 433, 181
- Iliev et al. (2002) Iliev, I. T., Shapiro, P. R., Ferrara, A., & Martel, H. 2002, ApJ, 572, 123
- Iliev et al. (2003) Iliev, I. T., Scannapieco, E., Martel, H., & Shapiro, P. R. 2003, MNRAS, 341, 81
- Iliev et al. (2008) Iliev, I. T., Mellema, G., Pen, U.-L., Bond, J. R., & Shapiro, P. R. 2008, MNRAS, 384, 863
- Lewis & Challinor (2007) Lewis, A., & Challinor, A. 2007, Phy. Rev. D., 76, 083005
- Loeb & Zaldarriaga (2004) Loeb, A., & Zaldarriaga, M. 2004, Phy.Rev.Lett. 92, 211301
- Madau, Meiksin & Rees (1997) Madau, P., Meiksin, A., & Rees, M. J. 1997, ApJ, 475, 429
- Mao et al. (2008) Mao, Y., Tegmark, M., McQuinn, M., Zaldarriaga, M., Zahn, O. 2008, Phy. Rev. D., 78, 023529
- Mesinger (2009) Mesinger, A., 2009, arXiv:0910.4161v1
- Mo & White (1996) Mo, H. J., & White, S. D. M. 1996, MNRAS, 282, 347
- Morales & Wyithe (2009) Morales, M. F., & Wyithe, J. S. 2009, ARAA, in press
- Navarro, Frenk & White (1997) Navarro, J. F., Frenk, D. S., & White, S. D. M. 1997, ApJ, 490, 493
- Pritchard & Furlanetto (2007) Pritchard, J. R., & Furlanetto, S. R. 2007, MNRAS, 376, 1680
- Santos et al. (2008) Santos, M. G., Amblard, A., Pritchard, J., Trac, H., Cen, R., Cooray, A. 2008, ApJ, 689, 1
- Scott & Rees (1990) Scott, D., & Rees, M. J. 1990, MNRAS, 247, 510
- Seljak (2000) Seljak, U. 2000, MNRAS, 318, 203
- Shapiro et al. (2006) Shapiro, P. R., Ahn, K., Alvarez, M. A., Iliev, I. T., Martel, H., & Ryu, D. 2006, ApJ, 646, 681
- Trac & Cen (2007) Trac, H., & Cen, R. 2007, ApJ, 671, 1
- Wouthuysen (1952) Wouthuysen, S. A. 1952, AJ, 57, 31
- Zahn et al. (2007) Zahn, O., Lidz, A., McQuinn, M., Dutta, S., & Hernquist, L. 2007, ApJ, 654, 12
- Zaldarriaga, Furlanetto & Hernquist (2004) Zaldarriaga, M., Furlanetto, S. R., & Hernquist, L. 2004, ApJ, 608, 622