Strömgren Photometry of the Delta Scuti Stars 7 Aql and 8 Aql
Abstract
The preliminary results of new photometric observations of the Scuti stars 7 Aql and 8 Aql are reported. 51 hr of photoelectric photometric data were obtained over the period June and July 2007 at the San Pedro Mártir Observatory, Mexico. Period analyses confirm the three pulsation modes discovered in 8 Aql in the framework of the STEPHI 2003 multisite campaign. For the star 7 Aql we were able to detect only the main pulsation modes. The standard magnitudes of both stars are obtained. The frequency, amplitude and phases of the frequency modes in different filters are presented.
Keywords:
oscillations, Sct, photometry:
97.10.Sj1 Introduction
7 Aql (HD 174532, SAO 142696, HIP 92501) is a Scuti variable discovered in a systematic search and characterization of new variables in preparation for the COROT mission [1] and was selected as the main target of the STEPHI XII multisite campaign in 2003. In this campaign 8 Aql (HD 174589, SAO 142706, HIP 92524) was used as the only comparison star because there are no other bright stars in the field-of-view (FOV) of the 4-channel photometer used in the STEPHI network.
Although no check comparison star was implemented in that campaign, by carefully analyzing the derived light curves, differential and non-differential, it was demonstrated that 8 Aql is a new Scuti variable. Moreover, it was shown that the amplitude spectrum of both stars are not superposed. Three and seven frequency peaks were unambiguously detected with a 99 % confidence level in 8 Aql and 7 Aql respectively and a possible identification of the observed modes in terms of radial order was performed [2]. CCD photometric observations of 7 Aql and 8 Aql were reported in [3].
In the present paper, preliminary result of new photoelectric photometric observations of 7 Aql and 8 Aql are reported.
2 Observations and data reduction
The observations were carried out on the nights of June 21, 22, 23, 28, 30 and July 07 and 08 at the Observatorio Astrónomico Nacional-San Pedro Mártir (OAN-SPM), Baja California, Mexico. The 1.5-m telescope with the six-channel Strömgren spectrophotometer was implemented. The observing routine consisted of five 10 s of integration of the star from which five 10 s of integration of the sky was subtracted. Two comparison constant stars were observed as well. The stars were observed for about 51 hr during the whole campaign (see Table 1).
| Star | RA | Dec | V | Sp.T. | |
|---|---|---|---|---|---|
| (2000.0) | (2000.0) | (mag) | |||
| c1 | HD 174046 | 18 48 44 | -03 54 01.2 | 9.6 | |
| c2 | HD 174625 | 18 51 27 | -02 42 05.7 | 9.5 |
A set of standard stars was also observed each night to transform instrumental observations onto the standard system and to correct for atmospheric extinction. The instrumental magnitudes (inst) and colours, once corrected from atmospheric extinction, were transformed to the standard system (std) through the equations given by [4].
The averaged standard magnitudes and indices for 7 Aql and 8 Aql are listed in Table 2. A total amount of 291 data points were obtained for the former star, while 288 for the latter. In the case of 24 measurements were performed for both stars. The reddening free indices are defined as: and [4]. Applying the above equations to the standard stars, an estimation of the uncertainties of each individual observation was obtained: , , , , . The photometric precision in the instrumental system was: , , .
Figure 1 shows examples of the differential light curves in filter of 7 Aql and 8 Aql for three selected nights.
| Star | |||||||
|---|---|---|---|---|---|---|---|
| (mag) | (mag) | (mag) | (mag) | (mag) | (mag) | (mag) | |
| 7 Aql | 6.894 | 0.171 | 0.180 | 0.873 | 2.755 | 0.211 | 0.839 |
| 8 Aql | 6.075 | 0.178 | 0.185 | 0.822 | 2.730 | 0.212 | 0.786 |

3 Spectral analysis
The period analysis has been performed by means of standard Fourier analysis and least-squares fitting. In particular, the amplitude spectra of the differential time series were obtained by means of an iterative sinus wave fit (ISWF) [5].
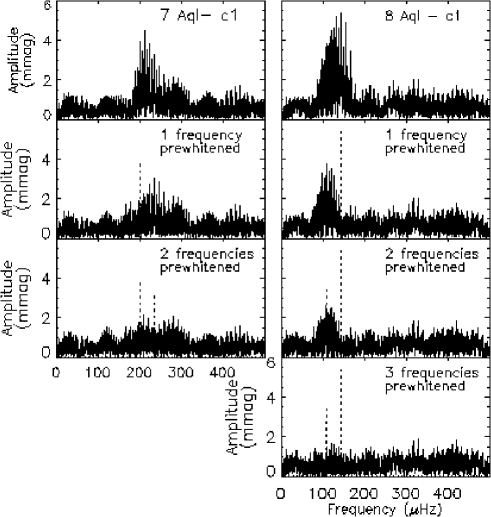
The amplitude spectra of the differential light curves 7 Aqlc1, 8 Aqlc1 are shown in the top panels of each plot of Figure 2. The subsequent panels of each plot in the figure, from top to bottom, illustrate the process of detection of the frequency peaks in each amplitude spectrum. We followed the same procedure as explained in [6].
The frequencies, amplitudes and phases in the filters are listed in Table 3. The three frequency peaks detected in the Scuti star 8 Aql in STEPHI 2003 campaign [2] have been confirmed in this season. On the other hand, only two dominant modes of 7 Aql have been detected. This is due to the fact that observations from a single site yields a worse windows function. A non-adiabatic analysis for 7 Aql and 8 Aql using the amplitudes and phases listed in Table 3 will be given in a forthcoming paper [8].
| Freq. | A | ||
| (Hz) | (mmag) | (rad) | |
| Filter | |||
| 5.1 | |||
| 3.6 | |||
| Filter | |||
| 5.5 | |||
| 3.3 | |||
| Filter | |||
| 4.7 | |||
| 3.8 | |||
| Filter | |||
| 9.0 | |||
| 5.9 | |||
| 4.8 | |||
| Filter | |||
| 9.2 | |||
| 4.5 | |||
| 5.2 | |||
| Filter | |||
| 9.6 | |||
| 4.8 | |||
| 5.8 |
References
- (1) E. Poretti, et al., 2003, A&A, 406, 203.
- (2) L. Fox Machado, et al., 2007, AJ, 134, 860.
- (3) L. Fox Machado, et al., 2008, CoAst, 153, 20.
- (4) B. Strömgren, 1966, ARA&A, 4, 433.
- (5) T. Ponman, 1981, MNRAS, 196, 543.
- (6) L. Fox Machado, et al., 2002, A&A, 382, 556.
- (7) M. Breger, et al., 2002, A&A, 349, 225
- (8) L. Fox Machado, et al., 2009, New Astronomy, submitted.