MACSJ1423.8+2404: Gravitational Lensing by a Massive, Relaxed Cluster of Galaxies at z=0.54
Abstract
We present results of a gravitational-lensing and optical study of MACS J1423.8+2404 (, MACS J1423), the most relaxed cluster in the high-redshift subsample of clusters discovered in the MAssive Cluster Survey (MACS). Our analysis uses high-resolution images taken with the Hubble Space Telescope in the F555W and F814W passbands, ground based imaging in eight optical and near-infrared filters obtained with Subaru and CFHT, as well as extensive spectroscopic data gathered with the Keck telescopes. At optical wavelengths the cluster exhibits no sign of substructure and is dominated by a cD galaxy that is 2.1 magnitudes (K-band) brighter than the second brightest cluster member, suggesting that MACS J1423 is close to be fully virialized. Analysis of the redshift distribution of 140 cluster members reveals a Gaussian distribution, mildly disturbed by the presence of a loose galaxy group that may be falling into the cluster along the line of sight. Combining strong-lensing constraints from two spectroscopically confirmed multiple-image systems near the cluster core with a weak-lensing measurement of the gravitational shear on larger scales, we derive a parametric mass model for the mass distribution. All constraints can be satisfied by a uni-modal mass distribution centred on the cD galaxy and exhibiting very little substructure. The derived projected mass of M☉ is about 30% higher than the one derived from X-ray analyses assuming spherical symmetry, suggesting a slightly prolate mass distribution consistent with the optical indication of residual line-of-sight structure. The similarity in shape and excellent alignment of the centroids of the total mass, K-band light, and intra-cluster gas distributions add to the picture of a highly evolved system. The existence of a massive cluster like MACS J1423, nearly fully virialized only 7 Gyr after the Big Bang, may have important implications for models of structure formation and evolution on cosmological time scales.
keywords:
Gravitational lensing: strong lensing – Galaxies: clusters: individual (MACS J1423.8+2404)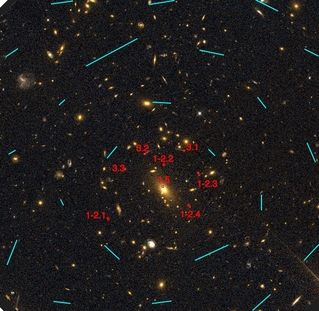
1 Introduction
The MAssive Cluster Survey (MACS, Ebeling et al., 2001) has compiled a complete sample of 12 very X-ray luminous galaxy clusters at (Ebeling et al., 2007), providing a unique opportunity for comprehensive studies of the densest regions of the cosmic web at intermediate redshifts. As noted by Kartaltepe et al. (2008), MACS J1423 stands out among these 12 extreme systems as the most dynamically relaxed; it is, indeed, the most massive cool-core cluster known at these redshifts. The system has been used in several statistical studies (LaRoque et al., 2003; Puetzfeld et al., 2005; Bonamente et al., 2006; Kotov & Vikhlinin, 2006) where its relaxed dynamical state has been particularly important for cosmological work using the baryon fraction (Allen et al., 2004; Schmidt & Allen, 2007; Allen et al., 2008; Ettori et al., 2009). Since the abundance of massive relaxed clusters at high redshift has important implications for theoretical and numerical models of structure formation and evolution, we here attempt to further test the system’s relaxation state using gravitational lensing. All our results use the CDM concordance cosmology with , and a Hubble constant H km s-1 Mpc-1. Magnitudes are quoted in the AB system.
2 Observations
2.1 Imaging
Ground based panoramic imaging of MACS J1423 was performed in the B, V, Rc, Ic, and bands with the SuprimeCam camera on the Subaru telescope, and in the u∗ and K bands with MEGACAM and WIRCAM on CFHT. The resulting object catalogues were used to compute photometric redshifts for all galaxies in a deg2 field following the methodology described in Ma et al. (2008). Cluster members were defined to be galaxies with photometric or spectroscopic redshifts (see below) within 0.05 of the cluster redshift.
MACS J1423 was observed on 2004, June 16 with the Advanced Camera for Surveys (ACS) on-board HST for 4.5 ks and 4.6 ks through the F555W and F814W filters, respectively (GO: 9722, PI: Ebeling). The data were reduced using an automated pipeline developed by the HAGGLeS team (Marshall et al., in prep.), that uses multidrizzle version 2.7.0. Following manual masking of satellite trails, cosmic ray clusters, and scattered light in the flat-fielded frames, all exposures were carefully registered onto a common 0.03 pixel grid (Schrabback et al., 2007), generating the shift files needed by multidrizzle. The individual frames in each filter were then drizzled together using a square kernel with pixfrac 0.8, applying updated bad pixel masks and optimal weights (Schrabback et al., 2009).
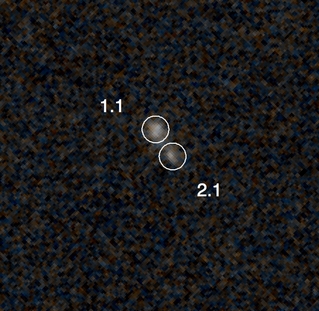
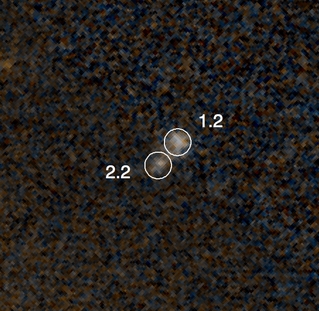
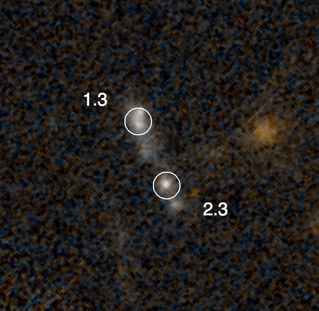
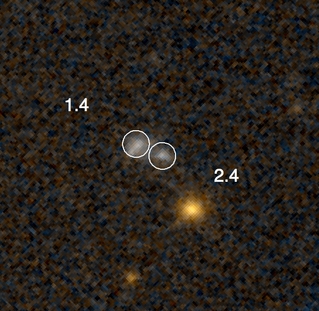
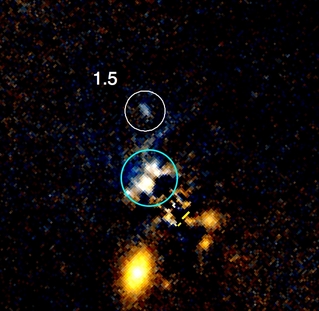
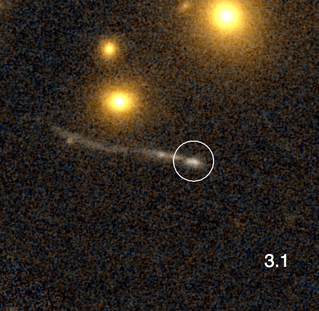
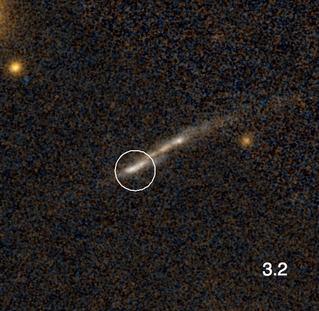
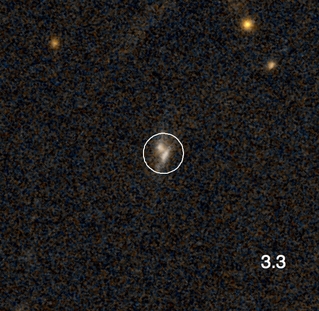
In spite of the lensing efficiency decreasing with increasing cluster redshift, MACS J1423 exhibits clear strong-lensing features. Visual inspection of the ACS frames immediately reveals two multiple-image systems (Fig. 1). The observed configuration of lensing features for the first of these can be explained by a single background galaxy, resolved into two components, each of which represents a multiple-image system (referred to as 1-2 in the following) in a typical Einstein-cross configuration. The mass model predicts a central fifth image which is detected at the predicted position under the cD galaxy whose light has been subtracted using the IRAF routine ellipse. The other multiply imaged system, #3, constitutes a typical naked-cusp configuration, with three images on the same side of the cluster.
2.2 Arc spectroscopy
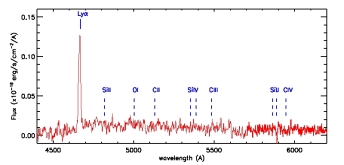
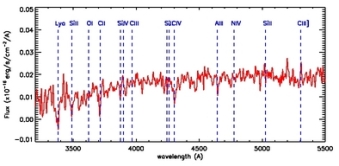
Spectroscopic observations of all lensing features were performed on March 6, 2005 using the Low Resolution Imager and Spectrograph (LRIS, Oke et al., 1995) of the Keck I telescope in multi-object spectroscopy mode. We used the 400/3400 grism, D560 dichroic, and 400/8500 grating centred at 6800Å to achieve continuous wavelength coverage from 3200 to 8000Å. The reduction of the data obtained in a total integration time of 10.8 ks followed the standard steps of bias subtraction, slit identification and extraction, flat fielding, wavelength calibration, and flux calibration, and was performed using the python routines described by Kelson et al. (2002). From the spectra thus obtained we measured redshifts of for the images labelled 1-2.1, 1-2.2 and 1-2.3; the redshift of features 3.1 and 3.2 was found to be . The spectra for each component show identical features (Lyman in emission for system 1-2, UV absorption lines in system 3), therefore they have been co-added on Fig. 2.
2.3 Galaxy spectroscopy
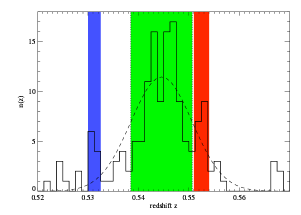
Using the LRIS and DEIMOS spectrographs on the twin Keck-10m telescopes on Mauna Kea we conducted an extensive spectroscopic survey of galaxies in the field of MACS J1423. Redshifts were measured for 396 objects, 60 of them within the solid angle covered by our HST/ACS observation. All redshifts were used to calibrate the photometric redshifts mentioned above. Using iterative clipping we find and km s-1 for the cluster redshift and velocity dispersion, respectively (, Fig. 3). When limited to the ACS field of view, the same analysis yields and km s-1 (). Even for a system as X-ray luminous as MACS J1423 ( erg s-1, Ebeling et al., 2007), this velocity dispersion falls high on the - relation (e.g. Mahdavi & Geller, 2001), without, however, constituting a significant outlier.
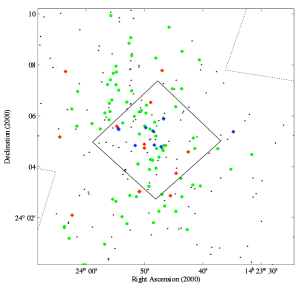
Inspection of the galaxy velocity histogram (Fig. 3, top) shows the distribution to be mildly skewed toward lower redshifts; a one-sided Kolmogorov-Smirnov test finds it to be inconsistent with a Gaussian at the 2 confidence level. We investigate whether the two peaks at and represent subclusters along the line of sight by selecting three galaxy subsamples as indicated by the coloured bands. The distribution of the respective galaxies on the sky is shown in Fig. 3 (bottom). Unlike the galaxies with , we find the galaxies in the peak around to be significantly (3.3) more concentrated in projection on the sky than the overall cluster galaxy population, suggesting a gravitationally bound substructure viewed almost exactly along the line of sight. We thus conclude that the velocity dispersion of MACS J1423 is mildly inflated by a possible infall of a loose group at , viewed in projection and superimposed directly onto the cluster core.
3 Distribution of Light & Mass
3.1 Light Distribution
We use the K-band magnitudes of (photometric) cluster members to create a luminosity-density map of the cluster light. By fitting a 2D Sersic profile to the cD galaxy which dominates the K-band cluster light (we use the galfit software of Peng et al. (2002)), we measure an integrated magnitude of K=16.27 for the cD, compared to K=18.33 for the second brightest cluster member. The magnitude difference is K.
3.2 Lensing Analysis
In addition to the two spectroscopically confirmed strong-lensing features discussed above, we also take into account the weak-lensing signal as reflected in the sheared F814W images of the background galaxy population. Details of the weak-lensing analysis will be presented in a forthcoming publication (Jauzac et al., in prep.). In short, we follow the weak lensing pipeline developped by Leauthaud et al. (2007, 2010), but adapted the code to work on cluster field, in order to efficiently remove the galaxy cluster members and the foreground galaxies that would otherwise reduce the strength of the shear signal. In doing so, we consider only background sources located outside the Einstein radius of, for MACS J1423, (here we refer to the effective Einstein for a source at , defined as the angular radius from the centre of the cluster at which the average convergence equals 1), thereby minimising any systematic bias from the strong-shear regime (Massey & Goldberg, 2008). The 192 galaxies thus selected within the ACS field (corresponding to a number density of 16 galaxies per square arcminute) represent 192 constraints in the weak-lensing analysis. Adding the 18 constraints from the two strongly lensed multiple-image systems yields a total of 210 constraints, all of which are used in order to build a parametric mass distribution within the framework of the publicly available lenstool software (Jullo et al., 2007, http://www.oamp.fr/cosmology/lenstool/) in which we have implemented the inclusion of the weak lensing constraints. The optimisation is performed in the image plane.
To characterise the mass distribution in MACS J1423 we adopt a dual Pseudo Isothermal Elliptical Mass Distribution (dPIE, Limousin et al., 2005; Elíasdóttir et al., 2007), parametrised by a fiducial velocity dispersion , a core radius and a scale radius (set to 1 000). In addition to this large-scale mass component, which models both the intracluster gas and the far larger dark matter component (Bradač et al., 2008; Sommer-Larsen & Limousin, 2009), we also take into account the perturbations associated with individual cluster galaxies. Specifically, we include in the modelling all cluster members brighter than 22.5 (F814) and within a projected cluster-centric distance of 35 from the cD galaxy. Empirical scaling relations (without any scatter) are used to relate their dynamical dPIE parameters (central velocity dispersion and scale radius) to their luminosity (the core radius being set to 0), whereas all geometrical parameters (centre, ellipticity, position angle) are set to the values measured from the light distribution (see, e.g. Limousin et al., 2007b; Richard et al., 2009a). In total our mass model is thus described by eight free parameters. The range of allowed parameter values characterising the dPIE mass component is limited by priors as follows. Position: along the X and Y directions; ellipticity: (expressed in units , where and refers to the semi-major and semi-minor axes of the ellipse describing the mass distribution); position angle: 0–180 degrees; velocity dispersion: 500–1500 km; core radius: 1–20. For the galaxy-scale component, we allow the velocity dispersion to vary between 100 and 250 km s-1, whereas the scale radius was forced to be less than 70 kpc in order to account for tidal stripping of their dark matter haloes (see, e.g. Limousin et al., 2007a, 2009; Natarajan et al., 2009; Wetzel & White, 2009, and references therein.)
3.3 A Uni-modal Mass Distribution
| Component | (kpc) | (km s-1) | ||||
|---|---|---|---|---|---|---|
| Cluster Halo | -1.01.2 | 0.01.0 | 0.40.1 | 116.01.7 | 78.725.2 | 1081110 |
| Perturbers | - | - | - | - | 32 | 141 |
The shear field constructed from our analysis of the images of the weakly lensed background galaxy population (Fig. 1) already suggests a uni-modal mass distribution centred on the cD galaxy. Combining strong- and weak-lensing constraints, we confirm that a single cluster-scale mass component is able to reproduce the full set of observational constraints, with a reduced value of 175/202. The corresponding best-fit values of all model parameters are summarised in Table 1. We find the centre of the elliptical dPIE mass distribution to coincide with that of the cD galaxy; its position angle of 1162 degrees matches the orientation of the cD galaxy (12610 degrees). No additional large-scale mass component is required by the data.
Fig. 4 compares the 2D mass map corresponding to the best-fit lens model to the X-ray surface brightness as observed with Chandra (from Ebeling et al. (2007)) and to the K-band light map, both adaptively smoothed to 3 significance using asmooth (Ebeling et al., 2006). The agreement between these independent observational tracers of the three cluster constituents (dark matter, gas, and galaxies) is remarkable.

4 Discussion & Conclusions
Using optical and lensing observations of MACS J1423 we find overwhelming evidence for a uni-modal mass distribution whose centre, ellipticity, and orientation are in excellent agreement with the corresponding parameters of the cluster light and intra-cluster gas distributions (Fig. 4). We quantify the dominance of a single, central mass component by computing the substructure fraction, , defined as the mass within a given cluster-centric radius that can be attributed to substructure, divided by the total mass within the same radius (Smith & Taylor, 2008). In the case of MACS J1423, only cluster galaxies (the cD galaxy is by definition excluded) contribute to the substructure fraction. We find 0.025, comparable to values measured for the most relaxed clusters at (Richard et al., 2009b). Within the high-redshift MACS subsample, the substructure fraction of 0.025 of MACS J1423 is in stark contrast to the value of 0.250.12 measured for MACS J1149.5+2223, the most complex cluster lens studied to date (Smith et al., 2009).
The radial mass profile of MACS J1423 as derived from our lensing analysis is well constrained across the full ACS field of view, i.e., out to a radius of 100″(640 kpc). Previous results for the mass within 65″(415 kpc) of 5.0 M☉, (LaRoque et al., 2003)111LaRoque et al. (2003) quote the mass within a three-dimensional radius, which we convert to a projected mass assumed a -model with . using observations of the Sunyaev-Zel‘dovich effect, and of 3.1 M☉ (3 confidence level, Schmidt & Allen, 2007) from an analysis of the Chandra X-ray data, agree within the errors with our measurement of M☉ (3). We note, however, that the existing X-ray analyses of MACS J1423 assume spherical symmetry which will bias the resulting mass estimates low for a prolate matter distribution. The difference of 30% between the lensing and X-ray mass may thus be due to an elongation of the system along the line of sight, consistent with our finding of residual accretion onto the cluster core (Section 2.3).
Richard et al. (2009b) investigated the relationship between the effective Einstein radius and the strong lensing mass (measured within 250 kpc) for a sample of 20 strong lensing clusters at drawn from the Local Cluster Substructure Survey (LoCuSS). According to their statistical analysis, one would expect a mass of 2.55 1014 M☉ for an undisturbed cluster with an Einstein radius of 21. The excellent agreement with our measurement of 2.460.2 1014 M☉ underlines again the relaxed dynamical state of MACS J1423.
Although our analysis of the radial velocity distribution of cluster members suggests that MACS J1423 evolved through mergers along a line-of-sight filament (Section 2.3), the rate of current or recent infall is low and does not result in a noticeable perturbation of the cluster core. In fact, the large luminosity gap of K mag between the cD and the second brightest cluster galaxy, as well as the excellent match of the dark-matter, intra-cluster gas, and cluster light distributions, represent strong evidence for a dynamically highly evolved cluster core (Jones et al., 2003; Milosavljević et al., 2006), undisturbed by major mergers for at least 1 Gyr, the characteristic time scale for relaxation via dynamical friction. The existence of MACS J1423 only 7 Gyr after the Big Bang thus adds an important observational constraint to N-body simulations of structure formation and evolution in the current cosmological model.
Acknowledgements
ML thanks the Centre National d’Etudes Spatiales (CNES) and CNRS for their support. ML est bénéficiaire d’une bourse d’acceuil de la Ville de Marseille. The Dark Cosmology Centre is funded by the Danish National National Research Foundation. HE gratefully acknowledges financial support from STScI grant GO-09722 and SAO grant GO3-4164X. AMS gratefully acknowledges a Royal Astronomical Society Sir Norman Lockyer Fellowship. GPS acknowledges support from the Royal Society and STFC. ACE and IRS acknowledge support from STFC. JR acknowledges support from an EU Marie-Curie fellowship. JPK acknowledges support from CNRS. TS acknowledges support from the Netherlands Organization for Scientific Research (NWO).
References
- Allen et al. (2008) Allen S. W., Rapetti D. A., Schmidt R. W., Ebeling H., Morris R. G., Fabian A. C., 2008, MNRAS, 383, 879
- Allen et al. (2004) Allen S. W., Schmidt R. W., Ebeling H., Fabian A. C., van Speybroeck L., 2004, MNRAS, 353, 457
- Bonamente et al. (2006) Bonamente M., Joy M. K., LaRoque S. J., Carlstrom J. E., Reese E. D., Dawson K. S., 2006, ApJ, 647, 25
- Bradač et al. (2008) Bradač M., Schrabback T., Erben T., McCourt M., Million E., Mantz A., Allen S., Blandford R., Halkola A., Hildebrandt H., Lombardi M., Marshall P., Schneider P., Treu T., Kneib J.-P., 2008, ApJ, 681, 187
- Ebeling et al. (2007) Ebeling H., Barrett E., Donovan D., Ma C.-J., Edge A. C., van Speybroeck L., 2007, ApJ, 661, L33
- Ebeling et al. (2001) Ebeling H., Edge A. C., Henry J. P., 2001, ApJ, 553, 668
- Ebeling et al. (2006) Ebeling H., White D. A., Rangarajan F. V. N., 2006, MNRAS, 368, 65
- Elíasdóttir et al. (2007) Elíasdóttir Á., Limousin M., Richard J., Hjorth J., Kneib J.-P., Natarajan P., Pedersen K., Jullo E., Paraficz D., 2007, ArXiv e-prints, 710
- Ettori et al. (2009) Ettori S., Morandi A., Tozzi P., Balestra I., Borgani S., Rosati P., Lovisari L., Terenziani F., 2009, ArXiv e-prints
- Jones et al. (2003) Jones L. R., Ponman T. J., Horton A., Babul A., Ebeling H., Burke D. J., 2003, MNRAS, 343, 627
- Jullo et al. (2007) Jullo E., Kneib J.-P., Limousin M., Elíasdóttir Á., Marshall P. J., Verdugo T., 2007, New Journal of Physics, 9, 447
- Kartaltepe et al. (2008) Kartaltepe J. S., Ebeling H., Ma C. J., Donovan D., 2008, MNRAS, 389, 1240
- Kelson et al. (2002) Kelson D. D., Zabludoff A. I., Williams K. A., Trager S. C., Mulchaey J. S., Bolte M., 2002, ApJ, 576, 720
- Kotov & Vikhlinin (2006) Kotov O., Vikhlinin A., 2006, ApJ, 641, 752
- LaRoque et al. (2003) LaRoque S. J., Joy M., Carlstrom J. E., Ebeling H., Bonamente M., Dawson K. S., Edge A., Holzapfel W. L., Miller A. D., Nagai D., Patel S. K., Reese E. D., 2003, ApJ, 583, 559
- Leauthaud et al. (2010) Leauthaud A., Finoguenov A., Kneib J., Taylor J. E., Massey R., Rhodes J., Ilbert O., Bundy K., Tinker J., George M. R., Capak P., Koekemoer A. M., Johnston D. E., Zhang Y., Cappelluti N., Ellis R. S., Elvis M., Giodini S., Heymans C., Le Fèvre O., Lilly S., McCracken H. J., Mellier Y., Réfrégier A., Salvato M., Scoville N., Smoot G., Tanaka M., Van Waerbeke L., Wolk M., 2010, ApJ, 709, 97
- Leauthaud et al. (2007) Leauthaud A., Massey R., Kneib J., Rhodes J., Johnston D. E., Capak P., Heymans C., Ellis R. S., Koekemoer A. M., Le Fèvre O., Mellier Y., Réfrégier A., Robin A. C., Scoville N., Tasca L., Taylor J. E., Van Waerbeke L., 2007, ApJS, 172, 219
- Limousin et al. (2007a) Limousin M., Kneib J. P., Bardeau S., Natarajan P., Czoske O., Smail I., Ebeling H., Smith G. P., 2007a, A&A, 461, 881
- Limousin et al. (2005) Limousin M., Kneib J.-P., Natarajan P., 2005, MNRAS, 356, 309
- Limousin et al. (2007b) Limousin M., Richard J., Jullo E., Kneib J. P., Fort B., Soucail G., Elíasdóttir A., Natarajan P., Ellis R. S., Smail I., Czoske O., Smith G. P., Hudelot P., Bardeau S., Ebeling H., Egami E., Knudsen K. K., 2007b, ApJ, 668, 643
- Limousin et al. (2009) Limousin M., Sommer-Larsen J., Natarajan P., Milvang-Jensen B., 2009, ApJ, 696, 1771
- Ma et al. (2008) Ma C.-J., Ebeling H., Donovan D., Barrett E., 2008, ApJ, 684, 160
- Mahdavi & Geller (2001) Mahdavi A., Geller M. J., 2001, ApJ, 554, L129
- Massey & Goldberg (2008) Massey R., Goldberg D. M., 2008, ApJ, 673, L111
- Milosavljević et al. (2006) Milosavljević M., Miller C. J., Furlanetto S. R., Cooray A., 2006, ApJ, 637, L9
- Natarajan et al. (2009) Natarajan P., Kneib J.-P., Smail I., Treu T., Ellis R., Moran S., Limousin M., Czoske O., 2009, ApJ, 693, 970
- Oke et al. (1995) Oke J. B., Cohen J. G., Carr M., Cromer J., Dingizian A., Harris F. H., Labrecque S., Lucinio R., Schaal W., Epps H., Miller J., 1995, PASP, 107, 375
- Peng et al. (2002) Peng C. Y., Ho L. C., Impey C. D., Rix H.-W., 2002, AJ, 124, 266
- Puetzfeld et al. (2005) Puetzfeld D., Pohl M., Zhu Z.-H., 2005, ApJ, 619, 657
- Richard et al. (2009a) Richard J., Kneib J., Limousin M., Edge A., Jullo E., 2009a, ArXiv e-prints
- Richard et al. (2009b) Richard J., Smith G., Kneib J., Ellis R., Sanderson A., Pei L., Targett T., Sand D., Swinbank M., Dannerbauer H., Mazzotta P., Limousin M., Egami E., Jullo E., Hamilton-Morris V., Moran S., 2009b, ArXiv e-prints
- Schmidt & Allen (2007) Schmidt R. W., Allen S. W., 2007, MNRAS, 379, 209
- Schrabback et al. (2007) Schrabback T., Erben T., Simon P., Miralles J., Schneider P., Heymans C., Eifler T., Fosbury R. A. E., Freudling W., Hetterscheidt M., Hildebrandt H., Pirzkal N., 2007, A&A, 468, 823
- Schrabback et al. (2009) Schrabback T., Hartlap J., Joachimi B., Kilbinger M., Simon P., Benabed K., Bradač M., Eifler T., Erben T., Fassnacht C. D., High F. W., Hilbert S., Hildebrandt H., Hoekstra H., Kuijken K., Marshall P., Mellier Y., Morganson E., Schneider P., Semboloni E., Van Waerbeke L., Velander M., 2009, ArXiv e-prints
- Smith et al. (2009) Smith G. P., Ebeling H., Limousin M., Kneib J., Swinbank A. M., Ma C., Jauzac M., Richard J., Jullo E., Sand D. J., Edge A. C., Smail I., 2009, ArXiv e-prints
- Smith & Taylor (2008) Smith G. P., Taylor J. E., 2008, ApJ, 682, L73
- Sommer-Larsen & Limousin (2009) Sommer-Larsen J., Limousin M., 2009, ArXiv e-prints
- Wetzel & White (2009) Wetzel A. R., White M., 2009, ArXiv e-prints