New evidence for lack of CMB power on large scales
Abstract
A digitalized temperature map is recovered from the first light sky survey image published by the Planck team, from which an angular power spectrum is derived. The amplitudes of the low multipoles measured from the preliminary Planck power spectrum are significantly lower than that reported by the WMAP team. Possible systematical effects are far from enough to explain the observed low- differences.
1 Introduction
The first light survey image covering about 10% of the sky has been published by the Planck team[1]. Recently, through a visual comparison of this first light sky survey with the WMAP and COBE results by using greyscale images, Cover[2] found that there are substantial differences at large scale (low-) between the WMAP and Planck sky maps. In this work, we extract the temperature intensity information from the published Planck image and located their corresponding pixels on the sky to produce a sky map. We then derive a CMB power spectrum from the map and find the amplitudes of the low multipoles measured from the spectrum being significantly lower than WMAP release, which is consistent with what is seen by Cover[2] and also consistent with our findings from an improved spectrum by using the WMAP data and our own software[3].
2 Producing temperature map
2.1 From image color to temperature bin number
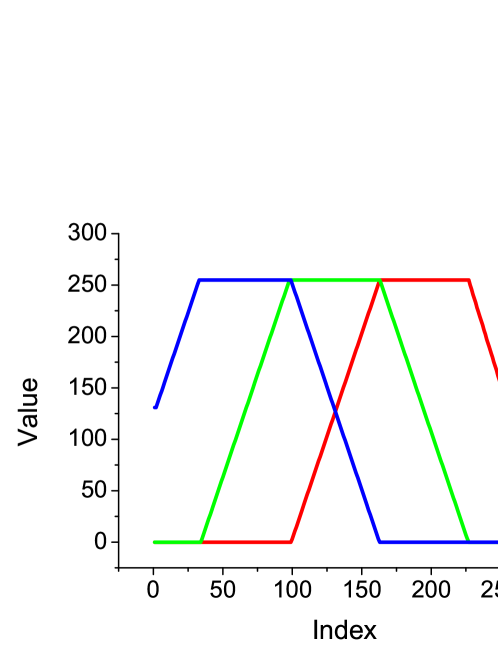
The published first light survey image[1] is plotted with a blue-to-red color table on which lower values are presented with blue, median values with green, and higher values with red (see Fig. 1). Therefore, we can obtain the temperature intensities by reversing this relationship. Since the image is given in JPEG format, a lossy compression by which the color might be slightly twisted, the safest way is to compute the rms difference of each pixel’s color to all 256 standard colors of 256 bins, and take the bin with the minimum rms as the temperature intensity.
2.2 From image to sky map
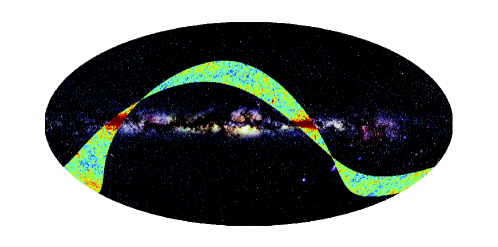
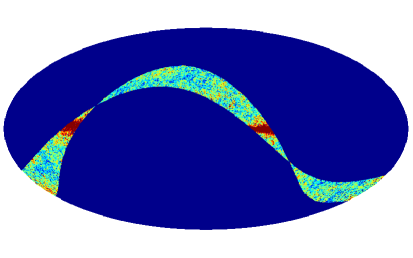
The published image is plotted in Mollweide projection in resolution . We use the center of this image as the origin, find corresponding HEALPix[4] pixel number of each image pixel, and then set its value to the recovered temperature bin number (). Since the image contains no more than 2 millions available pixels, which is much less than the effective pixel number of HEALPix resolution , the HEALPix resolution is finally set to .
The reliability of our method can be checked by comparing the Mollweide view image of the recovered map with the initial Planck image. As shown in Fig. 2, they are consistent to each other. We also test the relative error induced by the transmission from a JPEG image into fits format temperature map in this way: use the WMAP 5-year ILC map to plot a JPEG format Mollweide image; transform it into a fits format output temperature map with the same process used for the Planck first light image; compute the CMB power spectra of both the input ILC map and output map; then we find that the RMS of relative difference between the two power spectra is about for .
2.3 From color bin number to temperature
To transform the color bin number to real temperatures, three methods are adopted to estimate the temperature to bin number ratio .
Firstly, we know that for pure CMB, the RMS is about 50 K, and the Planck first light survey covers about of the sky or more than 70,000 effective pixels; therefore, the maximum and minimum temperatures in the image should be at least , which is about in 256 bins. This gives the lower limit of the ratio which is 1.17 . Since there exist foreground and noise, the real ratio must be significantly higher than this value.
Secondly, for all pixels in the Planck scanned region and outside the WMAP KQ85 mask[5], we sort their color bin numbers and take out the maximum and minimum to compute the average values, which are 58.7 and 172.9 respectively. Then we do the same thing to the 5-year WMAP ILC map and get -123 and 118 . Therefore, the ratio estimated in this way is roughly 2.11 . With other WMAP bands from Q to W, varies from 2.1 to 2.9 .
The last method is to compute the ”bin number power spectrum”, which is to use the color bin number map instead of the temperatures to compute the CMB power spectrum. Then we fit the obtained power spectrum to known WMAP5 CMB power spectrum in range to determine the ratio . Two models are used in fitting: The first is the WMAP5 CMB power spectrum, and the second is a white noise component. Both models are modified by a beam profile of 0-30 arcminute FWHM. The best least-square fit occurs at beam width equal to 22 arcminute FWHM and , which is very close to the value derived by method 2 from W-band. The ”bin number power spectrum” modified with the best-fit parameters is given in Fig. 3. The maximum ratio is and occurs at 0 arcminute FWHM, which can be taken as the upper limit of .
In summary, the ratio is estimated with three independent methods and we get consistent results including the best-fit value and the upper and lower limits. This is useful, because we find that, even with the upper limit of , the Planck low- components (proportional to ) are still significantly lower than WMAP. Therefore we can safely conclude that the Planck low- components are really lower than WMAP.

3 CMB power spectrum
With the ”Planck” CMB temperature map obtained above, we start to compute the CMB power spectrum. We use a mask to remove the unscanned pixels (deep blue pixels in the lower panel of Fig. 2) and then use the WMAP 5-year KQ85 mask[5] to remove the pixels possibly contaminated by strong foreground emission. After that, a CMB power spectrum is derived from the map. This CMB power spectrum still need to be fixed for beam function and noises; however, there is no such information and the only way (perhaps) is to do some fittings like in method 3 in §2.3. The result is actually the same as shown in Fig. 3. We don’t provide more power spectrum for because the effect of beam function and noises are strong there, and we need the true Planck beam function and noise properties to obtain reliable results for such high- components.
Not like the high- components, the low- components are almost unaffected by the beam function or noises, and we have seen substantial differences between the Planck and WMAP published maps at these low- (large angular scale) components.
Since the Planck scanned region is only about of the sky, it is difficult to compare its low- components directly with the released WMAP results; however, we can use the same mask (the Planck unscanned region + KQ85) to compute the power spectra from the WMAP (V-band) and our safe-mode (also V-band) maps, and completely neglect the cut-sky correction. In this way, low- components in the scanned region can be directly compared under exactly the same conditions. The results are listed in Table 1. The ratio used in Table 1 is the upper limit: 3.3 . Note that the power spectrum is proportional to . The uncertainties are estimated by the results from three different bands of WMAP. We deduce that the Planck uncertainties should have similar or most probably smaller amplitude. From Table 1 we see that the “Planck” power spectrum at low- is apparently much lower than WMAP values even with the upper limit of . Compared to the WMAP official maps, our safe mode maps[3] are apparently more consistent with “Planck” at low-.
Table 1: Low- components of power spectra from CMB maps
in the Planck first light survey region without cut-sky correction, in .
Planck
WMAP (release)
WMAP (safe mode)
2
1.91
3
3.75
4
3.94
5
29.6
Two points have to be noticed: firstly, the ratio is the upper limit, 3.3 , in Table 1. This strongly indicates that the real Planck low- components should be even lower than listed. Secondly, it seems that the foreground emission has not been removed from the Planck first light survey image. By removing the foreground, it is certain that the Planck low- components will further decrease. For instance, the WMAP values in Table 1 is derived from foreground-clean map, otherwise the quadrupole will be 15.1 , not merely 2.56 .
4 Effect of the systematics
It is almost certain that the Planck first light survey image contain some systematics. Here, the effect of different kinds of systematics upon the low- components are discussed.
Firstly, the beam profile and noise properties are unknown for the first light survey image; however, the low- components are almost unaffected by them. The ratio is affected; however, as discussed above, even with the upper limit of , the low- components of Planck are still much lower than WMAP, to say nothing of the best-fit value of .
Secondly, it seems that the foreground emission has not been removed in the Planck image. However, after applying the KQ85 mask, the residual foreground is actually very weak and does not affect the power spectrum significantly, e.g., no more than according to experience from WMAP, and most importantly, removing the foreground will weaken both the high- and low- components, which will only enhance our conclusion.
Next, the temperature map resolution is limited by the image resolution and can not exceed ; however, this is quite enough to estimate the low- components. In fact, is already enough for .
In the end, although the Planck image must have been well-calibrated (as emphasized by them in bold in [1], the first light survey image is used to ”demonstrate the ability to calibrate the equipment over long periods”), it is still possible that the calibration is imperfect. Although we don’t know the details of Planck calibration, it is reasonable to believe that, like WMAP, the most important purpose of calibration is to determine the equipment gain 111No equipment can work like a thermometer and measure the CMB temperature directly, so something like a gain between the CMB radiation intensity and the temperature fluctuation must exist in all CMB experiments and baseline. The gain artifact affects both high- and low- components equally. Since the Planck high- components are very close to expectation (Fig. 3), we can safely conclude that the gain artifacts must be weak. The baseline artifact is very similar to the foreground, and we can even call it ”equipment foreground”; therefore, same as the foreground, cleaning the gain artifact will only make the low- components lower and our conclusion stronger.
It is common to see in experiments that, lower is the systematics, lower is the derived values, especially for something like energy or power spectrum. That’s because errors or systematics are expected to contribute an extra ”power”, which must be uncorrelated with the true signal, and the overall effect will be most probably ”larger”. If in the Planck first light survey, it is the systematics that make the low- components too lower, then the systematics must be significantly correlated with the true signal, which is almost impossible. Therefore, we believe that the Planck low- components are really lower than WMAP.
5 Discussion
From the Planck first light sky survey image we see that the most prominent feature of CMB anisotropy, revealed by WMAP with its first acoustic peak, is certainly real and well confirmed by Planck. On the other hand, for the low- components (see Table 1), significant differences between the Planck preliminary spectrum and WMAP release exist. It is obvious that the published Planck first light image is possibly contaminated by systematic instrumental effects and might be unsuitable for precise cosmology study, e.g. for cosmological parameters estimation. However, as discussed in § 4, for the low- components, the fact that they are significantly lower than WMAP is quite beyond doubt.
Recently, we found a remarkable inconsistency between the input data and reconstructed temperatures in WMAP team’s map-making and observed serious ecliptic contamination in published temperature maps[3]. That indicates there must be a serious problem in the map making routine of the WMAP team. We then independently developed a map-making software which can completely overcome the problem of inconsistency. We used the improved software to produce new WMAP temperature maps in safe mode with stronger constraints on data selection for planet avoidance. The power spectrum derived from our safe mode maps has nearly zero quadrupole component, which is consistent with what revealed by the Planck first light survey.
Tegmark et al.[6] found in the released first year WMAP maps both the CMB quadrupole () and octopole () having power along a particular spatial axis, and more works[7-10] found that the preferred directions of these two low- components are highly aligned and close to the ecliptic plane. Such a strange orientation of large-scale patterns of CMB maps in respect to the ecliptic frame has long puzzled cosmologists. Our work[3] pointed out that the CMB quadrupole component apparent in the published WMAP maps is not of cosmological origin, but mainly came from ecliptic contamination induced by inappropriate map-making. From the comparison between Planck and WMAP for greyscale maps by Cover[2] and for power spectra in our present work, the Planck first light survey image strongly supports the artificial origin of quadrupole observed in official WMAP maps and the real CMB quadrupole is most possibly near zero.
Table 1 shows that not only the quadrupole, but also other low- components, from (octopole) to , are very weak. We have found two kinds of systematic errors in official WMAP maps. One is the pixels in the WMAP scan ring of a hot pixel being systematically cooled[11,12]. Another one is the significant correlation between the temperature and the observation number of a sky pixel[11,13]. These two kinds of systematic effects also remain in our safe mode maps. The sky coverage of WMAP mission is nonuniform: the number of observations is greatest near the ecliptic poles and in rings from each pole, and least in the ecliptic plane. The non-uniform exposure pattern should produce artificial power component at low- through the systematic effects mentioned above. It is expected that after properly correcting systematics low- spectrum of WMAP safe-mode maps can be more consistent with the Planck survey result.
References
-
(1)
1. The Planck first light survey image is available on-line at:
http://sci.esa.int/science-e/www/object/index.cfm?fobjectid=45543 - (2) 2. Cover, Keith S., arxiv:0910.5102
- (3) 3. Liu, H. and Li, T.P., arxiv:0907.2731
- (4) 4. Gorski, K. et al., Astrophys. J., 622, 759 (2005)
- (5) 5. Gold, B., et al., Astrophys. J. Suppl., 180, 265 (2009)
- (6) 6. Tegmark, M., de Oliveira-Costa, A. & Hamilton, A.J., Phys. Rev. D, 68, 123523 (2003)
- (7) 7. de Oliveira-Costa, A., Tegmark, M., Zaldarriaga, M. & Hamilton, A., Phys. Rev. D, 69, 063516 (2004)
- (8) 8. Eriksen, H.K., Hansen, F.K, Banday, A.J., Grski, K.M. & Lilje, P.B., Astrophys. J., 605, 14 (2004)
- (9) 9. Schwarz, D.J., Starkman, G.D., Huterer, D. & Copi, C.J., Phys. Rev. Lett., 93, 221301 (2004)
- (10) 10. Jaffe, T.R., Banday, A.J., Eriksen, H.K., Grski, K.M. & Hansen, F.K., Astrophys. J., 629, L1 (2005)
- (11) 11. Liu, H. & Li, T.P., arXiv:0806.4493
- (12) 12. Liu, H. & Li, T.P., Sci China G: Phy Mech Astron, 52, 804 (2009); arXiv:0809.4160v2
- (13) 13. Li, T.P., Liu H., Song L.M., Xiong S.L. & Nie J.Y., Mon. Not. Roy. Astron. Soc., 398, 47 (2009)