Dust tori in radio galaxies
Abstract
Aims. We investigate the quasar – radio galaxy unification scenario and detect dust tori within radio galaxies of various types.
Methods. Using VISIR on the VLT, we acquired sub-arcsecond () resolution N-band images, at a wavelength of 11.85 m, of the nuclei of a sample of 27 radio galaxies of four types in the redshift range . The sample consists of 8 edge-darkened, low-power Fanaroff-Riley class I (FR-I) radio galaxies, 6 edge-brightened, class II (FR-II) radio galaxies displaying low-excitation optical emission, 7 FR-IIs displaying high-excitation optical emission, and 6 FR-II broad emission line radio galaxies. Out of the sample of 27 objects, 10 nuclei are detected and several have constraining non-detections at sensitivities of 7 mJy, the limiting flux a point source has when detected with a signal-to-noise ratio of 10 in one hour of source integration.
Results. On the basis of the core spectral energy distributions of this sample we find clear indications that many FR-I and several low-excitation FR-II radio galaxies do not contain warm dust tori. At least percent of the high-excitation FR-IIs and almost all of the broad line radio galaxies exhibit excess infrared emission, which must be attributed to warm dust reradiating accretion activity. The FR-I and low-excitation FR-II galaxies are all of low efficiency, which is calculated as the ratio of bolometric to Eddington luminosity . This suggests that thick tori are absent at low accretion rates and/or low efficiencies. The high-excitation FR-II galaxies are a mixed population with three types of nuclei: 1) low efficiency with dust torus, 2) low efficiency with weakly emitting dust torus, and 3) high efficiency with weak dust torus. We argue that the unification viewing angle range 0-45 degrees of quasars should be increased to 60 degrees, at least at lower luminosities.
Key Words.:
Galaxies: active – Galaxies: jets – Galaxies: nuclei – Infrared: galaxies – Radiation mechanisms: non-thermal – Radiation mechanisms: thermal.1 Introduction
Powerful radio galaxies are understood to host quasar-like nuclei that are obscured by circumnuclear dust tori perpendicular to the radio jets (Barthel 1989; Urry & Padovani 1995). If this unification scenario is correct, infrared observations of the nuclei of radio galaxies may act as calorimeters that indicate the levels of accretion activity. The dust tori, believed to be clumpy and to extend out to radii of tens to hundreds of parsecs (Krolik & Begelman 1988; Nenkova et al. 2002; Granato et al. 1997; Shi et al. 2006), reradiate the optical and ultraviolet emission originating from the accretion disks surrounding the supermassive black holes (). However, only radio galaxies displaying high-excitation narrow-line optical emission, referred to as high-excitation radio galaxies (HEGs), are understood to host obscured broad line and bright continuum emission, and to be in the process of active black hole accretion (Barthel 1994; Laing et al. 1994). Certain radio galaxies exhibit only low-excitation narrow-line emission (Hine & Longair 1979), referred to as low-excitation radio galaxies (LEGs). Accretion in these objects may be, temporarily or not, at a low level, the line emission being to some part due to hot star ionization. Infrared observations can help to confirm whether these radio galaxies indeed currently host inactive non-thermal nuclei.
A number of mid- and far-infrared surveys of radio galaxies have detected hidden quasars among powerful radio galaxies. These suggest that the scale-height of the torus increases, that is to say the inner radius increases but the outer radius does not change, for more luminous radio galaxies (Haas et al. 2004). Starbursts are also infrequently found to be co-heating the dust (Tadhunter et al. 2007). On average, quasars are more powerful than radio galaxies in the mid-infrared because of the beamed emission of the former (Cleary et al. 2007). Infrared surveys have furthermore identified a separate population among radio galaxies of Fanaroff-Riley type II (FR-II), which are mid-infrared weak and probably do not contain hidden quasars (Meisenheimer et al. 2001; Ogle et al. 2006). These objects are most common at lower radio luminosities and among galaxies that exhibit low-excitation optical emission features. They are predominantly found at redshifts , and have weaker jets. They may correspond to the excess number of radio galaxies relative to quasars at and explain their distributions of size (Singal 1993). It is speculated that they form part of the parent population of variable active nuclei with a beamed component close to the line of sight (Laing 1994).
This division between radio galaxy populations, according to the radiative properties of the active nucleus, is not linked one-to-one with the well-known radio-power dependent dichotomy in radio morphology (Fanaroff & Riley 1974). Low radio luminosity sources are edge-darkened and have radio jets that quickly decelerate and flare (Fanaroff-Riley type I sources, referred to as FR-Is). High luminosity sources are edge-brightened, with jets that remain relativistic over tens to hundreds of kpc, ending in bright hotspots (FR-IIs). The dividing line occurs around a luminosity . Almost all FR-Is exhibit only low-excitation optical emission lines. FR-IIs have three kinds of excitation features: low-excitation or high-excitation narrow lines, and broad lines. LEGs have dominating low-excitation and/or weak/absent high-excitation emission. They are identified on the basis of one or more of the following criteria: emission-line ratios and , equivalent widths or strengths including for stellar absorption lines or the -break, while for HEGs these emission-line ratios, equivalent widths, and strengths are higher (Baum et al. 1992; Jackson & Rawlings 1997; Morganti et al. 1997). Broad-line radio galaxies (BLRGs) are identified by having at least one broad emission-line () (Morganti et al. 1997). Since FR-IIs produce about ten to fifty times as much emission-line luminosity as FR-Is for the same radio core power, the engines of FR-Is and FR-IIs differ (Zirbel & Baum 1995). It could be that FR-I sources are produced when the central engine is fed by matter at a lower accretion rate, leading to the creation of a source in which the ratio of radiating to jet bulk kinetic energy is low, while FR-II sources are produced when the central engine is fed at a higher accretion rate, causing the central engine to deposit a higher fraction of its energy in radiating energy (Baum et al. 1995). Alternatively, Elitzur & Shlosman (2006) claim that the torus is produced by an outflow of material from the centre. For a low-luminosity, low-level activity nucleus, this outflow will transform into a radio jet, similar to what is believed to happen in X-ray binaries. This could explain why for the same emission-line activity the FR-Is produce more radio core power than the FR-IIs.
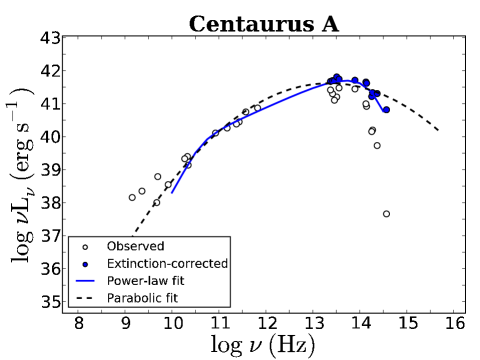
The thermal and/or non-thermal nature of the cores of low and high power radio galaxies, and their place in unification scenarios can be addressed using multiwavelength studies (Polletta et al. 2000; Quillen et al. 2003). An infrared excess above a standard synchrotron spectrum fitted to high frequency radio core data is indicative of hot circumnuclear dust. On the other hand the absence of this excess or short-period flux variablity, is indicative of a purely non-thermal nucleus. On the basis of Hubble Space Telescope (HST) optical and ultraviolet data of the cores of FR-Is, Chiaberge et al. (1999, 2002b) and Verdoes Kleijn et al. (2002) show that these nuclei follow a linear correlation in the radio-optical and radio-ultraviolet luminosity plane. This supports the hypothesis that the radio, optical, and ultraviolet emission have a common synchrotron origin. Within this picture, FR-I nuclei are not covered by thick dust tori and have spectral energy distributions (SEDs) that are dominated by non-thermal emission. This is confirmed for M87 (Whysong & Antonucci 2004; Perlman et al. 2007) and for similar nuclei with low-ionization nuclear emission regions (LINERs) (Maoz et al. 2005). At a one-parsec-level, the FR-I radio galaxy Centaurus A is shown to be dominated by a synchrotron source, as inferred from mid-infrared interferometric observations with the VLT (Meisenheimer et al. 2007). The synchrotron nucleus is argued to be surrounded by a small circumnuclear dust disk, which causes a visual foreground extinction of mag. The overall, dereddened core spectrum of Cen A is characterized by a power-law that cuts off exponentially towards high frequencies at Hz and becomes optically thick at GHz. In Fig. 1, the observed and extinction-corrected core luminosities, calculated from flux values listed in Table 7, are plotted together with the synchrotron spectrum fit, expressed by
| (1) |
where and are the optically thick and thin spectral indices (Polletta et al. 2000). This spectrum can also be fitted by a parabolic function, which is found to be a good approximation (Landau et al. 1986; Andreani et al. 2002; Leipski et al. 2009). Both type of fits and the nuclear mid-infrared luminosity of found by Whysong & Antonucci (2004) do not imply a large amount of thermal emission. Although spectral energy distributions seem to indicate that thick dust tori are absent in FR-I radio galaxy nuclei, dust disks, kiloparsecs in size, surrounding FR-I nuclei have been seen in HST images (Martel et al. 1999), and some contain high molecular gas masses as deduced from high resolution CO maps (Okuda et al. 2005; Das et al. 2005).
The multiwavelength properties of FR-II galaxy cores are more diverse than those of FR-Is. Broad-line radio galaxies (BLRGs) of FR-class II are very bright in the optical: their hosts are often of the N-type. Their nuclei show a large optical excess with respect to the radio-optical correlation found for FR-I galaxies. This excess could well represent unobscured thermal emission from an accretion disk. Broad lines are seen in objects spanning many orders of optical magnitude, from LINERs to quasars. The efficiency of the mass accretion onto the disks varies enormously (Chiaberge et al. 2002a). The far-infrared emission of BLRGs, which is much brighter than that of LEGs and HEGs, indicates that they have a special character (Hes et al. 1995). Their place in unification schemes is still unclear. While some may be considered to be weak quasars, others are viewed at grazing incidence to the torus and the jets are directed farther away from us than in the case of quasars (Dennett-Thorpe et al. 2000). The warm and cool dust emission indicate that BLRGs have possibly undergone a different merger evolution or have a relatively old active galactic nucleus (van Bemmel & Barthel 2001).
Some HEGs show evidence of harboring a hidden quasar nucleus from optical excess in the radio-optical with respect to the radio-optical correlation found for FR-I galaxies. Others do not show this excess, but sometimes spectropolarimetric studies indicate a hidden quasar. Another group of HEGs show, similar to low-excitation radio galaxies (LEG) of type II, true unobscured FR-I-like nuclei (Chiaberge et al. 2002a). It seems that LEGs and certain HEGs together constitute a distinct population, characterized by a low accretion rate and/or efficiency, weak or absent broad line emission, and lack of a significant nuclear absorbing structure. These LEGs and HEGs have probably undergone slower cosmic evolution (Willott et al. 2000) than the HEGs with hidden quasars and BLRGs. Alternatively, it has been argued that the torus covering fraction may increase with decreasing radio luminosity (Lawrence 1991).
To shed light on these issues, we obtained N-band (12 m) VISIR observations of a sample of 8 FR-I, 6 low- and 7 high-excitation FR-II galaxies, and 6 broad-line radio galaxies. We address the thermal or non-thermal nature of their nuclei and their place in the unification scheme. The sample is described in Sect. 2 and the observations in Sect. 3. Core spectral energy distributions and other results are presented in Sect. 4. Discussion and conclusions are presented in Sect. 5 and 6. Throughout this paper, we assume a cold dark matter (CDM) cosmology with a Hubble constant and a critical matter and cosmological constant density parameter of and (Spergel et al. 2007). All luminosities are calculated in the emitted frame, using
| (2) |
where is the observed frequency, is the distance calculated for this cosmology and redshift, , and is the observed flux.
| Source | Class | Ref. | Freq. | Ref. | Ref. | VISIR | ||||||
|---|---|---|---|---|---|---|---|---|---|---|---|---|
| Resolution | ||||||||||||
| (erg s-1) | (GHz) | (erg s-1) | (parsec) | |||||||||
| (1) | (2) | (3) | (4) | (5) | (6) | (7) | (8) | (9) | (10) | (11) | (12) | (13) |
| 4C12.03 | 0.15600 | LEG | 5 | 41.98 | 2.66 | 1.5 | 5 | 40.9 | 7 | 1400 | ||
| 3C015 | 0.07300 | LEG | 8 | 41.64 | 2.02 | 2.3 | 6 | 3.7 | 40.4 | 6 | 610 | |
| 3C029 | 0.04503 | FR-I | 8 | 41.26 | 1.79 | 2.3 | 6 | 1.7 | 39.9 | 6 | 370 | |
| 3C040 | 0.01800 | FR-I | 8 | 40.63 | 1.61 | 2.3 | 6 | 38.9 | 6 | 140 | ||
| 3C078 | 0.02865 | FR-I | 8 | 40.94 | 0.92 | 2.3 | 6 | 39.1 | 6 | 230 | ||
| Fornax A | 0.00587 | FR-I | 8 | 40.72 | 3.40 | 2.3 | 6 | 38.6 | 6 | 40 | ||
| 3C093 | 0.35700 | BLRG | 6 | 43.02 | 2.38 | 5.0 | 2,7 | 3.9 | 3 | 3500 | ||
| 3C098 | 0.03045 | HEG | 5 | 41.31 | 2.70 | 8.3 | 4 | 2.9 | 15 | 40.9 | 1 | 240 |
| 3C105 | 0.08900 | HEG | 8 | 41.80 | 2.27 | 2.3 | 6 | 16 | 40.8 | 6 | 750 | |
| 3C120 | 0.03301 | BLRG | 8 | 40.73 | 1.01 | 2.3 | 6 | 5.7 | 41.8 | 6 | 270 | |
| 3C135 | 0.12738 | HEG | 5 | 42.05 | 2.71 | 8.3 | 3 | 42.0 | 9 | 1100 | ||
| Pictor A | 0.03506 | BLRG | 8 | 42.22 | 1.57 | 2.3 | 6 | 1.8 | 4.2 | 41.2 | 6 | 280 |
| 3C198 | 0.08147 | HEG | 3 | 41.56 | 2.20 | 5.0 | 1,7 | 1.2 | 2.1 | 41.1 | 8 | 680 |
| 3C227 | 0.08583 | BLRG | 8 | 42.13 | 2.55 | 2.3 | 6 | 13 | 9.0 | 41.8 | 6 | 710 |
| 3C270 | 0.00746 | FR-I | 8 | 40.21 | 1.71 | 2.3 | 6 | 4.7 | 38.9 | 2,10 | 55 | |
| Centaurus A | 0.00095 | FR-I | 8 | 40.30 | 1.35 | 2.3 | 6 | 2.5 | 6.3 | 38.3 | 5,6 | 7 |
| PKS141719 | 0.12000 | BLRG | 4 | 41.79 | 2.20 | 5.0 | 7,8 | 22 | 2.2 | 4 | 1000 | |
| 3C317 | 0.03446 | FR-I | 8 | 41.38 | 0.79 | 2.3 | 6 | 0.37 | 3.1 | 40.0 | 6 | 280 |
| 3C327 | 0.10480 | HEG | 8 | 42.17 | 2.19 | 2.3 | 6 | 12 | 15 | 42.1 | 6 | 890 |
| 3C353 | 0.03042 | LEG | 8 | 42.01 | 2.64 | 2.3 | 6 | 0.92 | 39.3 | 6 | 240 | |
| PKS183948 | 0.11120 | LEG | 8 | 41.99 | 1.16 | 2.3 | 6 | 39.2 | 6 | 960 | ||
| 3C403 | 0.05900 | HEG | 8 | 41.59 | 2.18 | 2.3 | 6 | 8.4 | 20 | 41.6 | 6 | 490 |
| 3C403.1 | 0.05540 | LEG | 7 | 41.04 | 450 | |||||||
| 3C424 | 0.12699 | LEG | 5 | 42.03 | 1.70 | 8.3 | 3 | 40.7 | 9 | 1100 | ||
| PKS2158380 | 0.03330 | HEG | 2 | 40.56 | 1.92 | 5.0 | 7,9 | 270 | ||||
| 3C445 | 0.05620 | BLRG | 8 | 41.66 | 1.57 | 2.3 | 8 | 14 | 13 | 42.0 | 6 | 460 |
| PKS235435 | 0.04905 | FR-I | 1 | 41.24 | 1.16 | 5.0 | 7,10 | 400 |
-
Column (2) Redshifts are from the NED catalogue, except for Centaurus A, which is calculated from the distance from Rejkuba (2004). Column (3) Classifications: FR-I stands for Fanaroff-Riley class I radio galaxy, LEG and HEG for low- and high-excitation Fanaroff-Riley class II radio galaxy and BLRG for broad-line radio galaxy. Column (4) References to classifications: 1=Burgess & Hunstead (2006), 2=Baum et al. (1992), 3=Black et al. (1992), 4=Grandi & Osterbrock (1978), 5=Hardcastle et al. (1998), 6=Hes et al. (1996), 7=Jackson & Rawlings (1997), and 8=Morganti et al. (1997). Column (5) Integrated radio source luminosities, at rest 408 MHz from Wright & Otrupcek (1996). Columns (6-8) Radio core fraction, i.e. the ratio of the core to the extended radio flux at 1.5, 2.3, 5.0, or 8.0 GHz frequencies and references: 1=Becker et al. (2003), 2=Bogers et al. (1994), 3=Hardcastle et al. (1998), 4=Hardcastle et al. (1999), 5=Leahy & Perley (1991), 6=Morganti et al. (1997), 7=Wright & Otrupcek (1996), 8=Zirbel & Baum (1995), 9=Fosbury et al. (1982), and 10=Schwartz et al. (1991). Columns (9-12) Optical emission-line ratios of to , to H, and optical emission-line luminosities calculated from flux values found in the literature. References to emission-line ratios and fluxes: 1=Costero & Osterbrock (1977), 2=Ferrarese et al. (1996), 3=Eracleous & Halpern (2003), 4=Grandi & Osterbrock (1978), 5=Hardcastle et al. (2007), 6=Tadhunter et al. (1993), 7=Wold et al. (2007), 8=Simpson et al. (1996), 9=Buttiglione et al. (2009), and 10=Ho et al. (1997). Column (13) Scale of the VISIR mid-infrared diffraction-limit of in parsecs.
| PKS | Alias | Date | Dist. | Lit. | Ref. | FWHM | ||||||
|---|---|---|---|---|---|---|---|---|---|---|---|---|
| Obj. | St. | |||||||||||
| Mpc | (mJy) | (mJy) | () | () | () | (pc) | () | () | ||||
| (1) | (2) | (3) | (4) | (5) | (6) | (7) | (8) | (9) | (10) | (11) | (12) | (13) |
| 0007+12 | 4C12.03 | 2006-06-18 | 710 | 3 | 43.58 | 40.28 | ||||||
| 003401 | 3C015 | 2006-06-18 | 310 | 3 | 6 | 4 | 42.93 | 41.21 | ||||
| 005501 | 3C029 | 2006-12-27 | 190 | 4 | 2 | 4 | 42.56 | 40.28 | ||||
| 012301 | 3C040 | 2006-12-27 | 70 | 4 | 41.76 | 39.51 | 43.27 | |||||
| 0305+03 | 3C078 | 2006-12-27 | 120 | 4 | 42.18 | 40.78 | 43.57 | |||||
| 032037 | Fornax~A | 2006-12-27 | 20 | 9 | 41.03 | 37.81 | 42.44 | |||||
| 0340+04 | 3C093 | 2006-12-27 | 1800 | 5 | 44.56 | 40.75 | ||||||
| 0356+10 | 3C098 | 2005-12-18 | 130 | 201.4 | 24 | 2 | 42.930.04 | 38.91 | 42.95 | 180 | 0.47 | 0.37 |
| 0404+03 | 3C105 | 2005-12-18 | 390 | 2 | 42.93 | 40.06 | ||||||
| 0430+05 | 3C120 | 2006-12-27 | 140 | 24015 | 109 | 1 | 44.100.03 | 41.58 | 44.20 | 170 | 0.36 | 0.33 |
| 0511+00 | 3C135 | 2006-12-27 | 570 | 4 | 43.51 | 39.89 | ||||||
| 051845 | Pictor~A | 2006-12-27 | 150 | 684.3 | 43.590.04 | 41.09 | 43.82 | 200 | 0.34 | 0.33 | ||
| 0819+06 | 3C198 | 2006-12-27 | 350 | 4 | 43.13 | 39.13 | ||||||
| 0945+07 | 3C227 | 2006-12-27 | 370 | 293.1 | 44.010.05 | 40.38 | 44.96 | 410 | 0.36 | 0.33 | ||
| 1216+06 | 3C270 | 2006-06-18 | 30 | 2 | 27 | 4 | 40.72 | 39.17 | 42.44 | |||
| 132242 | Centaurus~A | 2006-12-27 | 3.8 | 120047 | 1800 | 3 | 41.690.03 | 38.79 | 42.69 | 5 | 0.37 | 0.33 |
| 141719 | PKS1417$-$19 | 2006-12-27 | 530 | 264.3 | 44.270.08 | 39.90 | 770 | 0.44 | 0.33 | |||
| 1514+07 | 3C317 | 2006-06-18 | 142 | 3 | 3 | 4 | 42.24 | 40.66 | 43.67 | |||
| 1559+02 | 3C327 | 2005-07-02 | 460 | 787.5 | 44.620.05 | 40.50 | 44.68 | 1300 | 1.25 | 0.42 | ||
| 171700 | 3C353 | 2005-07-02 | 125 | 4 | 42.28 | 40.02 | ||||||
| 183948 | PKS1839$-$48 | 2006-06-18 | 490 | 4 | 43.40 | 41.33 | ||||||
| 1949+02 | 3C403 | 2006-06-18 | 250 | 896.8 | 44.170.04 | 39.55 | 44.50 | 330 | 0.34 | 0.37 | ||
| 194901 | 3C403.1 | 2006-06-18 | 230 | 4 | 42.78 | |||||||
| 2045+06 | 3C424 | 2006-06-18 | 560 | 4 | 2 | 4 | 43.46 | 40.48 | ||||
| 2158380 | PKS2158$-$380 | 2006-06-18 | 140 | 172.8 | 42.940.07 | 38.88 | 43.68 | 200 | 0.37 | 0.33 | ||
| 222102 | 3C445 | 2005-07-02 | 240 | 19016 | 210 | 2 | 44.460.04 | 40.44 | 44.44 | 390 | 0.42 | 0.42 |
| 235435 | PKS2354$-$35 | 2006-06-18 | 210 | 3 | 42.55 | 39.08 | ||||||
-
Column (1) Parkes Radio catalogue reference. Column (3) Date of observation. Column (4) Distances under the chosen cosmology, determined from the redshifts. Column (5-7) VISIR mid-infrared core flux and 3- upper limits, at the SiC-band (11.9 m), compared to literature values: 1=Gorjian et al. (2004) (TIMMI, 1.5 , 10.8 m), 2=Siebenmorgen et al. (2004a) (ISOCAM, 5 , 14.3 m), 3=Whysong & Antonucci (2004) (Keck, 0.3 , 11.7 m) and 4=Leipski et al. (2009) (Spitzer IRS, 15 m). Column (8) VISIR mid-infrared core luminosity at rest wavelength. Column (9) Radio (5 GHz) core luminosity at rest wavelength from fluxes tabulated in Table 7. Column (10) IRAS mid-infrared galaxy luminosity at rest wavelength derived for most sources from flux from Golombek et al. (1988), for 3C227 from Hes et al. (1995), and for PKS2158380 from Moshir & et al. (1990). Columns (11-13) The radius at of the flux, the full width half maximum (FWHM) of the flux of the source and of the standard star.
2 Sample selection
From the well studied 3CR/4C and PKS radio galaxy samples, we extracted subsamples of nearby double-lobed FR-I galaxies, low- and high-excitation, and broad-line FR-II radio galaxies visible from Chile. The sources range in redshift from to , with two outliers: Centaurus A at and 3C93 at . The subsamples were chosen to span three orders of magnitude in radio core as well as in total power, to search for trends with radio power. Southern and equatorial objects were selected from three different studies: 1) FR-IIs from a high-resolution 3.6 cm VLA study (Black et al. 1992), 2) FR-Is and FR-IIs from the Hubble Space Telescope snapshot survey of a subsample of 3CR sources (Martel et al. 1999), and 3) FR-Is and FR-IIs from a , 2.3 GHz radio study (Morganti et al. 1997) of a subsample of radio galaxies complete down to a flux density of Jy at GHz (Wall & Peacock 1985). High resolution radio images for all but one object, 3C403.1, were available. All relevant optical spectroscopic classifications are extracted from Jackson & Rawlings (1997), Hardcastle et al. (1998, 1999), and Morganti et al. (1997). We note that BLRG 3C120 differs from the rest of the selected BLRG subsample, since it is strongly core-dominated and has a FR-I morphology.
The basic parameters of the radio galaxy sample - that is to say the unbiased subset as eventually observed with VISIR - are given in Table 1. The original division between edge-darkened, low-radio-power FR-Is and edge-brightened, radio-powerful FR-IIs was established by Fanaroff & Riley (1974), where FR-IIs have radio luminosities . In our sample, some galaxies classified as FR-Is have FR-II-like radio power close to the FR-I/FR-II division line. We here consider the radio morphology to be the defining classification property and not the radio power. Not surprisingly, we find some radio luminosity overlap between FR-Is and FR-IIs. The objects span a broad range in radio core fraction , where is the radio emission of the core and of the lobes: we find typical values of at GHz-frequencies of and note that the unusually high value for 3C120 is most likely caused by beamed core emission. Depending on their distance, the objects permit linear resolution of approximately 10-1000 parsec, for the diffraction-limit in the mid-infrared of , which is achievable with VISIR. Table 3 lists the median values of important physical parameters for the four different classes. In general, our sample constitutes fairly low-luminosity sources with compared to the sources detected by mid-infrared studies at intermediate redshift (Ogle et al. 2006).
3 VISIR observations and data reduction
We observed the nuclei of the 27 radio galaxies with VISIR, the Very Large Telescope imager and spectrometer for the mid-infrared (Lagage et al. 2004; Pantin et al. 2005), mounted on the Cassegrain focus of the VLT unit telescope 3, Melipal, in Cerro Paranal, Chile. The imaging data were obtained in guaranteed time during three nights in total in July and December 2005 and June and December 2006, through the SiC filter () in the N-band. The pixel scale is resulting in a field of view. To help remove the sky background, secondary mirror chopping was performed in the north-south direction with an amplitude of at a frequency of . This rate is sufficiently higher than the rate of the background fluctuations. Nodding was applied every 30 seconds using telescope offsets of in the east-west direction to eliminate optical path residuals that remain after chopping. The detector integration time was ms. Total source integration times were in the range of to .
With the SiC filter, the limiting flux of a point source detected at a signal-to-noise-ratio of 10 in one hour of on-source integration is of the order of 7 mJy as determined from long-term observations of calibration standard stars (VISIR user manual). Mid-infrared standard stars (Cohen et al. 1999) were observed frequently during the nights. Their FWHMs (Table 2) show that with this filter on average a diffraction-limited resolution of 0.36 is reached. This is an order of magnitude higher than can currently be obtained with infrared space observatories.
The standard star and program source data are reduced and analyzed in the same way. Stripes caused by variations in the detector temperature are removed, bad pixels blocked, the nod-images are co-added into one and finally the four beams are shifted and added into one. Flux and noise levels are extracted using multi-aperture photometry and the curve-of-growth method. The sky annulus is fixed to a size of 0.5 and begins where the source aperture radius ends, varying from 1 to 1.5. Of the 27 sources, we detect 10 with high signal-to-noise ratios; these span a substantial range in flux, from 17 to 1200 mJy and in distance, from 4 to 530 Mpc. Comparing the VISIR flux values to the wide beam IRAS 12 m values, we find mid-infrared core concentrations ranging from 4 – 100 percent. For the 17 non-detected sources, mostly FR-Is and LEG/FR-IIs, we are able to place three-sigma, three standard deviations, level upper limits using the sensitivies determined from the standard stars. The resulting values and derived luminosities are presented in Table 2.
Certain sample sources were observed previously by other investigators, at comparable infrared-wavelengths but somewhat lower resolution. The nucleus of FR-I Centaurus A is estimated to have a flux of 1.8 Jy (Whysong & Antonucci 2004) for a 11.7 m filter with a 2.4 m bandwidth. Both this and our measurement are in agreement with the 4 ISOCAM 10-20 m spectrum of the nucleus (see Fig. 2 of Mirabel et al. (1999)). Our flux measurement of 3C120, 240 mJy, is notably higher than that measured by Gorjian et al. (2004), which was 109 mJy and derived from a lower resolution image. This demonstrates the most likely variable, beamed, and non-thermal nature of the infrared-emission. This conclusion is also supported by the lack of an infrared excess above the synchrotron fit in the core spectral energy distribution (Fig. 6). The 10-20 m ISOCAM observations of HEG 3C98 and BLRG 3C445 (Siebenmorgen et al. 2004a) infer the same fluxes as our measurements. On the other hand, our non-detection and the detection with the Spitzer IRS (3.7 slit width) (Leipski et al. 2009) show that the mid-infrared emission in FR-I 3C270 must be of an extended nature compared to the VLT/VISIR 0.36″ beam. Possibly inconsistent with this conclusion is that this extended emission probably originates from star formation and in situ heating, yet PAHs are weak or absent in the high-quality Spitzer spectrum. Galaxy 3C15 is detected with the Spitzer IRS, but not with VISIR: the IRS spectrum includes the radiation of the arcsecond scale jet, seen in the optical, but shows no sign of star formation. Three other galaxies, 3C29, 3C317, and 3C424 with Spitzer IRS spectra have flux values consistent with our VISIR upper limits. Finally, published VISIR observations of Centaurus A and 3C445 in three other N-band-filters, centred on 10.49, 11.25, and 12.81 m (Horst et al. 2009) are consistent with our data.
To search for extended dust structures in the detected sources, we subtracted the PSF obtained by averaging standard stars observed close in time to the sources. The raw images, extended dust structure maps, and radial profiles are shown in Fig. 2. Our PSF-subtraction method subtracts the PSF from the photometric center of the sources. Extended structures contributing up to 10 percent of the flux are detected. These prominent extended structures are found mostly in the BLRGs.
4 Results
4.1 Dust morphology
We detect an extended warm dust structure in the center of nearby FR-I Centaurus A. For the FR-II radio galaxies, this is the case for none of the six LEGs, four out of seven HEGs, and five out of six BLRGs (see Fig. 2). In the following subsections, we discuss the mid-infrared core morphologies and concentrations and the relation between the dust detected in the infrared and inferred from obscuration in the optical, for each type of radio galaxy.
4.1.1 FR-I radio galaxies
For the prototypical, close-by, FR-I source Centaurus A / NGC5128, we find evidence of extended dust emission (Fig. 2), surrounding the almost naked synchrotron core. As for Siebenmorgen et al. (2004b), but at a higher resolution, 0.33 instead of 0.50, and at a wavelength of instead of , we find an unresolved core (FWHM parsec) showing some extended emission. We find that the extension is at an position angle of 100 degrees south-east of the nucleus. We interpret this emission as originating in a circumnuclear dust disk, of which the north-west emission is not visible at these wavelengths. The structure starts 2 parsec away from the center reaching outwards to 7 parsec and contributes percent of the flux. Judging from the symmetry of the extended structure, the inclination of the disk must be almost edge-on. At even higher resolution, using the VLTI MIDI instrument, the core remains unresolved ( mas) (Meisenheimer et al. 2007), but an inner circumnuclear dust disk is resolved, which has a major axis that is probably orientated along a position angle of degrees, has a diameter of parsec, and contributes percent of the flux at a wavelength of and percent at . Hence, the inner and outer disk have comparable orientations. Together with other VISIR data of Cen A, we are able to compile a N-band spectral energy distribution and compare it with low resolution spectra made by the Spitzer Infrared Spectrograph (IRS), (see Fig. 10 in Horst et al. 2009). The PAH emission feature at 11.3 m is only visible at the lower Spitzer resolution. The N-band VISIR spectral energy distribution indicates pure continuum emission on the 10 parsec scale.
From their optical and UV images, it is known that FR-Is 3C40 and 3C270 contain regular, large-scale circumnuclear dust disks (Jaffe et al. 1993; Martel et al. 1999; Allen et al. 2002). We do not detect these disks with VISIR, indicating that they originate farther than 100 parsec from the center, or do not radiate. For the other FR-Is in our sample, all non-detected with VISIR, the nuclei do not show any obvious signs of dust structures in the optical. For FR-I 3C29, the optical nucleus is resolved at 0.1 (Martel et al. 1999). 3C78’s nucleus is unresolved, which is indicative of a compact core. An optical jet arising from the nucleus has been detected. 3C317’s nucleus is likely unresolved and shows evidence of an extremely faint dust lane. Our VISIR non-detection confirms the lack of significant dust emission. The FR-I galaxies in our sample have weak total mid-infrared luminosities as well. Only the nearby galaxies Centaurus A and Fornax A were detected by IRAS (Table 2). The core mid-infrared concentration of Cen A is 10 percent and of Fornax A, non-detected with VISIR, less than percent.
4.1.2 No dust-enshrouded LEG/FR-IIs
Unlike other radio galaxies where the jet radiation extends to optical wavelengths, FR-II/LEG 3C15 does not have a bright, compact, optical nucleus. It is understood to be enshrouded in dust (Martel et al. 1999). However, our mid-infrared non-detection provides evidence of a lack of an nuclear infrared excess above the synchrotron fit (Fig. 4). 3C353 shows a peanut-shaped extended optical nucleus and it is suggested that it is bifurcated by a small-scale (300 parsec) dust lane or has a double nucleus (Martel et al. 1999; de Koff et al. 2000). Our mid-infrared non-detection suggests the latter, although it could be that the dust lane does not radiate in the mid-infrared. LEG 3C403.1 also shows no signs of any dust structures (Martel et al. 1999). The LEGs also have weak total mid-infrared luminositites. None of the galaxies were detected with IRAS at mid-infrared wavelengths, suggesting that this class of active galaxies contains little warm dust. Our findings are in agreement with a Spitzer IRS spectrum study, from which it is understood that it is very unlikely that FR-II/LEGs can be heavily obscured AGN (Hardcastle et al. 2009).
4.1.3 Mid-infrared weak HEGs
We detect two low-power sources, 3C98 and PKS2158380, that are enshrouded in dust and show high-excitation lines. The nuclei of these sources are mid-infrared weak, as defined by their luminosities erg s-1. This dividing line is set at half the luminosity of the weakest BLRG in the mid-infrared of our sample, Pictor A. The two galaxies contain a radio-weak core and a total radio power comparable to FR-Is, but have a FR-II radio morphology. In 3C98, an extended dust structure contributing 10 percent of the flux, is seen at a position angle (PA) of 170 degrees outwards to 400 pc. The optical nucleus of this galaxy is not detected (Chiaberge et al. 2002a), which is also indicative of a dusty nucleus. By comparing the nuclear mid-infrared radiation detected with VISIR to the total galaxy radiation with IRAS, the radiation is inferred to be entirely concentrated in the inner 400 pc (Table 2). In PKS2158380, an arc of extended emission, contributing only 4 percent of the VISIR flux, is detected 300 pc east of the nucleus. The mid-infrared core concentration of this galaxy is percent.
4.1.4 Two hidden quasars among the HEGs
Two sources among the high-excitation FR-II galaxies are as strong in the mid-infrared as the BLRGs, and therefore probably host hidden quasars. In the optical, these sources show multiple large dust-lanes 4-5 kpc in size. The mid-infrared strongest HEG, 3C327, shows a double dust disk north-west of the nucleus, and there is an indication of two elongated structures emerging from a possibly double nucleus (de Koff et al. 2000). Our VISIR image (Fig. 2) confirms the extended nature of the nucleus and we estimate its size to be 1.3 kpc in radius, with its major axis being along the north-west direction. This is rather large for a torus. It could well be that the dust is primarily heated by an extended large-scale emission region and that a torus is not present. Of the total mid-infrared radiation, 90 percent originates in this region. However, this source is very highly polarized in the UV (Kishimoto et al. 2001), which is expected for a hidden quasar.
The nucleus of the second brightest HEG in the mid-infrared, 3C403, displays compact dust emission. Of the total mid-infrared radiation, 50 percent originates in the inner 700 pc. On large scales, this radio galaxy does not exhibit a standard two-sided jet but two pairs of jets. This x-shape is understood to be produced by the coalescence of two supermassive black holes at the center. At a two-percent level of the peak, 2 mJy, we detect the basis of the most recently formed jet. This is apparent from our PSF-subtracted mid-infrared image, which shows a mid-infrared jet at a position angle of 70 degrees extending from 120 to 240 parsec away from the nucleus. On a parsec scale, this jet is seen in the radio at a PA of 73 degrees, the same angle as observed for the jet on large-scales by Tarchi et al. (2007). This inner jet is coincident in location and velocity with three water-masers. The same authors do not detect central molecular gas emission and state that this component should be of size 200 pc. The same size limit can be placed on the dust emission.
4.1.5 The extent of dust tori in BLRGs
The mid-infrared radiation within the inner 300 parsec of BLRG 3C120 of FR-I type is 80 percent of the total emitted. As explained later, its nature is most likely non-thermal. Contributing 5 percent of the VISIR flux, we detect an extended structure 200-250 parsec south of 3C120 at a position angle of 180 degrees. This is probably the outer extent of the dust torus surrounding the nucleus, viewed at grazing incidence. We detect only the southern emission, and assume that the extended dust is symmetric but just not detectable at this wavelength. In this picture, the torus is compact in the inner few parsecs, and inclined away from the observer such that optically the weak quasar is not obscured. Extending to hundreds of parsecs, the density and flux of the torus decrease rapidly. The angle of the inner VLBI radio jet is directed 255 degrees in the north to east direction (Kellermann et al. 1998). This is perpendicular to the dust structure.
In Pictor A, we detect an extended stucture 180-360 parsec in size at an position angle of 230 degrees, which also contributes 5 percent of the VISIR flux. The mid-infrared core concentration of this galaxy is 60 percent. The VLBI radio jet is oriented within its inner 5 parsec at an angle of 270 degrees, but after 7 parsec deflects to 310 degrees (Tingay et al. 2000) and has an inclination of 51 degrees. The outer edge of the central dust feature in 3C227 extends farther out, 360-540 parsec, at a PA of 30 degrees, contributing 6 percent of the flux. On larger scales, the jets are positioned at an angle of 89 degrees, while the direction of the inner jet is not known. We note that in large double-lobed sources the inner and outer jets are generally aligned. The mid-infrared core concentration of this galaxy is 10 percent. The extended emission in PKS141719 is probably mainly host galaxy dust, originating in star-forming regions. It extends to 2 kpc in a cone of 90 degrees from north to east and contributes 10 percent of the flux. The large-scale jet has a PA of 10 degrees (Antonucci 1985).
The mid-infrared radiation from the inner 800 parsec of 3C445, the strongest mid-infrared BLRG, is equal to the total 12 m radiation measured with IRAS. The outer edge of the torus in 3C445 is also the brightest in our sample of BLRGs. It emits 10 percent of the flux of the nucleus, extends out to about 350-460 parsecs, and is oriented at a position angle of 80 degrees. This is again orthogonal to the jet on large scales, which is oriented at an angle of 170 degrees (Leahy et al. 1997). Using other VISIR data of 3C445, we are able to construct a N-band spectral energy distribution and compare it with the low resolution IRS spectrum (see Fig. 9 in Horst et al. 2009). The IRS spectrum shows a weak and broad silicate feature, while the VISIR N-band spectrum rises slowly with wavelength and shows no sign of this silicate feature. From QSO IRS spectra, Schweitzer et al. (2008) infer extended silicate emission features, which they interpret as being associated with cool dust in the narrow line region (NLR). For 3C445, this would mean that these clouds originate outside the VISIR beam, 200 parsec away from the center. The extended emission that we detect with VISIR is the tip of the iceberg.
Overall, we detect two trends. Firstly, in only one out of five cases, 3C227, the detected outer edges of the dust torus are not oriented perpendicularly to the inner and large-scale jets. Secondly, we detect the outer edges of the tori on one side only. The emission is probably asymmetric because of the optical thickness.
| Class | VISIR | |||||||||
|---|---|---|---|---|---|---|---|---|---|---|
| Resolution | ||||||||||
| () | () | () | (parsec) | () | () | |||||
| (1) | (2) | (3) | (4) | (5) | (6) | (7) | (8) | (9) | (10) | (11) |
| All | 27 | 0.05540 | 40.17 | 41.59 | 1.92 | 42.94 | 450 | 42.5 | 8.5 | 4.1 |
| FR-I | 8 | 0.02332 | 39.34 | 40.83 | 1.48 | 41.97 | 180 | 41.8 | 8.8 | 5.1 |
| LEG | 6 | 0.09210 | 40.48 | 41.98 | 1.86 | 43.16 | 780 | 42.3 | 8.3 | 4.2 |
| HEG | 7 | 0.08147 | 39.55 | 41.59 | 2.20 | 43.13 | 680 | 42.5 | 8.5 | 4.1 |
| BLRG | 6 | 0.07101 | 40.44 | 42.13 | 1.89 | 44.18 | 590 | 45.1 | 8.5 | 1.7 |
| Source | ||||
| () | ||||
| (1) | (2) | (3) | (4) | (5) |
| 4C12.03 | 1.2 | 2.7 | ||
| 3C015 | 5.26 | 5.71 | 1.2 | 2.5 |
| 3C029 | 2.05 | 0.14 | 0.5 | 2.7 |
| 3C040 | 2.89 | 0.03 | 0.0 | |
| 3C078 | 3.38 | 0.25 | 0.0 | |
| Fornax A | 2.50 | 3.96 | 1.0 | |
| 3C093 | 1.7 | |||
| 3C098 | 1.57 | 1.01 | 2.0 | 2.0 |
| 3C105 | 2.93 | 0.12 | 1.0 | 2.1 |
| 3C120 | 0.4 | 2.4 | ||
| 3C135 | 1.8 | 1.5 | ||
| Pictor A | 1.86 | 0.19 | 0.2 | 2.4 |
| 3C198 | 2.72 | 10.4 | 1.9 | 2.0 |
| 3C227 | 6.18 | 2.51 | 1.7 | 2.2 |
| 3C270 | 1.35 | 12.4 | 0.0 | 1.8 |
| Centaurus A | 1.89 | 0.50 | 0.0 | 3.4 |
| PKS141719 | 2.2 | |||
| 3C317 | 2.53 | 0.69 | 0.0 | 2.2 |
| 3C327 | 2.0 | 2.5 | ||
| 3C353 | 1.83 | 2.73 | 0.0 | 3.0 |
| PKS183948 | 0.0 | |||
| 3C403 | 4.32 | 1.78 | 2.7 | 2.6 |
| 3C403.1 | ||||
| 3C424 | 1.0 | 2.8 | ||
| PKS2158380 | 2.0 | |||
| 3C445 | 2.2 | 2.5 | ||
| PKS235435 | 1.2 | 2.2 |
-
Column (2) The fitted curvature of the parabola. Column (3) Goodness of fit parameter, reduced -value, of the parabolic fit to the core spectral energy distribution data ranging from the radio to UV. Column (4) Logarithm of the thermal excess above the synchrotron fit. Column (5) Logarithm of ionization over mid-infrared emission strength.
| Source | Ref. | Ref. | |||
|---|---|---|---|---|---|
| () | () | ||||
| (1) | (2) | (3) | (4) | (5) | (6) |
| 4C12.03 | 42.0 | 6 | 8.5 | 9 | 4.6 |
| 3C015 | 42.8 | 1 | 8.8 | 4 | 4.1 |
| 3C029 | 42.3 | 3 | 9.1 | 3 | 4.9 |
| 3C040 | 41.5 | 3 | 7.9 | 2 | 4.5 |
| 3C078 | 43.5 | 3 | 8.9 | 3 | 3.5 |
| Fornax A | 41.1 | 5 | 8.4 | 1 | 5.4 |
| 3C093 | 45.3 | 3 | 9.5 | 6 | 2.3 |
| 3C098 | 41.5 | 1 | 7.9 | 8 | 4.5 |
| 3C105 | 43.6 | 5 | 7.8 | 10 | 2.3 |
| 3C120 | 45.3 | 4 | 7.4 | 8 | 0.2 |
| 3C135 | 43.2 | 1 | 8.5 | 7 | 3.4 |
| Pictor A | 44.3 | 3 | 8.7 | 6 | 2.5 |
| 3C198 | 43.9 | 1 | 8.1 | 4 | 2.3 |
| 3C227 | 44.9 | 3 | 8.9 | 6 | 2.1 |
| 3C270 | 40.4 | 3 | 8.6 | 3 | 6.3 |
| Centaurus A | 41.1 | 2 | 7.7 | 5 | 4.7 |
| PKS141719 | 45.3 | 3 | 8.3 | 6 | 1.1 |
| 3C317 | 42.4 | 3 | 9.5 | 3 | 5.2 |
| 3C327 | 42.4 | 1 | 9.1 | 4 | 4.8 |
| 3C353 | 41.4 | 1 | 7.6 | 4 | 4.3 |
| PKS183948 | 44.5 | 5 | 8.7 | 10 | 2.3 |
| 3C403 | 42.5 | 1 | 8.5 | 4 | 4.1 |
| 3C403.1 | 42.0 | 6 | 8.1 | 10 | 4.2 |
| 3C424 | 42.6 | 5 | 7.8 | 7 | 3.3 |
| PKS2158380 | 42.0 | 6 | 8.6 | 2 | 4.7 |
| 3C445 | 44.8 | 3 | 8.0 | 6 | 1.3 |
| PKS235435 | 42.0 | 7 | 9.2 | 10 | 5.3 |
-
Columns (2-3) Logarithm of bolometric luminosity from: 1=Marchesini et al. (2004), 2=Meisenheimer et al. (2007), 3=Sikora et al. (2007), 4=Woo & Urry (2002), 5=calculated from bolometric correction (Elvis et al. 1994; Marchesini et al. 2004) to optical nuclear luminosity (Tadhunter et al. 1993; Balmaverde & Capetti 2006), 6=upper limit from spectral energy distribution fit in Fig. 4 and 5. Columns (4-5) Logarithm of black hole mass from: 1=Balmaverde & Capetti (2006), 2=Bettoni et al. (2003), 3=Cao & Rawlings (2004), 4=Marchesini et al. (2004), 5=Neumayer et al. (2007), 6=Sikora et al. (2007), 7=Woo et al. (2005), 8=Woo & Urry (2002), 9=calculated from the velocity dispersion (Wold et al. 2007) using the correlation from Tremaine et al. (2002), 10=calculated from B- or V-band absolute magnitudes (Wall & Peacock 1985; Zirbel & Baum 1995) following the work of Marchesini et al. (2004). Column (6) Efficiency expressed in the logarithm of the bolometric to Eddington luminosity ratio.
4.2 The nature of the mid-infrared emission
We find that the sources in our sample span a range of three orders of magnitude in both core mid-infrared as well as in normalized radio core luminosity (Figs. 7a–d). These quantities are understood to reflect the relative importance of dust reradiating the accretion disk luminosity, assuming that all of the mid-infrared radiation traces the reradiated accretion disk luminosity, and jet beaming. Together with the core spectral energy distribution data (Figs. 3, 4, 5, and 6), we can examine this for each of the four radio galaxy types.
The radiative properties, as indicated by the nuclear mid-infrared power, vary between radio galaxy types and with the amount of radio emission. We find that in terms of both total radio power and nuclear mid-infrared power, FR-Is are the weakest, FR-II LEGs and HEGs are intermediate, and BLRGs are the strongest sources. The HEGs exhibit the largest spread in the infrared-radio plane. Their cores are among the mid-infrared weak and strong sources (Fig. 7a). We choose the division line between mid-infrared strong, hidden quasars and BLRGs, and weak, likely inactive, sources at erg s-1, which is half the luminosity of the weakest BLRG in the mid-infrared of our sample, Pictor A. This is four times lower than the dividing line that Ogle et al. (2006) adopt using the same criterium. This difference is probably caused by our sample being at lower redshifts and our data, of higher resolution, shows more spread in core flux concentration. While we observed thirteen LEGs and HEGs in total, four have upper limits just above the dividing line between weak and strong sources. We can make statements about hidden quasars and inactive nuclei on the basis of nine sources. Of the LEGs and HEGs, two out of nine (2214 percent) satisfy the criterion of being obscured quasars. These two, 3C327 and 3C403, are of the HEG type. They are as luminous in the mid-infrared as the BLRGs. The remaining 7814 percent of the LEG and HEG FR-IIs and all of the FR-I radio galaxies are mid-infrared weak. All the mid-infrared weak sources have total radio powers of erg s-1, while the mid-infrared strong sources have radio powers of erg s-1.
We proceed by investigating whether the mid-infrared weak galaxy nuclei are purely non-thermal. Figure 7b displays the mid-infrared strength versus the radio core strength of the sample nuclei. The 8 FR-I nuclei exhibit a large range of radio core powers, while we find that all of the 6 FR-II LEGs have high radio core powers. The 3 mid-infrared weak HEGs in our sample have intermediate core radio powers. We find that the nuclei of FR-Is and LEGs can be up to three orders of magnitude more powerful in the mid-infrared than in the radio, as can be seen from the dashed lines. FR-I and LEG nuclei follow a tighter relation in the radio-optical plane – they are one to two orders of magnitude more powerful in the optical than in the radio (Chiaberge et al. 1999, 2000) – indicating an at most small mid-infrared excess. The BLRGs and HEGs can be up to four orders of magnitude more powerful in the mid-infrared than in the radio, indicating a larger thermal excess.
To investigate the non-thermal and/or thermal nature of these galaxy nuclei further, we gathered from the literature core spectral energy data, ranging from the radio to the UV (Table 7). We used two methods to fit the non-infrared core data, where a mid-infrared excess above the fit could indicate additional thermal radiation by reradiation by circumnuclear dust. Firstly, 15 out of 27 galaxies have a large enough core data set, permitting us to fit a parabolic function to all, except the mid-infrared, core data, of the form
| (3) |
where is the of the peak power, is the of the peak frequency, and represents the curvature of the parabola (e.g. Landau et al. 1986; Andreani et al. 2002; Leipski et al. 2009). The values of the curvatures and the goodness of fit, as indicated by the reduced parameter, are listed in Table 4. Secondly, we fit the high frequency radio core data of all the galaxies, with a straight power-law synchrotron spectrum , similar in slope to the core spectrum of Cen A (Meisenheimer et al. 2007). This slope is slightly steeper than for the general FR-I population (Fig 3). A comparison of the two methods of fits shows that this power-law fit is also a good indicator for a non-thermal and/or thermal nature of the galaxy nuclei (Figs. 3, 4, 5 and 6). We note that the true slope of the power-law fit is not the relevant factor, since a flatter slope would only increase the mid-infrared excess and not change our overall conclusions. So, when there is enough core data we use the parabolic fit, otherwise we use the power-law fit to determine the mid-infrared excess (Table 4). Another caveat of this method could be the host galaxy contribution, but unless in the case of very contrived geometries the host galaxy contribution to the mid-infrared emission in the 0.40″ apertures is not expected to differ significantly between the four subsamples.
All eight FR-I sources clearly lack a thermal excess (Fig. 3) but do exhibit three orders of magnitude of scatter in the strength of their non-thermal radiation. Half (5018 percent) have the strength of Centaurus A, while 3/8 (3817 percent) are ten times brighter and 1/8 (1312 percent) is ten times weaker. Four of the sources have published Spitzer IRS spectra (Horst et al. 2009; Leipski et al. 2009), which support the non-thermal, PAH-free nature of the nuclei. An exception might be 3C270, for which an excess IRS mid-infrared radiation is argued to originate in 200K warm nuclear dust.
We find that two of the five LEG/FR-IIs, 3C353 and PKS183948, are definitely non-thermal in nature (Fig. 4). The other three, 3C15, 3C424, and 4C12.03 have VISIR upper limits that could conceivably represent a small mid-infrared excess. On the basis of its Spitzer IRS spectrum, 3C15 and 3C424 are argued to host larger amounts of thermal nuclear emission (Leipski et al. 2009). Out of the five LEGs, two LEGs are mid-infrared weak, while the other three are uncertain since they have upper limits above the dividing line between weak and strong sources. 3C353 has a non-thermal LEG nucleus with a synchrotron strength ten times brighter than Cen A. The non-thermal nucleus of PKS183948, is even a hundred times brighter.
Of the four HEGs with mid-infrared weak galaxy nuclei, we find that 3C105 is non-thermal in nature, 3C198 has an uncertain nature, while 3C98 and PKS2158380 definitely show a thermal excess of 100 times the synchrotron flux. 3C105 has a strong synchrotron core, ten times brighter than Cen A, while the synchrotron cores with a thermal excess are comparable to that of Cen A. Conform to expectation, the mid-infrared radiation of HEG 3C98, which shows a thermal excess, is entirely concentrated in the inner kpc (Sect. 4.1.4). For the other mid-infrared weak HEG, showing a thermal excess, PKS2158380, a lower limit of 20 percent on the mid-infrared core concentration can be set.
Most of the mid-infrared strong galaxy nuclei are thermal in nature. We find that HEG and BLRG nuclei are four orders of magnitude more powerful in the mid-infrared than in the radio (Fig. 7b). In the BLRG sample, 4/6 (6719 percent) show a mid-infrared, thermal excess of 100 times the synchrotron flux, as is apparent from the synchrotron spectrum fits to the core radio data (Figs. 5 and 6). As already noted in Sect. 4.1.5 for one of these galaxies, 3C445, the mid-infrared radiation is entirely concentrated in the inner kpc. For 2/6 (3319 percent) of the BLRGs, Pictor A and 3C120, the mid-infrared point is no stronger than the synchrotron spectrum. However, these two sources have non-thermal radiation luminosities a factor of a hundred higher than the FR-I radio galaxy Centaurus A, which could indicate that these sources are beamed towards us. Indeed 3C120 shows large-scale beaming, the core being much brighter than the extended radio emission. For Pictor A, the core fraction is much less. Only one other source in our sample, LEG PKS183948, also exhibits this bright non-thermal radiation, and has the highest core fraction of all the LEGs. Beaming of the central parsec core jet might be the explanation. The mid-infrared core concentration values of Pictor A and 3C120 are 60 and 80 percent, respectively. The two mid-infrared strong HEGs, 3C327 and 3C403, which presumably host hidden quasars as deduced from their thermal excess of 100 and 500 times the synchrotron flux, are found among sources with brighter synchrotron cores. As expected, the mid-infrared radiation of 3C327 is almost entirely concentrated within the inner 2 kpc, while for 3C403 half of the radiation originates in the inner kpc.
We find that FR-Is show a large scatter in core fraction, which to some extent reflects the orientation of the radio jet, while the FR-IIs have a smaller spread, especially the HEGs and BLRGs (Fig. 7c). Mid-infrared core strength normalized by total radio power does not correlate with the core fraction. The mid-infrared strong sources have intermediate core fractions compared to FR-Is and LEGs, which both exhibit large spreads in core fraction (Fig. 7d). This similarity in spread could indicate that LEGs also form part of the parent population of variable active nuclei with a beamed component close to the line of sight. This might not be the case for the mid-infrared weak HEGs. Their core fraction is similar to the mid-infrared strong HEGs and BLRGs.
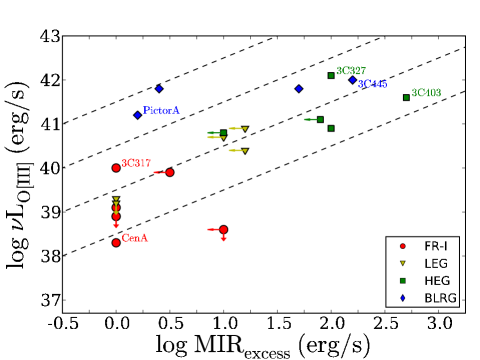
Normalising the emission-line luminosity by the mid-infrared strength, we find that this ratio does not vary much with radio galaxy type and is on average (Table 4). Similar values are found for Seyfert-1 and 2 galaxies (Haas et al. 2007). This would suggest that both the and mid-infrared emission are fairly reliable indicators of the AGN luminosity, despite the emission being affected by dust obscuration (Hes et al. 1993). A plot of the emission-line luminosity versus the mid-infrared excess determined from fits to the SEDs (Fig. 8) does show two orders of magnitude scatter in its relation. However, we discover one remarkable trend, namely that the mid-infrared weak HEGs have ratios () that are higher than for mid-infrared strong HEGs (-2.6), and both FR-Is and FR-II LEGs (-2.5). The explanation of this result could be simple: less dust produces less extinction towards the narrow line region.
5 Discussion
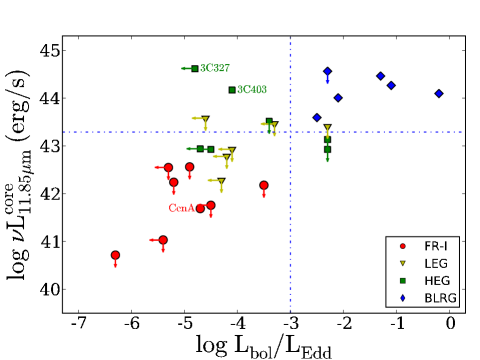
The inclusion of the mid-infrared points in the core spectral energy distributions has enabled us to discover that all the FR-I, all the FR-II LEG and a maximum of 3/7 (4319 percent) of the HEG nuclei are dominated by pure synchrotron radiation and lack dust re-radiation of the accretion disk. We consider the possible physical origin of this behaviour. Theoretically, it is predicted that the torus disappears at low efficiencies, calculated to be the ratio of bolometric to Eddington luminosity, (Elitzur 2008) and that the available accretion energy is transformed into jet power. This idea is supported by our results for the BLRGs in our sample, for which the bolometric luminosity is higher and the extended dust emission reaches farther out. To investigate this further, we plot the efficiency versus mid-infrared core power for the sample objects (Fig. 9). The relevant data are compiled in Table 5. We note that many of the bolometric luminosities are determined using a bolometric correction to the optical nuclear emission, using quasar SEDs. This is argued to be justifiable, even for FR-I and LEG FR-IIs (Marchesini et al. 2004), and is simply a rescaling of the blue continuum. Black hole masses are determined from velocity dispersions , using the relation of Tremaine et al. (2002), or inferred from optical absolute magnitudes using (Marchesini et al. 2004). All dust-tori-free FR-Is and all LEGs apart from one, PKS183948 with a likely beamed core, have low efficiencies. All BLRGs have high efficiencies. The HEGs are a mixed population with three types of nuclei: 1) objects with low efficiency with dust torus, 2) low efficiency and weak dust torus, and 3) high efficiency and weak dust torus. It will be interesting to investigate the host environment of a larger set of HEGs with VISIR data (cf. Tasse et al. 2008).
Dust-tori-free FR-Is are the least active () but their energy is not necessarily transformed into jet power. The most actively accreting FR-I, 3C78, has a synchrotron core ten times more powerful than that of Centaurus A. The FR-II LEGs of intermediate activity (), which also lack significant dust reradiation, have stronger synchrotron cores than the FR-Is, indicating that the accretion power is transformed into jet power. Alternatively, the available energy is tapped with negligible accretion (Begelman et al. 1984). On the other hand, as discussed in Sect. 4.2, the most active LEG PKS183948 possibly hosts a beamed central parsec core jet. The BLRGs, the most active accretors () in this sample indeed show thermal reradiation but have similar core jet powers as LEGs. They seem to host both dust tori and jets at the same time. The HEGs 3C105 and 3C198, with efficiencies as high as that of BLRGs lack or have weak dust tori. Among the HEGs, they are intermediate in total as well as in core radio and optical line emission strengths. The less active accretors, with tori that should have disappeared according to theory, are found in both the mid-infrared weak and strong regime. It is apparent that the mid-infrared strong sources, 3C327 and 3C403, have the most powerful radio lobes erg s-1, cores and optical line emission strengths of the HEGs. The mid-infrared weak sources, 3C98 and PKS2158380, are at the other end of this spectrum. In conclusion, our small sample study seems to indicate that the torus does not disappear at low efficiencies in HEGs with strong jets, but does so for FR-Is, LEGs, and mid-infrared weak HEGs.
The present study seems to indicate that the fraction of FR-IIs containing a dust torus covering a broad line region increases with redshift. This implies that the dust covering angle increases with redshift. The fraction of obscured radio galaxies between is percent, implying a viewing angle range of 0-45 degrees (Barthel 1989) of quasars. A mid-infrared study of a sample with quasars and radio galaxies including lower redshift sources () seem to indicate a lower fraction of obscured radio galaxies of 5015 percent (Meisenheimer et al. 2001; Ogle et al. 2006). This would suggest that the unification viewing angle of quasars should be increased to degrees, at least at lower luminosities. We note that since the subsamples presented here are small, the trends discovered are merely indicative. The drive to obtain a larger mid-infrared core sample study, especially of HEGs, is in place. Such a sample could play an important role in settling the question about the physical origin of dust tori.
6 Summary and conclusions
The main conclusions of our sub-arcsecond mid-infrared VISIR survey of the nuclei of 27 radio galaxies of various types are:
-
1.
On the basis of the core spectral energy distributions of our sample, we have found clear indications that many FR-I and several low-excitation FR-II and at maximum 4319 percent of the high-excitation FR-II radio galaxies have non-thermal nuclei, but lack dust tori.
-
2.
A circumnuclear dust disk is discovered, at a distance of 2-7 parsec from the center of Centaurus A at a position angle of 100 degrees, which contributes 6 percent of the flux.
-
3.
The extents of the dust tori around the naked nuclei of broad-line radio galaxies have been measured. In 4 out of 5 cases, these are directed perpendicular to the jet axis.
-
4.
The warm dust radiation in objects showing a thermal excess is almost entirely concentrated in the inner kpc.
-
5.
The number of mid-infrared weak sources among the FR-II radio galaxies, 7814 percent, at redshifts is not too different from the 5513 percent found by Ogle et al. (2006) at . Conversely, this indicates a hidden quasar fraction among FR-IIs of 2214 percent, compared to 4512 percent at redshifts 1.0.
-
6.
All FR-Is and all but one low-excitation FR-II galaxies contain nuclei with low efficiencies, . This suggests that the torus disappears at low efficiencies. High-excitation FR-II galaxies are a mixed population, having three types of nuclei: 1) low efficiency with dust torus, 2) low efficiency and weak dust torus, and 3) high efficiency and weak dust torus.
-
7.
The present and other mid-infrared studies seem to indicate that roughly 5015 percent of powerful radio galaxies at redshifts develop a nuclear broad line region with associated circumnuclear dust. This implies that the unification viewing angle range 0-45 degrees of quasars should be increased to 60 degrees, at least at lower luminosities.
Acknowledgements.
The paper benefitted from comments by the referee, Dr. R. R. J. Antonucci. The observations, on which this article is based, were made with the VISIR instrument mounted at the ESO telescope Melipal on Paranal Observatory under programs 075.B-0621, 076.B-0194, 077.B-0135 and 078.B-0020. We are grateful to the staff at Paranal for assisting with the observations. We would like to thank Drs. A.P. Verhoeff and Prof. Dr. K. Meisenheimer for observing on our behalf on respectively June 2nd and December 18th 2005. This research has made use of the NASA/IPAC Extragalactic Database (NED) which is operated by the Jet Propulsion Laboratory, California Institute of Technology, under contract with the National Aeronautics and Space Administration, and the VIZIER database at the CDS, Strasbourg, France.References
- Allen et al. (2002) Allen, M. G., Sparks, W. B., Koekemoer, A., et al. 2002, ApJS, 139, 411
- Andreani et al. (2002) Andreani, P., Fosbury, R. A. E., van Bemmel, I., & Freudling, W. 2002, A&A, 381, 389
- Antonucci (1985) Antonucci, R. R. J. 1985, ApJS, 59, 499
- Balmaverde & Capetti (2006) Balmaverde, B. & Capetti, A. 2006, A&A, 447, 97
- Balmaverde et al. (2006) Balmaverde, B., Capetti, A., & Grandi, P. 2006, A&A, 451, 35
- Barthel (1989) Barthel, P. D. 1989, ApJ, 336, 606
- Barthel (1994) Barthel, P. D. 1994, in Astronomical Society of the Pacific Conference Series, Vol. 54, The Physics of Active Galaxies, ed. G. V. Bicknell, M. A. Dopita, & P. J. Quinn, 175–
- Baum et al. (1992) Baum, S. A., Heckman, T. M., & van Breugel, W. 1992, ApJ, 389, 208
- Baum et al. (1995) Baum, S. A., Zirbel, E. L., & O’Dea, C. P. 1995, ApJ, 451, 88
- Becker et al. (2003) Becker, R. H., Helfand, D. J., White, R. L., Gregg, M. D., & Laurent-Muehleisen, S. A. 2003, VizieR Online Data Catalog, 8071, 0
- Begelman et al. (1984) Begelman, M. C., Blandford, R. D., & Rees, M. J. 1984, Reviews of Modern Physics, 56, 255
- Bettoni et al. (2003) Bettoni, D., Falomo, R., Fasano, G., & Govoni, F. 2003, A&A, 399, 869
- Black et al. (1992) Black, A. R. S., Baum, S. A., Leahy, J. P., et al. 1992, MNRAS, 256, 186
- Bogers et al. (1994) Bogers, W. J., Hes, R., Barthel, P. D., & Zensus, J. A. 1994, A&AS, 105, 91
- Boyce et al. (1996) Boyce, P. J., Disney, M. J., Macchetto, F., et al. 1996, A&A, 305, 715
- Burgess & Hunstead (2006) Burgess, A. M. & Hunstead, R. W. 2006, AJ, 131, 100
- Buttiglione et al. (2009) Buttiglione, S., Capetti, A., Celotti, A., et al. 2009, A&A, 495, 1033
- Cao & Rawlings (2004) Cao, X. & Rawlings, S. 2004, MNRAS, 349, 1419
- Capetti et al. (2000) Capetti, A., Trussoni, E., Celotti, A., Feretti, L., & Chiaberge, M. 2000, MNRAS, 318, 493
- Chiaberge et al. (1999) Chiaberge, M., Capetti, A., & Celotti, A. 1999, A&A, 349, 77
- Chiaberge et al. (2000) Chiaberge, M., Capetti, A., & Celotti, A. 2000, A&A, 355, 873
- Chiaberge et al. (2002a) Chiaberge, M., Capetti, A., & Celotti, A. 2002a, A&A, 394, 791
- Chiaberge et al. (2003) Chiaberge, M., Gilli, R., Macchetto, F. D., Sparks, W. B., & Capetti, A. 2003, ApJ, 582, 645
- Chiaberge et al. (2002b) Chiaberge, M., Macchetto, F. D., Sparks, W. B., et al. 2002b, ApJ, 571, 247
- Cleary et al. (2007) Cleary, K., Lawrence, C. R., Marshall, J. A., Hao, L., & Meier, D. 2007, ApJ, 660, 117
- Cohen et al. (1999) Cohen, M., Walker, R. G., Carter, B., et al. 1999, AJ, 117, 1864
- Costero & Osterbrock (1977) Costero, R. & Osterbrock, D. E. 1977, ApJ, 211, 675
- Das et al. (2005) Das, M., Vogel, S. N., Verdoes Kleijn, G. A., O’Dea, C. P., & Baum, S. A. 2005, ApJ, 629, 757
- de Koff et al. (2000) de Koff, S., Best, P., Baum, S. A., et al. 2000, ApJS, 129, 33
- Dennett-Thorpe et al. (2000) Dennett-Thorpe, J., Barthel, P. D., & van Bemmel, I. M. 2000, A&A, 364, 501
- Dicken et al. (2008) Dicken, D., Tadhunter, C., Morganti, R., et al. 2008, ApJ, 678, 712
- Ekers et al. (1989) Ekers, R. D., Wall, J. V., Shaver, P. A., et al. 1989, MNRAS, 236, 737
- Elitzur (2008) Elitzur, M. 2008, New Astronomy Review, 52, 274
- Elitzur & Shlosman (2006) Elitzur, M. & Shlosman, I. 2006, ApJ, 648, L101
- Elvis et al. (1994) Elvis, M., Wilkes, B. J., McDowell, J. C., et al. 1994, ApJS, 95, 1
- Eracleous & Halpern (2003) Eracleous, M. & Halpern, J. P. 2003, ApJ, 599, 886
- Fabbiano et al. (1994) Fabbiano, G., Fassnacht, C., & Trinchieri, G. 1994, ApJ, 434, 67
- Fanaroff & Riley (1974) Fanaroff, B. L. & Riley, J. M. 1974, MNRAS, 167, 31P
- Ferrarese et al. (1996) Ferrarese, L., Ford, H. C., & Jaffe, W. 1996, ApJ, 470, 444
- Fosbury et al. (1982) Fosbury, R. A. E., Boksenberg, A., Snijders, M. A. J., et al. 1982, MNRAS, 201, 991
- Giovannini et al. (1988) Giovannini, G., Feretti, L., Gregorini, L., & Parma, P. 1988, A&A, 199, 73
- Golombek et al. (1988) Golombek, D., Miley, G. K., & Neugebauer, G. 1988, AJ, 95, 26
- Gorjian et al. (2004) Gorjian, V., Werner, M. W., Jarrett, T. H., Cole, D. M., & Ressler, M. E. 2004, ApJ, 605, 156
- Granato et al. (1997) Granato, G. L., Danese, L., & Franceschini, A. 1997, ApJ, 486, 147
- Grandi & Osterbrock (1978) Grandi, S. A. & Osterbrock, D. E. 1978, ApJ, 220, 783
- Haas et al. (2004) Haas, M., Müller, S. A. H., Bertoldi, F., et al. 2004, A&A, 424, 531
- Haas et al. (2007) Haas, M., Siebenmorgen, R., Pantin, E., et al. 2007, A&A, 473, 369
- Hardcastle et al. (1998) Hardcastle, M. J., Alexander, P., Pooley, G. G., & Riley, J. M. 1998, MNRAS, 296, 445
- Hardcastle et al. (1999) Hardcastle, M. J., Alexander, P., Pooley, G. G., & Riley, J. M. 1999, MNRAS, 304, 135
- Hardcastle et al. (2009) Hardcastle, M. J., Evans, D. A., & Croston, J. H. 2009, MNRAS, 396, 1929
- Hardcastle et al. (2007) Hardcastle, M. J., Kraft, R. P., Sivakoff, G. R., et al. 2007, ApJ, 670, L81
- Hardcastle et al. (2003) Hardcastle, M. J., Worrall, D. M., Birkinshaw, M., & Canosa, C. M. 2003, MNRAS, 338, 176
- Hawarden et al. (1993) Hawarden, T. G., Sandell, G., Matthews, H. E., et al. 1993, MNRAS, 260, 844
- Hes et al. (1993) Hes, R., Barthel, P. D., & Fosbury, R. A. E. 1993, Nature, 362, 326
- Hes et al. (1996) Hes, R., Barthel, P. D., & Fosbury, R. A. E. 1996, A&A, 313, 423
- Hes et al. (1995) Hes, R., Barthel, P. D., & Hoekstra, H. 1995, A&A, 303, 8
- Hine & Longair (1979) Hine, R. G. & Longair, M. S. 1979, MNRAS, 188, 111
- Ho et al. (1997) Ho, L. C., Filippenko, A. V., & Sargent, W. L. W. 1997, ApJS, 112, 315
- Horst et al. (2009) Horst, H., Duschl, W. J., Gandhi, P., & Smette, A. 2009, A&A, 495, 137
- Jackson & Rawlings (1997) Jackson, N. & Rawlings, S. 1997, MNRAS, 286, 241
- Jaffe et al. (1993) Jaffe, W., Ford, H. C., Ferrarese, L., van den Bosch, F., & O’Connell, R. W. 1993, Nature, 364, 213
- Jetha et al. (2006) Jetha, N. N., Hardcastle, M. J., & Sakelliou, I. 2006, MNRAS, 368, 609
- Jones & Wehrle (1997) Jones, D. L. & Wehrle, A. E. 1997, ApJ, 484, 186
- Jones et al. (2000) Jones, D. L., Wehrle, A. E., Meier, D. L., & Piner, B. G. 2000, ApJ, 534, 165
- Kellermann et al. (1998) Kellermann, K. I., Vermeulen, R. C., Zensus, J. A., & Cohen, M. H. 1998, AJ, 115, 1295
- Kishimoto et al. (2001) Kishimoto, M., Antonucci, R., Cimatti, A., et al. 2001, ApJ, 547, 667
- Krolik & Begelman (1988) Krolik, J. H. & Begelman, M. C. 1988, ApJ, 329, 702
- Lagage et al. (2004) Lagage, P. O., Pel, J. W., Authier, M., et al. 2004, The Messenger, 117, 12
- Laing (1994) Laing, R. A. 1994, in Astronomical Society of the Pacific Conference Series, Vol. 54, The Physics of Active Galaxies, ed. G. V. Bicknell, M. A. Dopita, & P. J. Quinn, 227–
- Laing et al. (1994) Laing, R. A., Jenkins, C. R., Wall, J. V., & Unger, S. W. 1994, in Astronomical Society of the Pacific Conference Series, Vol. 54, The Physics of Active Galaxies, ed. G. V. Bicknell, M. A. Dopita, & P. J. Quinn, 201–
- Landau et al. (1986) Landau, R., Golisch, B., Jones, T. J., et al. 1986, ApJ, 308, 78
- Lauer et al. (2005) Lauer, T. R., Faber, S. M., Gebhardt, K., et al. 2005, AJ, 129, 2138
- Lawrence (1991) Lawrence, A. 1991, MNRAS, 252, 586
- Leahy et al. (1997) Leahy, J. P., Black, A. R. S., Dennett-Thorpe, J., et al. 1997, MNRAS, 291, 20
- Leahy & Perley (1991) Leahy, J. P. & Perley, R. A. 1991, AJ, 102, 537
- Leipski et al. (2009) Leipski, C., Antonucci, R., Ogle, P., & Whysong, D. 2009, ApJ, 701, 891
- Madrid et al. (2006) Madrid, J. P., Chiaberge, M., Floyd, D., et al. 2006, ApJS, 164, 307
- Maoz et al. (2005) Maoz, D., Nagar, N. M., Falcke, H., & Wilson, A. S. 2005, ApJ, 625, 699
- Marchesini et al. (2004) Marchesini, D., Celotti, A., & Ferrarese, L. 2004, MNRAS, 351, 733
- Marconi et al. (2000) Marconi, A., Schreier, E. J., Koekemoer, A., et al. 2000, ApJ, 528, 276
- Martel et al. (1999) Martel, A. R., Baum, S. A., Sparks, W. B., et al. 1999, ApJS, 122, 81
- Meisenheimer et al. (2001) Meisenheimer, K., Haas, M., Müller, S. A. H., et al. 2001, A&A, 372, 719
- Meisenheimer et al. (2007) Meisenheimer, K., Tristram, K. R. W., Jaffe, W., et al. 2007, A&A, 471, 453
- Mirabel et al. (1999) Mirabel, I. F., Laurent, O., Sanders, D. B., et al. 1999, A&A, 341, 667
- Morganti et al. (1993) Morganti, R., Killeen, N. E. B., & Tadhunter, C. N. 1993, MNRAS, 263, 1023
- Morganti et al. (1997) Morganti, R., Oosterloo, T. A., Reynolds, J. E., Tadhunter, C. N., & Migenes, V. 1997, MNRAS, 284, 541
- Moshir & et al. (1990) Moshir, M. & et al. 1990, in IRAS Faint Source Catalogue, version 2.0 (1990), 0–
- Nenkova et al. (2002) Nenkova, M., Ivezić, Ž., & Elitzur, M. 2002, ApJ, 570, L9
- Neumayer et al. (2007) Neumayer, N., Cappellari, M., Reunanen, J., et al. 2007, ApJ, 671, 1329
- Ogle et al. (2006) Ogle, P., Whysong, D., & Antonucci, R. 2006, ApJ, 647, 161
- Okuda et al. (2005) Okuda, T., Kohno, K., Iguchi, S., & Nakanishi, K. 2005, ApJ, 620, 673
- Pantin et al. (2005) Pantin, E., Lagage, P.-O., Claret, A., et al. 2005, The Messenger, 119, 25
- Perlman et al. (2007) Perlman, E. S., Mason, R. E., Packham, C., et al. 2007, ApJ, 663, 808
- Polletta et al. (2000) Polletta, M., Courvoisier, T. J.-L., Hooper, E. J., & Wilkes, B. J. 2000, A&A, 362, 75
- Quillen et al. (2003) Quillen, A. C., Almog, J., & Yukita, M. 2003, AJ, 126, 2677
- Rejkuba (2004) Rejkuba, M. 2004, A&A, 413, 903
- Ricci et al. (2006) Ricci, R., Prandoni, I., Gruppioni, C., Sault, R. J., & de Zotti, G. 2006, A&A, 445, 465
- Saikia et al. (1986) Saikia, D. J., Subrahmanya, C. R., Patnaik, A. R., et al. 1986, MNRAS, 219, 545
- Schwartz et al. (1991) Schwartz, D. A., Bradt, H. V., Remillard, R. A., & Tuohy, I. R. 1991, ApJ, 376, 424
- Schweitzer et al. (2008) Schweitzer, M., Groves, B., Netzer, H., et al. 2008, ApJ, 679, 101
- Shi et al. (2006) Shi, Y., Rieke, G. H., Hines, D. C., et al. 2006, ApJ, 653, 127
- Siebenmorgen et al. (2004a) Siebenmorgen, R., Freudling, W., Krügel, E., & Haas, M. 2004a, A&A, 421, 129
- Siebenmorgen et al. (2004b) Siebenmorgen, R., Krügel, E., & Spoon, H. W. W. 2004b, A&A, 414, 123
- Sikora et al. (2007) Sikora, M., Stawarz, Ł., & Lasota, J.-P. 2007, ApJ, 658, 815
- Simpson et al. (1996) Simpson, C., Ward, M., Clements, D. L., & Rawlings, S. 1996, MNRAS, 281, 509
- Singal (1993) Singal, A. K. 1993, MNRAS, 262, L27
- Spergel et al. (2007) Spergel, D. N., Bean, R., Doré, O., et al. 2007, ApJS, 170, 377
- Tadhunter et al. (2007) Tadhunter, C., Dicken, D., Holt, J., et al. 2007, ApJ, 661, L13
- Tadhunter et al. (1993) Tadhunter, C. N., Morganti, R., di Serego-Alighieri, S., Fosbury, R. A. E., & Danziger, I. J. 1993, MNRAS, 263, 999
- Tarchi et al. (2007) Tarchi, A., Brunthaler, A., Henkel, C., et al. 2007, A&A, 475, 497
- Tasse et al. (2008) Tasse, C., Best, P. N., Röttgering, H., & Le Borgne, D. 2008, A&A, 490, 893
- Tingay et al. (1998) Tingay, S. J., Jauncey, D. L., Reynolds, J. E., et al. 1998, AJ, 115, 960
- Tingay et al. (2000) Tingay, S. J., Jauncey, D. L., Reynolds, J. E., et al. 2000, AJ, 119, 1695
- Tremaine et al. (2002) Tremaine, S., Gebhardt, K., Bender, R., et al. 2002, ApJ, 574, 740
- Trussoni et al. (2003) Trussoni, E., Capetti, A., Celotti, A., Chiaberge, M., & Feretti, L. 2003, A&A, 403, 889
- Trussoni et al. (1999) Trussoni, E., Vagnetti, F., Massaglia, S., et al. 1999, A&A, 348, 437
- Urry & Padovani (1995) Urry, C. M. & Padovani, P. 1995, PASP, 107, 803
- van Bemmel & Barthel (2001) van Bemmel, I. & Barthel, P. 2001, A&A, 379, L21
- Verdoes Kleijn et al. (2002) Verdoes Kleijn, G. A., Baum, S. A., de Zeeuw, P. T., & O’Dea, C. P. 2002, AJ, 123, 1334
- Wall & Peacock (1985) Wall, J. V. & Peacock, J. A. 1985, MNRAS, 216, 173
- Whysong & Antonucci (2004) Whysong, D. & Antonucci, R. 2004, ApJ, 602, 116
- Willott et al. (2000) Willott, C. J., Rawlings, S., Blundell, K. M., & Lacy, M. 2000, MNRAS, 316, 449
- Wold et al. (2007) Wold, M., Lacy, M., & Armus, L. 2007, A&A, 470, 531
- Woo & Urry (2002) Woo, J.-H. & Urry, C. M. 2002, ApJ, 579, 530
- Woo et al. (2005) Woo, J.-H., Urry, C. M., van der Marel, R. P., Lira, P., & Maza, J. 2005, ApJ, 631, 762
- Wright & Otrupcek (1996) Wright, A. E. & Otrupcek, R. 1996, VizieR Online Data Catalog, 8015, 0
- Zirbel & Baum (1995) Zirbel, E. L. & Baum, S. A. 1995, ApJ, 448, 521
Appendix A Core spectral energy distribution data
| Filter | Flux | Obs. Date | Ref. | |
|---|---|---|---|---|
| (m) | (mJy) | (yr,m,d) | ||
| 4C12.03 | ||||
| VISIR/SiC | 1.3e+01 | 3.1e+00 | 2006,06,18 | |
| 5GHz | 6.0e+04 | 7.4e+00 | 1989,03 | 24∗ |
| 1.5GHz | 2.0e+05 | 4.0e+00 | 1989,03 | 24 |
| 3C015 | ||||
| F702W | 7.0e-01 | 7.6e-03 | 1999,04 | 8 |
| VISIR/SiC | 1.3e+01 | 3.3e+00 | 2006,06,18 | |
| 22.4GHz | 1.3e+04 | 3.7e+01 | 2006,08 | 12 |
| 22GHz | 1.4e+04 | 1.8e+02 | 2002,03 | 32 |
| 18.5GHz | 1.6e+04 | 2.1e+02 | 2002,03 | 32 |
| 14.9GHz | 2.0e+04 | 3.2e+01 | 2006,08 | 12 |
| 8.35GHz | 3.6e+04 | 2.8e+01 | 1989-1991 | 17 |
| 5GHz | 6.0e+04 | 3.0e+02 | 1989 | 29 |
| 2.3GHz | 1.3e+05 | 2.4e+01 | 1994 | 30 |
| 1.4GHz | 2.1e+05 | 7.6e+02 | 1993,03 | 2 |
| 3C029 | ||||
| Rosat/PSPC | 1.2e-03 | 4.1e-05 | 1992 | 36 |
| F25SRF2 | 2.5e-01 | 1.1e-03 | 2000,06,08 | 9 |
| F702W | 7.0e-01 | 9.5e-03 | 1995,01,12 | 7 |
| F160W | 1.6e+00 | 7.1e-02 | 2004,12,04 | 26 |
| VISIR/SiC | 1.3e+01 | 3.8e+00 | 2006,12,27 | |
| 22GHz | 1.4e+04 | 9.1e+01 | 2002,3 | 32 |
| 18.5GHz | 1.6e+04 | 1.1e+02 | 2002,3 | 32 |
| 5GHz | 6.0e+04 | 9.3e+01 | 1989 | 29 |
| 2.3GHz | 1.3e+05 | 5.5e+01 | 1994 | 30 |
| 1.4GHz | 2.1e+05 | 4.0e+01 | 1993-2003 | 2 |
| 3C040 | ||||
| VISIR/SiC | 1.3e+01 | 3.8e+00 | 2006,12,27 | |
| 22GHz | 1.4e+04 | 1.5e+02 | 2002,3 | 32 |
| 18.5GHz | 1.6e+04 | 1.6e+02 | 2002,3 | 32 |
| 5GHz | 6.0e+04 | 1.0e+02 | 1989 | 29 |
| 4.85GHz | 6.2e+04 | 9.0e+01 | 1984 | 21 |
| 2.3GHz | 1.3e+05 | 7.9e+01 | 1994 | 30 |
| 1.4GHz | 2.1e+05 | 4.9e+01 | 93,03 | 2 |
| 3C078 | ||||
| Chandra | 4.5e-04 | 1.3e-04 | 2005,01 | 1 |
| BeppoSax | 1.2e-03 | 3.0e-04 | 1997,01,07 | 35 |
| F25QTZ | 2.5e-01 | 5.7e-02 | 2000,03,15 | 9 |
| F555W | 5.6e-01 | 3.2e-01 | 1996,09,16 | 7 |
| F702W | 7.0e-01 | 3.9e-01 | 1994,08,17 | 7 |
| F28X50LP | 7.2e-01 | 6.6e-01 | 2000,03,15 | 9 |
| VISIR/SiC | 1.3e+01 | 4.1e+00 | 2006,12,27 | |
| 345GHz | 8.7e+02 | 2.8e+02 | 2001,02,11 | 31 |
| 15GHz | 2.0e+04 | 6.9e+02 | 1982,06,18 | 33 |
| 5GHz2 | 6.0e+04 | 6.3e+02 | 1982,06,18 | 33 |
| 5GHz | 6.0e+04 | 9.6e+02 | 1989 | 29 |
| 2.3GHz | 1.3e+05 | 5.8e+02 | 1994 | 30 |
| 1.5GHz | 2.0e+05 | 7.5e+02 | 1982,06,18 | 33 |
| Fornax A | ||||
| F175W | 1.7e-01 | 6.3e-03 | 1992,02,01 | 14 |
| F480LP | 5.1e-01 | 7.9e-03 | 1992,02,02 | 14 |
| F555W | 5.6e-01 | 4.1e-02 | 1996-2006 | 25 |
| VISIR/SiC | 1.3e+01 | 9.3e+00 | 2006,12,27 | |
| 5GHz | 6.0e+04 | 2.6e+01 | 1989 | 29 |
| 2.3GHz | 1.3e+05 | 4.0e+00 | 1994 | 30 |
| 3C093 | ||||
| VISIR/SiC | 1.3e+01 | 5.3e+00 | 2006,12,27 | |
| 8.4GHz | 3.6e+04 | 3.9e+00 | 1991,12 | 4 |
| 5GHz | 6.0e+04 | 3.8e+00 | 1991,12 | 4∗ |
| 3C098 | ||||
| ROSAT | 1.2e-03 | 5.8e-03 | 1999 | 18 |
| F702W | 7.0e-01 | 2.6e-03 | 1999,04 | 8 |
| VISIR/SiC | 1.3e+01 | 2.0e+01 | 2005,12,18 | |
| 345GHz | 8.7e+02 | 2.4e+01 | 2001,02,11 | 31 |
| 8.35GHz | 3.6e+04 | 6.1e+00 | 1989-1991 | 17 |
| 5GHz | 6.0e+04 | 9.0e+00 | 1985,01 | 16 |
| 3C105 | ||||
| F160W | 1.6e+00 | 1.9e-02 | 2004,10,26 | 26 |
| VISIR/SiC | 1.3e+01 | 2.2e+00 | 2005,12,18 | |
| 22.4GHz | 1.3e+04 | 2.1e+01 | 2006,08 | 12 |
| 14.9GHz | 2.0e+04 | 2.0e+01 | 2006,08 | 12 |
| 8.35GHz | 3.6e+04 | 1.9e+01 | 1989-1991 | 17 |
| 5GHz | 6.0e+04 | 1.4e+01 | 1989 | 29 |
| 2.3GHz | 1.3e+05 | 1.9e+01 | 1994 | 30 |
| 3C120 | ||||
| VISIR/SiC | 1.3e+01 | 2.4e+02 | 2006,12,27 | |
| 5GHz | 6.0e+04 | 3.5e+03 | 1989 | 29 |
| 2.3GHz | 1.3e+05 | 2.7e+03 | 1994 | 30 |
| 3C135 | ||||
| F160W | 1.6e+00 | 1.2e-02 | 2005,04,08 | 26 |
| VISIR/SiC | 1.3e+01 | 4.1e+00 | 2006,12,27 | |
| 8.35GHz | 3.6e+04 | 1.0e+00 | 89,91 | 17 |
| 5GHz | 6.0e+04 | 4.6e+00 | 1993 | 37 |
| Pictor A | ||||
| VISIR/SiC | 1.3e+01 | 6.8e+01 | 2006,12,27 | |
| 22GHz | 1.4e+04 | 1.1e+03 | 2002,03 | 32 |
| 18.5GHz | 1.6e+04 | 7.8e+02 | 2002,03 | 32 |
| 5GHz | 6.0e+04 | 1.0e+03 | 1989 | 29 |
| 2.3GHz | 1.3e+05 | 7.5e+02 | 1994 | 30 |
| 3C198 | ||||
| F160W | 1.6e+00 | 1.9e-02 | 2005,05,03 | 26 |
| F25SRF2 | 2.5e-01 | 2.3e-02 | 2000,03,15 | 9 |
| F702W | 7.0e-01 | 5.4e-01 | 1999,4 | 8 |
| VISIR/SiC | 1.3e+01 | 4.3e+00 | 2006,12,27 | |
| 345GHz | 8.7e+02 | 2.0e+01 | 2001,02,11 | 31 |
| 5GHz | 6.0e+04 | 2.0e+00 | 1993-2003 | 3∗ |
| 1.4GHz | 2.1e+05 | 1.6e+00 | 1993-2003 | 2 |
| 3C227 | ||||
| F25SRF2 | 2.5e-01 | 1.3e-01 | 2000,01,27 | 9 |
| F702W | 7.0e-01 | 4.8e-01 | 1995,05,19 | 9 |
| F160W | 1.6e+00 | 7.2e-02 | 2005,03,28 | 26 |
| VISIR/SiC | 1.3e+01 | 2.9e+01 | 2006,12,27 | |
| 345GHz | 8.7e+02 | 2.1e+01 | 2001,02,11 | 31 |
| 22.4GHz | 1.3e+04 | 1.2e+01 | 2006,08 | 12 |
| 14.9GHz | 2.0e+04 | 1.4e+01 | 2006,08 | 12 |
| 8.35GHz | 3.6e+04 | 1.3e+01 | 1989-1991 | 17 |
| 5GHz | 6.0e+04 | 3.2e+01 | 1989 | 29 |
| 2.3GHz | 1.3e+05 | 1.2e+01 | 1994 | 30 |
| 3C270 | ||||
| Chandra | 4.5e-04 | 6.6e-05 | 2005,01 | 1 |
| Chandra | 2.0e-04 | 3.6e-05 | 2000,03,05 | 9 |
| F25SRF2 | 2.5e-01 | 2.1e-04 | 2000,03,05 | 9 |
| F547M | 5.5e-01 | 6.0e-03 | 1994,12,13 | 7 |
| F791W | 7.9e-01 | 1.1e-02 | 1994,12,13 | 7 |
| F110W | 1.1e+00 | 2.8e-04 | 1998,04,23 | 6 |
| F160W | 1.6e+00 | 1.0e-03 | 1998,04,23 | 6 |
| F205W | 2.0e+00 | 2.2e-03 | 1998,04,23 | 6 |
| L | 3.4e+00 | 1.2e+00 | 2000,03,21 | 31 |
| LW1 | 4.5e+00 | 7.0e+00 | 1996,07,02 | 31 |
| LW2 | 6.7e+00 | 1.0e+01 | 1996,07,02 | 31 |
| VISIR/SiC | 1.3e+01 | 2.3e+00 | 2006,06,18 | |
| LW3 | 1.4e+01 | 1.9e+01 | 1996,07,02 | 31 |
| 345GHz | 8.7e+02 | 1.7e+02 | 2001,02,11 | 31 |
| 43GHz | 7.0e+03 | 3.0e+02 | 1997,09,07 | 22 |
| 22GHz | 1.4e+04 | 1.6e+02 | 1997,09,07 | 22 |
| 8.4GHz | 3.6e+04 | 1.0e+02 | 1995,04,01 | 23 |
| 5GHz | 6.0e+04 | 3.1e+02 | 1989 | 29 |
| 2.3GHz | 1.3e+05 | 2.4e+02 | 1994 | 30 |
| 1.6GHz | 1.9e+05 | 1.0e+02 | 1995,04,01 | 23 |
| 1.4GHz | 2.1e+05 | 1.4e+02 | 1993,03 | 2 |
| Centaurus A | ||||
| WFPC2 | 8.1e-01 | 7.0e-03 | 1997.80 | 27 |
| NACO/1.28 | 1.3e+00 | 1.3e+00 | 2003.45 | 28 |
| F160W | 1.6e+00 | 4.8e+00 | 1997.69 | 27 |
| NACO/1.67 | 1.7e+00 | 4.5e+00 | 2003.45 | 28 |
| NACO/2.15 | 2.1e+00 | 3.4e+01 | 2004.25 | 28 |
| NICMOS/2.22 | 2.2e+00 | 4.2e+01 | 1997.61 | 27 |
| NACO/3.8 | 3.8e+00 | 2.0e+02 | 2003.36 | 28 |
| MIDI/8.3 | 8.3e+00 | 4.7e+02 | 2005.28 | 28 |
| MIDI/9.3 | 9.3e+00 | 2.8e+02 | 2005.28 | 28 |
| MIDI/10.4 | 1.0e+01 | 2.5e+02 | 2005.28 | 28 |
| MIDI/11.4 | 1.1e+01 | 4.3e+02 | 2005.28 | 28 |
| MIDI/12.6 | 1.3e+01 | 6.2e+02 | 2005.28 | 28 |
| VISIR/SiC | 1.3e+01 | 1.2e+03 | 2006,12,27 | |
| 667GHz | 4.5e+02 | 6.3e+03 | 1991.35 | 20 |
| 375GHz | 8.0e+02 | 8.5e+03 | 1991.35 | 20 |
| 270GHz | 1.1e+03 | 5.9e+03 | 2003.30 | 28 |
| 235GHz | 1.3e+03 | 5.8e+03 | 2003.18 | 28 |
| 150GHz | 2.0e+03 | 6.9e+03 | 2003.18 | 28 |
| 90GHz | 3.5e+03 | 8.6e+03 | 2003.18 | 28 |
| 22.2GHz | 1.4e+04 | 3.5e+03 | 1995.88 | 34 |
| 22GHz | 1.4e+04 | 6.6e+03 | 2002,03 | 32 |
| 18.5GHz | 1.6e+04 | 6.5e+03 | 2002,03 | 32 |
| 8.4GHz | 3.6e+04 | 2.4e+03 | 1996.22 | 34 |
| 5GHz | 6.0e+04 | 7.0e+03 | 1989 | 29 |
| 4.8GHz | 6.3e+04 | 1.2e+03 | 1993.13 | 34 |
| 2.3GHz | 1.3e+05 | 5.5e+03 | 1994 | 30 |
| 1.4GHz | 2.1e+05 | 5.7e+03 | 1993-2003 | 19 |
| PKS141719 | ||||
| VISIR/SiC | 1.3e+01 | 2.6e+01 | 2006,12,27 | |
| 5GHz | 6.0e+04 | 5.2e+00 | 1993 | 37 |
| 3C317 | ||||
| Chandra | 4.5e-04 | 2.3e-05 | 2005,01 | 1 |
| ROSAT/PSPC | 1.2e-03 | 4.6e-05 | 2000,09,03 | 36 |
| F210M | 2.2e-01 | 7.7e-04 | 1994,03,05 | 9 |
| F555W | 5.6e-01 | 1.5e-02 | 1997,10,18 | 7 |
| F702W | 7.0e-01 | 2.0e-02 | 1994,03,05 | 9 |
| F814W | 8.1e-01 | 2.1e-02 | 1997,10,18 | 7 |
| F160W | 1.6e+00 | 1.2e-01 | 1998 | 36 |
| VISIR/SiC | 1.3e+01 | 3.2e+00 | 2006,06,18 | |
| 345GHz | 8.7e+02 | 9.1e+01 | 2001,02,11 | 31 |
| 5GHz | 6.0e+04 | 3.9e+02 | 1989,09 | 29 |
| 2.3GHz | 1.3e+05 | 3.1e+02 | 1994 | 30 |
| 1.4GHz | 2.1e+05 | 5.0e+02 | 2 | |
| 3C327 | ||||
| VISIR/SiC | 1.3e+01 | 7.8e+01 | 2005,07,02 | |
| 22.4GHz | 1.3e+04 | 1.1e+01 | 2006,08 | 12 |
| 14.9GHz | 2.0e+04 | 1.5e+01 | 2006,08 | 12 |
| 8.35GHz | 3.6e+04 | 2.5e+01 | 89,91 | 17 |
| 5GHz | 6.0e+04 | 2.8e+01 | 1989 | 29 |
| 2.3GHz | 1.3e+05 | 3.2e+01 | 1994 | 30 |
| 1.4GHz | 2.1e+05 | 2.1e+01 | 1993,03 | 2 |
| 3C353 | ||||
| F702W | 7.0e-01 | 1.9e-03 | 1999,4 | 8 |
| F160W | 1.6e+00 | 2.0e-01 | 2004,09,09 | 26 |
| VISIR/SiC | 1.3e+01 | 4.5e+00 | 2005,07,02 | |
| 345GHz | 8.7e+02 | 7.4e+01 | 2001,02,11 | 31 |
| 22GHz | 1.4e+04 | 1.9e+02 | 2002,03 | 32 |
| 18.5GHz | 1.6e+04 | 1.5e+02 | 2002,03 | 32 |
| 8.4GHz | 3.6e+04 | 1.5e+02 | 1989-1991 | 17 |
| 5GHz | 6.0e+04 | 1.2e+02 | 1989 | 29 |
| 2.3GHz | 1.3e+05 | 7.8e+01 | 1994 | 30 |
| PKS183948 | ||||
| VISIR/SiC | 1.3e+01 | 4.1e+00 | 2006,06,18 | |
| 24GHz | 1.2e+04 | 1.0e+02 | 2006,07 | 12 |
| 22GHz | 1.4e+04 | 9.3e+01 | 2002,03 | 32 |
| 18.5GHz | 1.6e+04 | 2.0e+02 | 2002,03 | 32 |
| 18GHz | 1.7e+04 | 1.1e+02 | 2006,07 | 12 |
| 5GHz | 6.0e+04 | 1.6e+02 | 1991-1992 | 29 |
| 2.3GHz | 1.3e+05 | 1.3e+02 | 1994 | 30 |
| 3C403 | ||||
| F702W | 7.0e-01 | 6.5e-03 | 1999,04 | 8 |
| F160W | 1.6e+00 | 7.9e-02 | 2004,11,06 | 26 |
| VISIR/SiC | 1.3e+01 | 8.9e+01 | 2006,06,18 | |
| 22.4GHz | 1.3e+04 | 8.5e+00 | 2006,08 | 12 |
| 14.9GHz | 2.0e+04 | 2.0e+01 | 2006,08 | 12 |
| 8.35GHz | 3.6e+04 | 7.1e+00 | 1989-1991 | 17 |
| 5GHz | 6.0e+04 | 1.0e+01 | 1989 | 29 |
| 2.3GHz | 1.3e+05 | 2.4e+01 | 1994 | 30 |
| 3C403.1 | ||||
| VISIR/SiC | 1.3e+01 | 4.2e+00 | 2006,06,18 | |
| 3C424 | ||||
| F28X50LP | 7.0e-01 | 1.5e-02 | 2000,03,15 | 9 |
| VISIR/SiC | 1.3e+01 | 3.7e+00 | 2006,06,18 | |
| 8.4GHz | 3.6e+04 | 7.0e+00 | 1989-1991 | 17 |
| 5GHz | 6.0e+04 | 1.8e+01 | 3 | |
| PKS2158380 | ||||
| F130M | 1.3e+00 | 2.2e-02 | 1991,05,07 | 5 |
| VISIR/SiC | 1.3e+01 | 1.7e+01 | 2006,06,18 | |
| 5GHz | 6.0e+04 | 7.0e+00 | 1982 | 15 |
| 3C445 | ||||
| F702W | 7.0e-01 | 2.8e+00 | 1999,04 | 8 |
| F160W | 1.6e+00 | 2.1e-01 | 2005,06,24 | 26 |
| VISIR/SiC | 1.3e+01 | 1.9e+02 | 2005,07,02 | |
| 22.4GHz | 1.3e+04 | 1.6e+01 | 2006,08 | 12 |
| 22GHz | 1.4e+04 | 4.5e+01 | 2002,03 | 32 |
| 18.5GHz | 1.6e+04 | 3.9e+01 | 2002,03 | 32 |
| 14.9GHz | 2.0e+04 | 2.7e+01 | 2006,08 | 12 |
| 8.4GHz | 3.6e+04 | 8.4e+01 | 1989-1991 | 17 |
| 5GHz | 6.0e+04 | 8.6e+01 | 1989 | 29 |
| 2.3GHz | 1.3e+05 | 9.0e+01 | 1994 | 30 |
| 1.4GHz | 2.1e+05 | 6.9e+01 | 1993-2003 | 2 |
| PKS235435 | ||||
| VISIR/SiC | 1.3e+01 | 3.1e+00 | 2006,06,18 | |
| 5GHz | 6.0e+04 | 5.0e+00 | 1981 | 13 |
-
Column (5) References from: 1=Balmaverde et al. (2006), 2=Becker et al. (2003), 3=Black et al. (1992), 4=Bogers et al. (1994), 5=Boyce et al. (1996), 6=Capetti et al. (2000), 7=Chiaberge et al. (1999), 8=Chiaberge et al. (2000), 9=Chiaberge et al. (2002a), 10=Chiaberge et al. (2002b), 11=Chiaberge et al. (2003), 12=Dicken et al. (2008), 13=Ekers et al. (1989), 14=Fabbiano et al. (1994), 15=Fosbury et al. (1982), 16=Giovannini et al. (1988), 17=Hardcastle et al. (1998), 18=Hardcastle et al. (2003), 19=Hardcastle et al. (2007), 20=Hawarden et al. (1993), 21=Jetha et al. (2006), 22=Jones et al. (2000), 23=Jones & Wehrle (1997), 24=Lauer et al. (2005), 25=Leahy & Perley (1991), 26=Madrid et al. (2006), 27=Marconi et al. (2000), 28=Meisenheimer et al. (2007), 29=Morganti et al. (1993), 30=Morganti et al. (1997), 31=Quillen et al. (2003), 32=Ricci et al. (2006), 33=Saikia et al. (1986), 34=Tingay et al. (1998), 35=Trussoni et al. (1999), 36=Trussoni et al. (2003) and 37=Zirbel & Baum (1995).