Optical properties of UO2 and PuO2
Abstract
We perform first-principles calculations of electronic structure and optical properties for UO2 and PuO2 based on the density functional theory using the generalized gradient approximation (GGA)+U scheme. The main features in orbital-resolved partial density of states for occupied f and p orbitals, unoccupied d orbitals, and related gaps are well reproduced compared to experimental observations. Based on the satisfactory ground-state electronic structure calculations, the dynamical dielectric function and related optical spectra, i.e., the reflectivity, adsorption coefficient, energy-loss, and refractive index spectrum, are obtained. These results are consistent well with the attainable experiments.
pacs:
78.20.-e, 77.22.Ch, 71.20.-bI INTRODUCTION
Actinide dioxides (AnO2) have been attracted lots of attention due to their rich physical phenomena characterized by the complex nature of 5f electrons. Many experimental and theoretical works have been devoted to investigating the thermodynamical, electronic structural, and defect properties of AnO2 systems. Taking UO2 and PuO2 for example, their insulating ground states have been established experimentally r1 ; r2 and successfully predicted theoretically r3 ; r4 ; r5 ; r6 . When referring to insulators or semiconductors, one basic physical quantity of interest is their band gaps. If the band gap of UO2 or PuO2 can be comparable to semiconductors, one idea may occur to us that whether they can be applied extensively in the electronic and optoelectronic devices like semiconductors (Si, GaAs, and ZnO) or not. Recently, Meek et al. discussed the electronic properties of uranium dioxide and revealed the potential performance advantages of uranium dioxide as compared to conventional semiconductor materials r7 . Especially, the higher dielectric constant of UO2 makes it more suitable for making integrated circuits r7 . This may stimulate many studies of the optical properties for actinide dioxides in future.
Optical adsorption and reflectance spectra of semiconductors have been studied for several decades both experimentally and theoretically, whereas, similar works performed on actinide dioxides is still very scarce although they are necessary not only from the viewpoint of basic science but also from their technological importance in industries. Experimentally, Schoenes studied the incidence reflectivity of UO2 single crystals in the photon energy range of 0.03-13 eV, from which the complex dielectric function has been derived r8 . For PuO2, to our knowledge, no experimental optical data are available in literature. As for the theoretical investigations of optical spectrum of actinide dioxides, it is a great challenge to standard density functional theory that an accurate description of electronic structure for actinide oxides is hard to be achieved, which is indispensable to getting the correct optical spectrum. Conventional density functional schemes that apply the local density approximation (LDA) or the GGA underestimate the strong on-site Coulomb repulsion of the 5 electrons and consequently fail to capture the correlation-driven localization. Therefore, the 5 electrons in actinide oxides require special attention. One promising way to improve contemporary LDA and GGA approaches is to modify the intra-atomic Coulomb interaction through the so-called LDA+ or GGA+ approach, in which the underestimation of the intraband Coulomb interaction is corrected by the Hubbard parameter Ani1993 ; Sol1994 . Recently, the electronic structures of UO2 and PuO2 are correctly reproduced using LDA+U or GGA+U calculations r3 ; r4 ; r5 ; r6 . Therefore, based on the good performance of LDA/GGA+U approaches in describing the electronic structure of the systems containing 5f electrons, it is encouraging to investigate the optical spectra of them.
In this work, we used the GGA+U scheme to study the static and frequency-dependent dynamical dielectric response functions for UO2 and PuO2. Our present calculated band gap and high-frequency dielectric constant for UO2 are 2.3 eV and 5.53, which are in good agrement with the experimental values of about 2.1 eV and 5.1 observed in the optical spectra r8 , respectively. Furthermore, our calculated dielectric function exhibits the overall agreement with experimental result and the main peaks are well reproduced. The dielectric function and the consequent optical spectra for PuO2 are also calculated in the paper. In particular, the value of for PuO2 is predicted to be 6.21, a little larger than that for UO2. Considering the satisfactory calculations for UO2, we expect our predicted optical behavior for PuO2 can provide a useful reference for future experimental measurement.
II DETAILS OF CALCULATION
Our electronic structural and optical calculations are performed using the projector-augmented wave (PAW) method of Blöchl r111 , as implemented in the ab initio total-energy and molecular-dynamics program VASP (Vienna ab initio simulation program) r13 . PAW is an all-electron method that combines the accuracy of augmented-plane-wave methods with the efficiency of the pseudopotential approach. The PAW method is implemented in VASP with the frozen-core approximation. The exchange-correlation functional is used GGA of Perdew-Burke-Ernzerhof (PBE) formalism r14 . The 5f, 6s, 6p, 6d and 7s electrons of U and Pu as well as the oxygen 2s and 2p electrons are explicitly treated as valence electrons. The electron wave function is expanded in plane waves up to a cutoff energy of 500 eV. For the Brillouin zone integration, the centered 666 grid is adopted. 144 bands are used to get the dynamical dielectric function and a good convergence can be achieved. In order to perform the antiferromagnetic (AFM) phase calculations, we used the unit cell containing 12 atoms. The strong on-site Coulomb repulsion among the localized 5f electrons is described by using the formalism formulated by Dudarev et al. r15 . In this scheme, only the difference between the spherically averaged screened Coulomb energy U and the exchange energy J is important for the total LDA (GGA) energy functional. Thus, in the following we label them as one single effective parameter U for brevity. In our calculation, we use J=0.51 and 0.75 eV for the exchange energies of U and Pu, respectively, and the effective Hubbard U are 4.0 and 3 eV, which are close to the values used in other previous work r4 ; r5 .
As for the optical spectra calculations, we adopt two different methods to determine the macroscopic static dielectric constants using different approximations r17 . One method is using a summation over conduction band states and the other is using the linear response theory (density functional theory). For the latter, only the static ion-clamped dielectric matrix can be obtained and a summation over empty conduction band states is not required, whereas the former can calculate the frequency-dependent dynamic dielectric function after the electronic ground state has been obtained. The frequency-dependent imaginary part of the dielectric function is determined by a summation over empty states using the following equation r17 :
| (1) | |||||
where the indices and refer to conduction and valence band states respectively, and is the cell periodic part of the wavefunctions at the k-point k. The real part of the dielectric tensor is obtained by the usual Kramers-Kronig transformation
| (2) |
where P denotes the principle value.
The main optical spectra, such as the reflectivity R(), adsorption coefficient I(), energy-loss spectrum L(), and refractive index n(), all can be obtained from the dynamical dielectric response functions . The explicit expressions are given by
| (3) |
| (4) |
| (5) |
and
| (6) |
respectively.
III results and discussions
III.1 electronic structure and optical properties of UO2
| AnO2 | k-mesh | Nk(IBZ) | ||||
|---|---|---|---|---|---|---|
| UO2 | ||||||
| (121212) | 196 | 5.71 | 5.28 | 5.53 | 5.59 | |
| (888) | 75 | 5.71 | 5.28 | 5.53 | 5.59 | |
| (666) | 40 | 5.71 | 5.28 | 5.53 | 5.59 | |
| (666)MP | 18 | 5.71 | 5.28 | 5.53 | 5.59 | |
| PuO2 | ||||||
| (121212) | 196 | 6.38 | 5.94 | 6.21 | 6.23 | |
| (888) | 75 | 6.37 | 5.94 | 6.20 | 6.23 | |
| (666) | 40 | 6.37 | 5.94 | 6.21 | 6.23 | |
| (666)MP | 18 | 6.37 | 5.94 | 6.20 | 6.23 |
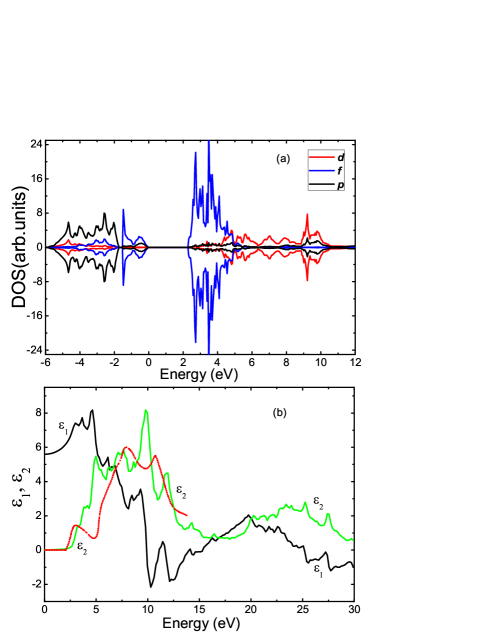

Since the optical spectra are directly calculated from interband transitions, an accurate description of the electronic structure is indispensable. The calculated orbital-resolved partial density of states (PDOS) for U 5f, U 6d and O 2p are shown in Fig. 1(a). The Fermi level is set to be zero. It is clearly shown that the valence bands are mainly contributed by U 5f and O 2p orbitals. The peak near the Fermi level is mainly U 5f with a little O 2p contribution, which bas been confirmed by the resonant photoemissionr18 . The U 5f valence band covers from 0 to 1.6 eV, which is also consistent with the experimental observation that the occupied 5f states in UO2 are located around 1.5 eV below the Fermi level with a band width of about 2.0 eV r18 . The O 2p valence band width is 4.0 eV from about 1.8 to 5.8 eV, in qualitative agreement with the photoemission value of 5.0 eV from 3.0 to from 8.0 eV r18 .
As for the unoccupied U 5f and 6d orbitals, their accurate descriptions are also indispensable to the interband transitions, since electrons are excited from the occupied valence bands to the unoccupied bands during optical excitations. The 5f and 6d bands begin at about 2.3 and 4 eV, respectively, which are consistent well with the results of 2.6 and 5 eV obtained by hybrid DFT method r19 . Note that our calculated p d gap is 5.8 eV, which accords well with the Bremsstrahlung Isochromat Spectroscopy (BIS) value of 5.00.4 eV r20 . Overall, our calculated DOS agrees well the experimental spectra and other theoretical results. This supplies the safeguard for our following optical spectrum calculations.
Due to the cubic symmetry of UO2, the dielectric tensor only has one independent component and ==. Our calculated macroscopic dielectric constants using different methods and approximations are collected in Table I. We find that well converged results can be obtained by using the -centered 666 grid. Note that the value of should be compared to experiment. For UO2, the calculated is 5.53, which agrees well with the experimental value of 5.1 r8 .
As for the dynamical dielectric function, our calculated imaginary part and real part of the complex dielectric function together with the corresponding experimental are showed in Fig. 1(b). The green and black lines represent our calculated imaginary and real parts of the complex dielectric function , respectively, while the red dotted-line gives the experimental measurement r8 of . Our theoretical photon energy covers from 0 to 30 eV, while the experimental r8 value covers from 0 to 13 eV. According to our calculated DOS showed in Fig. 1(a), we suggest that in the peaks (at 2.8 eV) below 3 eV should be assigned to the intra 5f transitions. Notice that the unoccupied 6d bands begin about at 4 eV, therefore, the 5f 6d transition energies should be larger than 4 eV. Kudin et al. also suggested that the stronger adsorption observed experimentally at 5-6 eV could be assigned to the optically allowed 5f 6d transitions r19 . According to our calculated , four main peaks lie at about 5.0, 7.1, 9.8, and 11.8 eV, respectively. The shape of the calculated curve exhibits the same main features demonstrated by the experimental results r8 . Combined with the orbital-resolved PDOS shown in Fig. 1(a), we attribute the first two peaks in to be 5f 6d transitions, while the last two to be 2p 6d transitions. This is consistent well with the experimental assignment r21 by Naegele et al., who attributed the peak around 3 eV in to intra 5f2 transitions, while the peak structures above 5 and 10 eV were ascribed to the f d and p d transitions, respectively. Another assignment was suggested by Schoenes according to their dielectric function deduced from the reflectivity measurement; they argued that the peaks near 3 and 6 eV correspond to f d transitions, and that the peaks near 8 and 11 eV are due to p d transitions r8 ; r23 . Herein, the assignment of f d transition at 3 eV in Ref. r8 ; r23 is not supported by our calculation. The cause is that in assigning the peak in at 3 eV, the energy distance between U occupied 5 and O 2 valence bands was overestimated in Ref. r8 ; r23 to be as large as 4 eV, which is much larger than that directly determined by the photoemission measurements r18 ; r24 ; r25 . On the contrary, according to our band-structure calculation, the occupied 5f orbitals are locate at about 1.5 eV below the Fermi level and the O 2 bands widely covers from about -1.8 to -5.8 eV, which instead accords well with the experimental photoemission data r18 ; r24 ; r25 in UO2. Thus, as mentioned above, we suggest the structure in below 3 eV is caused by the intra 5f transitions.
Using expressions (3)-(7), the reflectivity R(), adsorption coefficient I(), energy-loss L() and refractive index n() spectra are showed in Fig. 2. For reflectivity R() spectrum, there are four peaks locating at 4.8, 7.6, 10.3, and 12.8 eV. The adsorption coefficient I() spectrum has the same trends. The origin of these peaks can also be explained as the peaks of the imaginary part . Note that three similar peaks at 5.5, 8, 11.7 eV are also observed by the reflectance spectrum up to 13 eV at room temperature for UO2 r8 . The energy-loss L() spectrum can demonstrate not only one-particle excitations but also collective excitations. The maxima at around 15.4 eV as showed in Fig. 2(c) indicates the plasmon resonance, which is qualitatively consistent with the experimental value of 14 eV r23 . As showed in Fig. 1(b), at about 11.7 eV the real part becomes zero, arriving at the minima around 12.1 eV and then approaches zero at about 14 eV. As Schoenes pointed out, the energy at which crosses the zero line with a positive slop gives the plasmon excitation energy r23 .
III.2 electronic structure and optical properties of PuO2
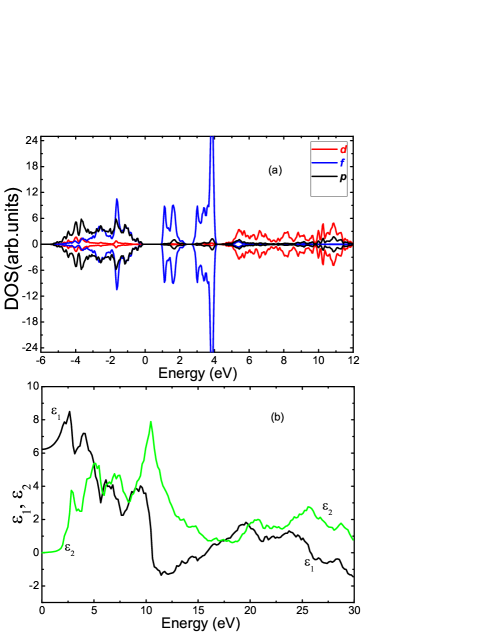
Due to Pu unique position of its 5f electrons between localized and delocalized states among actinide series, Pu metal and plutonium-based oxides have more complex properties than other actinides. For example, metallic Pu has six different phase under different temperatures and pressures r26 . PuO2 as an important actinide dioxide has extensive applications in nuclear reactor fuel and long-term storage of surplus plutonium. Therefore, the study of optical properties for PuO2 is also necessary and interesting. However, no experimental results of optical properties for PuO2 in literature are available. Recently, Butterfield et al. studied the photoemission behavior of surface oxides of -plutonium and they observed that two peaks characterized by Pu 5f and O 2p orbitals are dominant in PuO2 and Pu2O3 r27 . For PuO2, the two peaks observed are located at approximately 2.5 and 4.6 eV r27 , and our calculated DOS showed in Fig. 3(a) also present two similar peaks, i.e., a strong peak at about 1.6 eV and a weaker one at 3.7 eV. Overall, these features are well reflected in our PDOS showed in Fig. 3(a) compared to experimental observations. As for the unoccupied 6d states, no experimental data can be obtained. Our calculated unoccupied 6d states begin at about 5 eV. Considering the O 2p peak at 3.7 eV, we suggest the p d transitions occur at larger than 9 eV.
Our calculated macroscopic dielectric constant for PuO2 are also collected in Table I. The present is 6.21, whereas, no experimental value is unavailable at present. Our calculated imaginary part and real part of the complex dielectric function are showed in Fig. 3(b). For , four main peaks locate at 2.8, 5.1, 7.5, and 10.5 eV. According to our PDOS calculation showed in Fig. 3(a), we attribute the peak below 6 eV to be intra 5f transitions, and the last two to be f d and p d transitions, respectively. The two similar peaks at 7 and 10 eV are also obtained by Jomard et al. using ab initio calculations r28 .
Other related optical spectra for PuO2 are showed in Fig. 4. For reflectivity R() spectrum, there are four peaks at 2.8, 5.0, 7.5, and 10.6 eV. Similarly, four peaks at 3.0, 5.5, 7.6, 10.6 eV are also observed in the adsorption coefficient I() spectrum. The origin of these peaks can also be explained according to the structure displayed in the imaginary part of the dielectric function. It is evident that the plasmon excitation occurs at 16.0 eV, which is similar to the case of UO2 at 15.4 eV as mentioned above.

IV SUMMARY
In summary, we have performed a detailed investigation of the electronic structure and optical spectra of actinide dioxides UO2 and PuO2 using first-principle methods. For UO2, our calculated projected orbital-resolved PDOS for U 5f and O 2p orbitals in the valence region agree well with the experimental photoemission observation. As for the unoccupied states, our calculated p-d gap is 5.8 eV, similar to the experimental BIS value of 5.00.4 eV. The calculated insulating band gap and macroscopic static dielectric constants for UO2 are 2.3 eV and 5.53, respectively, which are also in good agrement with the experimental values of about 2.1 eV and 5.1. The main features in spectra for UO2 are also well reproduced by our calculated dynamical dielectric function compared to the experimental observation. For PuO2, the two main peaks characterized by Pu 5f and O 2p orbitals in valence bands are evidenced in our calculated PDOS, which accords well with the photoemission results. The calculated macroscopic static dielectric constants is 6.21. The related optical spectra for PuO2 are also obtained by calculating the dynamical dielectric function. The f d and p d transitions are found to occurr at 7.5 and 10.5 eV, respectively. Considering the satisfactory optical description for UO2 compared to experiments, we expect that these results for PuO2 are also reasonable and therefore can provide a useful reference for future experimental measurement.
Acknowledgements.
This work was supported by the Foundations for Development of Science and Technology of China Academy of Engineering Physics under Grant No. 2009B0301037.References
- (1) J. Faber, Jr., G. H. Lander, and B. R. Cooper, Phys. Rev. Lett. 35 1770 (1975).
- (2) C. E. McNeilly, J. Nucl. Mater. 11, 53 (1964).
- (3) H. Geng, Y. Chen, Y. Kaneta, and M. Kinoshita, Phys. Rev. B 77, 180101 (2008).
- (4) B. Sun, P. Zhang, and X.-G. Zhao, J. Chem. Phys. 128, 084705 (2008).
- (5) D. A. Andersson, J. Lezama, B. P. Uberuaga, C. Deo, and S. D. Conradson, Phys. Rev. B 79, 024110 (2009).
- (6) L. Petit, A. Svane, Z. Szotek, W. M. Temmerman, and G. M. Stocks, arXiv:0908.1806v1
- (7) T. Meek, M. Hu, and M. Haire, http://www.nuenergy.org/pdf/UO2semicond.pdf
- (8) J. Schoenes, J. Appl. Phys. 49, 1463 (1978).
- (9) V.I. Anisimov, I.V. Solovyev, M.A. Korotin, M.T. Czyżyk, and G.A. Sawatzky, Phys. Rev. B 48, 16929 (1993).
- (10) I.V. Solovyev, P.H. Dederichs, and V.I. Anisimov, Phys. Rev. B 50, 16861 (1994).
- (11) P.E.Blchl, Phys. Rev. B 50, 17953 (1994).
- (12) G. Kresse and J. Hafner, Phys. Rev. B 48, 13115 (1993).
- (13) J. P. Perdew, K. Burke, and M. Ernzerhof, Phys. Rev. Lett. 77, 3865 (1996).
- (14) S. L. Dudarev, G. A. Botton, S. Y. Savrasov, C. J. Humphreys, and A. P. Sutton, Phys. Rev. B 57, 1505 (1998).
- (15) M. Gajdo, K. Hummer, G. Kresse, J. Furthmller, and F. Bechstedt, Phys. Rev. B 73, 045112 (2006).
- (16) L. E. Cox, W. P. Ellis, R. D. Cowan, J.W. Allen, S.-J. Oh, I. Lindau, B. B. Pate, and A. J. Arko, Phys. Rev. B 35, 5761 (1987).
- (17) K. N. Kudin, G. E. Scuseria, and R. L. Martin, Phys. Rev. Lett. 89, 266402 (2002).
- (18) Y. Baer and J. Schoenes, Solid State Commun. 33, 885 (1980).
- (19) J. Naegele, L. Manes and U. Birkholz, Proc. 5th Int. Conf. Plutonium and other Actinides, ed. H.Blank and R. Lidner (North-Holland, Amsterdam, 1976), p. 393.
- (20) J. Schoenes, Phys. Rep. 63, 301 (1980).
- (21) J. Naegele, J. de Phys. C4, 169 (1979).
- (22) P.R. Norton, R.L. Tapping, D.K. Creber and W.J.L. Buyers, Phys. Rev. B 21, 2572 (1980).
- (23) K. T. Moore and G. van der Laan, Rev. Mod. Phys. 81, 235 (2009).
- (24) M. Butterfield, T. Durakiewicz, E. Guziewicz, J. Joyce, A. Arko, K. Graham, D. Moore, and L. Morales, Surf. Sci. 571, 74 (2004).
- (25) G. Jomard, B. Amadon, F. Bottin, and M. Torrent, Phys. Rev. B 78, 075125 (2008).