Single-Photon Imaging and Efficient Coupling to Single Plasmons
Abstract
We demonstrate strong coupling of single photons emitted by individual molecules at cryogenic and ambient conditions to individual nanoparticles. We provide images obtained both in transmission and reflection, where an efficiency greater than 55% was achieved in converting incident narrow-band photons to plasmon-polaritons (plasmons) of a silver nanoparticle. Our work paves the way to spectroscopy and microscopy of nano-objects with sub-shot noise beams of light and to triggered generation of single plasmons and electrons in a well-controlled manner.
pacs:
42.50.Ct, 42.50.Ar, 42.30.-d, 78.67.BfCoupling of light to dipolar radiators lies at the heart of light-matter interaction. Theoretical studies have predicted more than 80% extinction of a focused classical Gaussian beam by a single dipolar radiator Zumofen et al. (2008); Mojarad et al. (2009), and recent experimental investigations have reported up to 12% extinction of classical light by single quantum emitters Vamivakas et al. (2007); Wrigge et al. (2008a); Tey et al. (2008). Laboratory realizations of spectroscopy and microscopy on single nano-objects with single-photon illumination, however, have been confronted by obstacles. In particular, excitation of a quantum emitter by individual photons has only been possible in confined geometries Eschner et al. (2001); Rempe et al. (2007), and quantum optical imaging Kolobov (1999); Treps et al. (2002); Lugiato et al. (2002) of subwavelength structures has not been explored at the single-photon level. One bottle-neck in spectroscopy with single photons is access to bright, tunable, and narrow-band single-photon sources Lounis and Orrit (2005). Another challenge stems from the fundamental wave character of propagating photons which leads to a weak coupling with matter. In this Letter, we demonstrate more than 55% coupling between a diffraction-limited beam of single photons and single silver nanoparticles, which act as classical dipolar antennae. This strong photon-dipole coupling allows efficient excitation of single plasmon-polaritons (plasmons) Akimov et al. (2007); Tame et al. (2008) and imaging of nano-objects with nonclassical light.
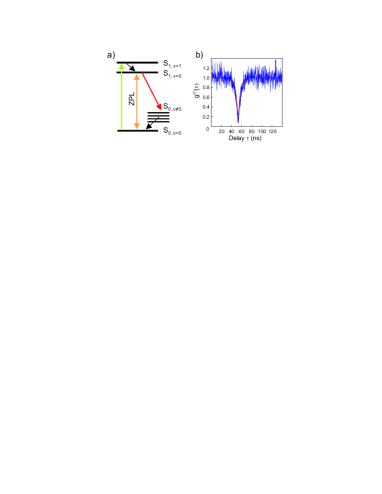
The source of single photons in our experiments is a single dye molecule embedded in an organic crystalline matrix. Figure 1a shows the energy level scheme of such a molecule as well as its excitation and fluorescence channels. We begin with experiments performed at K, where we used a tunable narrow-band dye laser to excite dibenzanthanthrene (DBATT) embedded in n-tetradecane on the transition at the wavelength of nm Lettow et al. (2007). This state rapidly decays to the state that has a lifetime of 9.5 ns determined by fluorescence to the states. By filtering the broad Stokes-shifted fluorescence to the manifold and collecting the emission on the zero-phonon line (ZPL), we obtained a source of single photons at nm with a lifetime-limited linewidth of 17 MHz Lettow et al. (2007). Figure 1b displays a recorded second-order autocorrelation function that proves the strongly photon-antibunched nature of this light. More details of the cryogenic setup and characterization of the single-photon source can be found in Ref. Lettow et al. (2007). Here, it suffices to point out that this narrow-band single-photon source delivers a high power of up to 500 fW, corresponding to about detected photons per second.
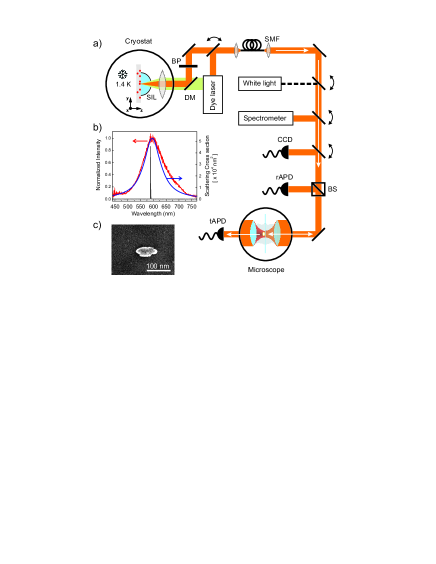
The collimated beam of single photons was coupled into a single-mode fiber and directed to a home-built microscope at room temperature as shown in Fig. 2a. An oil-immersion objective with a numerical aperture (NA) of 1.4 focused this light onto single silver nanoparticles with nominal diameter of 60 nm (British Biocell), which were spin coated on a glass cover slide and index-matched by immersion in oil (refractive index=1.49). Another microscope objective (NA=1.4) collected the transmitted light and sent it onto an avalanche photodiode (APD). A second APD was used to record the signal in reflection. In addition, we used flip mirrors to couple the light from the dye laser or a white-light source directly to the room-temperature microscope for characterization and diagnostics of the nanoparticles on the sample. By inserting a pinhole in the image plane, we could select each single particle and record its plasmon spectrum using a grating spectrometer.
The red trace in Fig. 2b plots the plasmon spectrum of a nanoparticle that matched our single photon source at nm indicated by the black curve. This spectrum corresponds to a prolate silver ellipsoid with a short axis of 46 nm and a long axis of 94 nm that is parallel to the substrate. We find good agreement with the results of calculations that considered a dipolar scatterer EPAPS and illumination parallel to the long axis of the particle (see blue curve of Fig. 2b). Indeed, electron microscopy revealed that the colloidal particles were mostly elongated (see Fig. 2c) with a notable variation in shape and size. We, thus, selected nanoparticles that matched the wavelength of our single-photon source (see Fig. 2b) and maximized the signal.
Figures 3a and b display images of a nanoparticle recorded simultaneously in transmission and reflection as the sample was scanned by a piezo-electric stage across the focus of the laser beam. The origin of these signals is scattering of the incident light from the nanoparticle Bohren and Huffman (1983), and the details of the contrast mechanism and the detection scheme are discussed in the literature Mikhailovsky et al. (2003); Lindfors et al. (2004). Here, we briefly highlight the interferometric character of the signal recorded on the detector, which is described as
| (1) |
where is the electric field of the scattered light at the detector position, and denotes the electric field of a “reference” beam. In case of the transmission signal, the reference is the incident light, whereas for the reflection signal, it is produced by a residual reflection of the illumination within the optical setup. Depending on the relation between and , the second or the third term of Eq. (1) might dominate and determine the signal contrast Lindfors et al. (2004). Furthermore, this is influenced by the scattering phase angle , which depends on the dielectric function of the nanoparticle at the illumination wavelength as well as its size and shape Lindfors et al. (2004).
Next, in Figs. 3d and e we present raster-scan images of the same single nanoparticle recorded under illumination by single photons. As shown by the two cross sections and in Fig. 3f, we find full width at half-maximum (FWHM) values of 300 nm and 260 nm in transmission and reflection images, respectively. The solid curves display the outcome of rigorous vectorial three-dimensional calculations EPAPS considering a focused Gaussian beam Mojarad et al. (2009). Here, the silver nanoparticle was modeled as a dipolar emitter, taking into account radiative and dynamic depolarization corrections Meier and Wokaun (1983). We found a good agreement between the theoretical predictions and the experimental results if we considered the polarizability corresponding to the scattering cross section reported in Fig. 2b EPAPS . A correction to the observed FWHM, , for the finite size of the nanoparticle could also be made according to where nm is the particle size along the scan direction, and is the FWHM calculated for a point dipole. However, this amounts to an adjustment of only 3 nm, which we have chosen to neglect here. We mention in passing that the appearance of the elliptical images in Figs. 3a,b,d,e is a well-known effect for tightly focused linearly-polarized light Richards and Wolf (1959). Another noteworthy point is that because of the nearly index-matched sample, the large cross section of the silver particle, and a tight focusing, the reflection signal is dominated by the second term of equation (1) and, therefore, maps the intensity of the incident beam in the focus spot. The transmission signal, on the other hand, has a substantial contribution from the interference term that depends on the electric field of the excitation light, which has a larger spatial extent than the intensity EPAPS . Indeed a comparison of the data in Figs. 3c and 3f reveals that the FWHMs in transmission are systematically wider than those in reflection images.
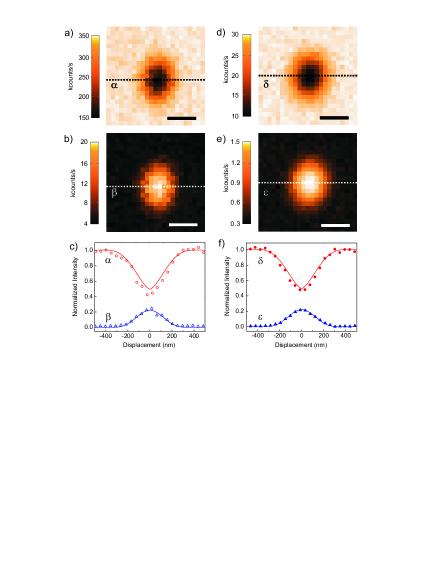
Tight focusing is key to achieving a strong coupling between a light field and a dipolar emitter Zumofen et al. (2008); Mojarad et al. (2009); Wrigge et al. (2008a). The cross sections in Fig. 3f reveal large extinction and reflection contrasts of 55% in transmission and 22% in reflection. This is in very good agreement with the rigorous vectorial calculations shown by the solid curves, which take into account the modal character of a Gaussian beam as well as the illumination and collection solid angles Zumofen et al. (2008).
The data presented above clearly show the large effect of a single dipolar oscillator on a propagating light beam. Given that the interaction of the incoming photons with the nanoparticle has been mediated by the excitation of its plasmon-polaritons, these results indicate a high probability that an incident photon excites a single plasmon Tame et al. (2008). To define an efficiency for the conversion of a photon to a plasmon, we add the probabilities that it is absorbed and scattered by the particle. In general, computation of this quantity from the reflection and transmission measurements requires a careful consideration of the incident focusing angle and the collection angle Zumofen et al. (2008); Mojarad et al. (2009). However, if , a simple argument based on energy conservation lets us conclude that the sum of the scattered and absorbed powers equals the power removed from the incident beam, which is directly read from the transmission dip. If , some of the light that is scattered at larger angles is also collected, which reduces the transmission dip. In our case, the illumination and collection microscope objectives were identical, but the former was not completely filled in order to minimize the loss of photons. Thus, the data in Fig. 3f yield a lower bound of 55% for the photon-plasmon conversion efficiency.
The two series of images in Fig. 3 acquired with laser light and a single photon source appear nearly identical. However, in the first case the signal can be described by the interference of classical fields, while the contrast mechanism of the images recorded by the latter can only be understood as the result of a Young-double-slit type of experiment for single photons Taylor (1909); Davis (1988). Here, the two interfering paths for each photon correspond to scattering by the nanoparticle and transmission without any interaction. After averaging the signal accumulated from a large number of single photons at each pixel, one retrieves the results familiar from classical optics.
We have demonstrated that a focused beam of single photons can be used to detect and image nanoparticles. This beam can also be produced in a triggered fashion by using a pulsed excitation of the molecule on the transition Ahtee et al. (2009). If the excitation beam is strong enough, one can ensure the production of a photon after each pulse, yielding an intensity-squeezed light source with a well-defined number of photons per unit time. Such a light source would allow the detection of objects with arbitrarily small optical contrast because it eliminates noise on the first term of Eq. (1) so that the second and third terms can be deciphered regardless of their magnitudes Lindfors et al. (2004); Lounis and Orrit (2005); Wrigge et al. (2008b). One should bear in mind, however, that any loss in the optical system reduces the degree of squeezing Kolobov (1999). In our experiment, the central source of loss has been the limited collection angle of the lens used behind the solid-immersion lens in the cryostat (see Fig. 2a). This can be substantially improved by employing different choices of lenses Koyama et al. (1999).
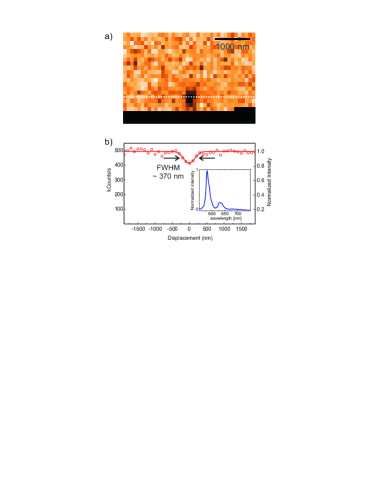
A second major cause for losses in the setup of Fig. 2a is the coupling into an optical fiber. To verify that use of a single mode and spatial mode filtering is not a strict requirement for the ability to focus single photons to the diffraction limit, we also performed free-beam measurements. Here, we collimated the single photon emission of a room-temperature terrylene molecule embedded in a thin para-terphenyl film Pfab et al. (2004); Lounis and Moerner (2000), and sent it directly to the second microscope as described earlier in Fig. 2a. Figure 4a displays an example of an image of a silver nanoparticle recorded in this fashion, while Fig. 4b shows a cross section from it. We find that the full width at half-maximum is as small as 370 nm note , demonstrating that freely propagating single photons can be indeed focused tightly. Here, the transmission dip amounts to only 15% because in this experiment we did not search for a nanoparticle with a plasmon resonance that matched the emission spectrum of terrylene. Moreover, the photon-plasmon coupling efficiency in this arrangement is less efficient than the narrow-band single photon source discussed earlier because the broad room-temperature emission of terrylene (see inset in Fig. 4b) does not fully overlap with the particle plasmon resonance.
Strong focusing of single photons demonstrated in this work opens doors to many interesting experiments where photons are to be managed with high efficiency and funneled to other quantum systems in the condensed phase. For example, one can use a silver nanoparticle as a nanoantenna Knight et al. (2007) to convert single propagating photons to single plasmons in nano-circuits. As opposed to the near-field coupling of photons from pre-positioned emitters to nanowires Akimov et al. (2007), coupling via propagating beams has the great advantage of being versatile with potential for broad-band communication because a large number of narrow-band single photon beams can be coupled simultaneously or sequentially via the same nano-antenna port. Plasmons can in turn generate electrons in a photovoltaic process where a quantum of excitation at optical frequencies gives birth to an electron Falk et al. (2009). These processes would offer interesting possibilities for quantum state engineering of hybrid systems. Another important promise of our work is in the detection and imaging of very small nanoparticles and single molecules Lindfors et al. (2004); Lounis and Orrit (2005); Kukura et al. (2009). To achieve this, we plan to optimize the use of solid-immersion lenses to reach collection efficiencies in excess of 90% Koyama et al. (1999), and thus produce an intensity-squeezed train of single photons from a single molecule.
We thank J. Hwang; N. Mojarad, and G. Zumofen for fruitful discussions. This work was funded by the Swiss National Science Foundation (SNF).
References
- Zumofen et al. (2008) G. Zumofen, N. M. Mojarad, V. Sandoghdar, and M. Agio, Phys. Rev. Lett. 101, 180404 (2008).
- Mojarad et al. (2009) N. Mojarad, G. Zumofen, V. Sandoghdar, and M. Agio, J. Euro. Opt. Soc. 4, 09014 (2009).
- Wrigge et al. (2008a) G. Wrigge, I. Gerhardt, J. Hwang, G. Zumofen, and V. Sandoghdar, Nature Phys. 4, 60 (2008a).
- Vamivakas et al. (2007) A. N. Vamivakas, et al., Nano Letters 7, 2892 (2007).
- Tey et al. (2008) M. K. Tey, et al. , Nature Phys. p. doi:10.1038/nphys1096 (2008).
- Eschner et al. (2001) J. Eschner, C. Raab, F. Schmidt-Kaler, and R. Blatt, Nature 413, 495 (2001).
- Rempe et al. (2007) G. Rempe, et al., in Coherence and Quantum Optics VIII, edited by N. P. Bigelow, J. H. Eberly, C. R. Stroud, and I. A. Walmsley (Kluwer Academic / Plenum Publishers, New York (2003), 2007), pp. 241–248.
- Kolobov (1999) M. I. Kolobov, Rev. Mod. Phys. 71, 1539 (1999).
- Treps et al. (2002) N. Treps, et al. , Phys. Rev. Lett. 88, 203601 (2002).
- Lugiato et al. (2002) L. Lugiato, A. Gatti, and E. Brambilla, J. Opt. B 4, S176 (2002).
- Lounis and Orrit (2005) B. Lounis and M. Orrit, Rep. Prog. Phys. 68, 1129 (2005).
- Akimov et al. (2007) A. V. Akimov, et al. , Nature 450, 402 (2007).
- Tame et al. (2008) M. S. Tame, et al. , Phys. Rev. Lett. 101, 190504 (2008).
- Lettow et al. (2007) R. Lettow, et al. , Opt. Express 15, 15842 (2007).
- (15) Supplementary materials
- Bohren and Huffman (1983) C. F. Bohren and D. R. Huffman, Absorption and Scattering of Light by Small Particles (John Wiley and Sons, 1983).
- Mikhailovsky et al. (2003) A. A. Mikhailovsky, M. A. Petruska, M. I. Stockman, and V. I. Klimov, Opt. Lett. 28, 1686 (2003).
- Lindfors et al. (2004) K. Lindfors, T. Kalkbrenner, P. Stoller, and V. Sandoghdar, Phys. Rev. Lett. 93, 037401 (2004).
- Meier and Wokaun (1983) M. Meier and A. Wokaun, Opt. Lett. 8, 581 (1983).
- Richards and Wolf (1959) B. Richards and E. Wolf, Proc. Roy. Soc. London Ser A 235, 358 (1959).
- Taylor (1909) G. I. Taylor, Proc. Cambridge Philos. Soc. 15, 114 (1909).
- Davis (1988) L. M. Davis, Phys. Rev. Lett. 60, 1258 (1988).
- Ahtee et al. (2009) V. Ahtee, et al. , J. Mod. Opt. 56, 161 (2009).
- Wrigge et al. (2008b) G. Wrigge, J. Hwang, I. Gerhardt, G. Zumofen, and V. Sandoghdar, Opt. Express 16, 17358 (2008b).
- Koyama et al. (1999) K. Koyama, M. Yoshita, M. Baba, T. Suemoto, and H. Akiyama, Appl. Phys. Lett. 75, 1667 (1999).
- Pfab et al. (2004) R. J. Pfab, J. Zimmermann, C. Hettich, I. Gerhardt, A. Renn, and V. Sandoghdar, Chem. Phys. Lett. 387, 490 (2004).
- Lounis and Moerner (2000) B. Lounis and W. E. Moerner, Nature 407, 491 (2000).
- (28) This value is larger than that expected from a simple estimate of the diffraction limit because of 1) the inherently larger FWHM that is obtained in transmission measurements and 2) the lower effective numerical aperture due a smaller beam diameter in this experiment.
- Knight et al. (2007) M. W. Knight, N. K. Grady, R. Bardhan, F. Hao, P. Nordlander, and N. J. Halas, Nano Lett. 8, 2346 (2007).
- Falk et al. (2009) A. L. Falk, et al. , Nature Phys. 5, 475 (2009).
- Kukura et al. (2009) P. Kukura, M. Celebrano, A. Renn, and V. Sandoghdar, Nano Lett. 9, 926 (2009).