Upflows in the upper transition region of the quiet Sun
Abstract
We investigate the physical meaning of the prominent blue shifts of Ne viii, which is observed to be associated with quiet-Sun network junctions (boundary intersections), through data analyses combining force-free-field extrapolations with EUV spectroscopic observations. For a middle-latitude region, we reconstruct the magnetic funnel structure in a sub-region showing faint emission in EIT-Fe 195. This funnel appears to consist of several smaller funnels that originate from network lanes, expand with height and finally merge into a single wide open-field region. However, the large blue shifts of Ne viii are generally not associated with open fields, but seem to be associated with the legs of closed magnetic loops. Moreover, in most cases significant upflows are found in both of the funnel-shaped loop legs. These quasi-steady upflows are regarded as signatures of mass supply to the coronal loops rather than the solar wind. Our observational result also reveals that in many cases the upflows in the upper transition region (TR) and the downflows in the middle TR are not fully cospatial. Based on these new observational results, we suggest different TR structures in coronal holes and in the quiet Sun.
Keywords:
Sun: corona–Sun: transition region–Sun: UV radiation–Sun: magnetic fields–Sun: solar wind:
96.60.Xy1 Introduction
It has well been established that the Ne viii (770.4 Å) line is on average blue shifted in coronal holes and the quiet Sun. This line is formed in the upper transition region (TR) and lower corona, and thus its Doppler shift is very useful to study TR dynamics and the solar wind origin. In coronal holes (CHs), the blue shift of Ne viii is believed to be an indicator of solar wind outflow (e.g., Hassler1999, ; Wilhelm2000, ; Tu2005a, ). Also in the quiet Sun, significant blue shifts of Ne viii were found at the network junctions and interpreted (Hassler1999, ) to be possible sources of the solar wind. This idea challenges the conventional notion that the solar wind originates from coronal holes. To help clarifying this issue we have, through data analyses combining force-free-field extrapolation with EUV spectroscopy, further studied the prominent blue shifts of Ne viii in the quiet Sun and investigated its physical meaning.
2 Observational result
The analyzed spectroscopic data were taken by SUMER (Solar Ultraviolet Measurements of Emitted Radiation) onboard SOHO (Solar and Heliospheric Observatory) in a middle-latitude quiet-Sun region, during the time from 00:40 to 08:15 UTC on 22 September 1996. The details of this observation can be found in Hassler1999 , Tu2005b , Dammasch1999 , and Tian2008a . A magnetogram taken by MDI (Michelson Doppler Imager) at 01:39 UTC, and an EIT (Extreme ultraviolet imaging telescope) image (Fe xii 19.5 nm) taken at 01:06 UTC on the same day were also used in our study.
The linear force-free-field model equations as proposed by Seehafer1978 were applied to construct the 3-D coronal magnetic field structure above the photosphere in this quiet region. As suggested by previous work (Tu2005b, ), a simple potential field seems appropriate for our data. Therefore, we used a coronal potential field.
2.1 Relationship between upflows and magnetic funnels
The quiet corona as imaged by EIT at 19.5 nm and shown in Fig. 1 reveals some bright emission features, which are known as EUV bright points, and some very dark emission patches. As noted by He2007 , one dark region is associated with open field lines. In Tian2008a it was further pointed out that these open field lines may correspond to coronal funnels.
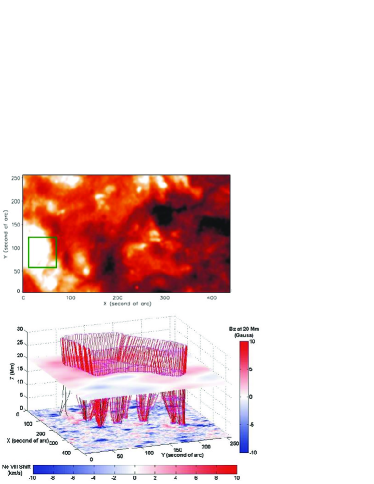
The lower panel of Fig. 1 shows the reconstructed magnetic funnels in the observed region. The funnel structure consists of two parts: below 20 Mm, there are several small funnels which originate in the photosphere and expand with height; above 20 Mm, these small funnels merge into a single wide open-field region. One may speculate that coronal funnel structures in CHs should be of a similar form.
However, a comparison of the Dopplergram of Ne viii with the 3-D funnel structures in fact reveals that most of the patches with significant Ne viii blue shifts do not coincide with the funnel legs. Thus, as argued before by Tian2008a , these sites might not be sources of the solar wind. On the other hand, it is possible that in the quiet-Sun region the layer where the solar wind outflow actually starts is located higher up than the source of the Ne viii emission. If this is the case, significant outflows could perhaps be found in the Dopplergram of another ion line that forms at a higher temperature than that of Ne viii.
2.2 Relationship between upflows and magnetic loops
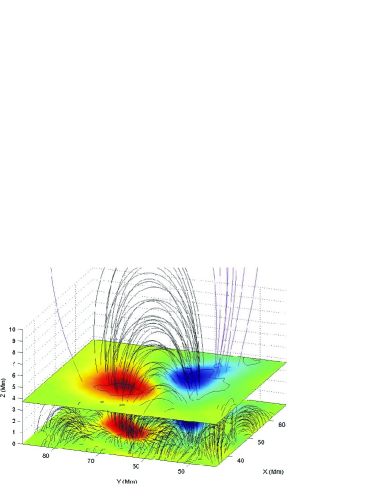
So far we have argued that the quiet-Sun coronal funnels are not associated with prominent outflows in the upper TR. On the contrary, the relationship is very clear between significant outflow and the related field lines being closed. As mentioned in Tian2008a , there are several magnetic loops revealing upflows in both legs, and some other loops with upflow in one yet downflow in the other leg.
More recently, the association of significant Ne viii blue shift with the loop legs has been further confirmed. In a new observation, Tian2009 found clearly that almost all of the patches with a significant blue shift on the Dopplergram of Ne viii coincided with legs of loops located at network intersections. Furthermore, we found that most of the blue-shift patches coincided with both legs of the magnetic loops, and some patches were associated with the common leg of several joint loops.
The 2-D illustration of such a relationship can be found in Tian2008a and Tian2009 . Here we present a 3-D illustration, which is given in Fig. 2. This reconstructed loop system is associated with an EUV bright point located on the eastern side of the FOV (field of view) shown in Fig. 1. The figure clearly reveals that both legs of the loop system are associated with upflows in the upper TR.
Since in the quiet Sun the blue shift of Ne viii has a closer relationship with coronal loops than with open field lines, we therefore suggest that the in the quiet Sun it is a signature of mass supply to coronal loops rather than a signature of solar wind origin.
2.3 Spatial correlation between upflows in the upper TR and downflows in the middle TR
It has been well established that the EUV lines formed in the (middle) TR are redshifted by a few km/s (e.g., PeterJudge1999, ; Xia2003, ; Curdt2008, ). Since the redshifts in the middle TR and the blueshifts in the upper TR are both strongest in the network, their relationship should be studied in detail. In the scenario of solar wind origin as suggested in Tu2005a , the simultaneously observed blue and red shifts were interpreted as upflow and downflow caused by magnetic reconnection between open field lines in coronal funnels and closed ones in adjacent loops.
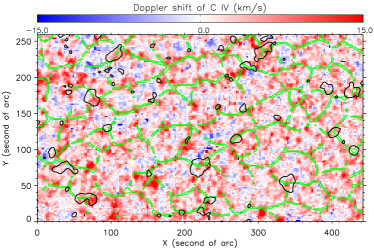
In the recent studies of Aiouaz2008 and Tian2008b , the spatial relationship between upflows in the upper TR and downflows in the middle TR was investigated. Through a statistical analysis Tian2008b , it was concluded that the blue shift of Ne viii tends to be strongest at the network center, while the location of the maximum red shift of C iv seems to deviate slightly from the network center.
Here we superpose the contours of strong Ne viii blue shifts on the Dopplergram of C iv, and show them in Fig. 3. The pattern of the chromospheric network, which was extracted from a Si ii intensity image and reproduced from the paper by Hassler1999 , is shown in green. This figure reveals a clear near-cospatiality of strong up and down flows. We further noticed that in many cases the prominent blue shifts do not fully coincide with but slightly deviate from the strongest red shifts of C iv. While in some other cases they strictly coincide.
Different mechanisms such as cooling of spicules, siphon flows through loops, downward propagation of MHD waves produced by nano-flares, and downflows resulting from reconnection all can cause red shifts of TR lines (PeterJudge1999, ; Tu2005a, ). If we assume that those strong red shifts of C iv which are almost cospatial with the prominent Ne viii blue shifts are mainly caused by magnetic reconnection between legs of large loops and cool side loops, then it is natural to see the near-cospatiality of strong up and down flows at different layers. However, it is unclear why in many cases the prominent blue shifts do not fully coincide with the strongest red shifts of C iv.
3 Magnetic structures of the transition region
Based on our recent observations of the quiet Sun and previous observational results for coronal holes, we conclude that the transition region consists of different magnetic structures in coronal holes than quiet Sun, as they are sketched in Fig. 4.
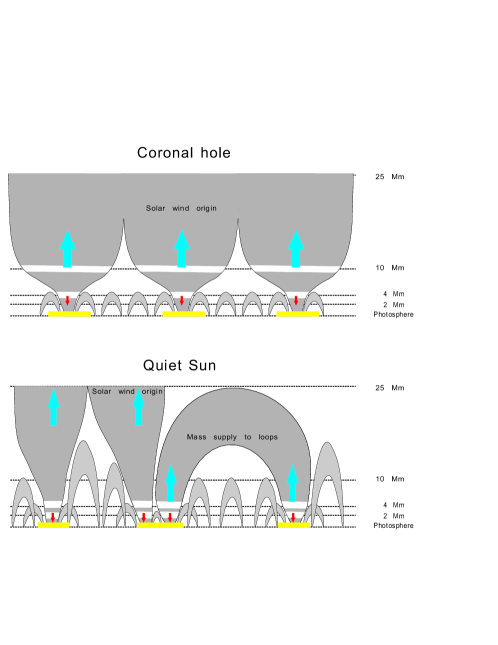
In CHs the dominant magnetic structures are coronal funnels which are connected to the solar wind (Tu2005a, ). Most of the magnetic loops reside in the lower part of the atmosphere. There are almost no large loops (Wiegelmann2004, ; Zhang2006, ; Tian2008c, ). Thus, in CHs magnetic funnels can expand strongly in the TR (Tian2008c, ). While magnetic loops of different spatial scales are crowded in the quiet Sun, so that large coronal loops, whose legs also exhibit funnel-like shapes (Peter2001, ), can not drastically expand with height. Also, the dense loops around funnel legs only permit a weaker expansion of possible quiet-Sun funnels. Some blueshifts in the quiet-Sun network can possibly work their way up to higher layers, finally merge and form the slow solar wind. A similar scenario can also be found in He2009 .
The emission heights of TR lines are also different in the two regions. Based on the results in Tu2005a , Tu2005b , and Tian2008d , the height extension of the TR is approximately 4-10 Mm in coronal holes and only 2-4 Mm in the quiet Sun. However, we have to mention that this height range is only a rough estimate, since the TR is known to be strongly non-uniform (Marsch2006, ). Let us consider finally these results in a wider context.
The concept of coronal circulation as proposed in (Marsch2008, ), or coronal convection, emphasizes that the coronal plasma is nowhere static but observed to be flowing everywhere and guided by various magnetic channels. The various kinds of flows at large scales all appear long lasting, and thus may indicate quasi-steady plasma circulation in the entire corona and TR. The upflows in the upper TR and downflows in the middle TR network intersections are also observed to be long lasting, and thus should play a role in this process. In coronal holes, restless magnetic reconnection between the field lines in coronal funnels and their side loops is likely to supply persistently mass and energy to what becomes a fast solar wind stream. In the quiet Sun, as mentioned previously, continuous magnetic reconnection is likely to be the mechanism responsible for the bi-directional flows in the TR. On the other hand, if cool plasma continuously enters any loop leg through a certain process from outside, a heating process might cause its upflow into the upper TR. At a certain height below the apex of the loop, the flow might, possibly due to cooling, turn downwards again.
We have to point out that our main results are based on the assumption of a force-free field. As mentioned in Tu2005b , the force-free model works well for long-living structures, and the results are not severely influenced by the force-free parameter. Moreover, the excellent agreement between the EUV emission pattern of a coronal bright point and the extrapolated loop structure also indicates the validity of our extrapolation model (Tian2009, ).
References
- (1) D. M. Hassler, I. E. Dammasch, P. Lemaire, et al., Science, 283, 810–813 (1999).
- (2) K. Wilhelm, I.E. Dammasch, E. Marsch, D.M. Hassler, A&A 353, 749 (2000).
- (3) C.-Y. Tu, C. Zhou, E. Marsch, et al., Science, 308, 519–523 (2005a).
- (4) C.-Y. Tu, C. Zhou, E. Marsch, et al., ApJ, 624, L133–136 (2005b).
- (5) I. E. Dammasch, K. Wilhelm, W. Curdt, and D. M. Hassler, A&A, 346, 285–294 (1999).
- (6) H. Tian, C.-Y. Tu, E. Marsch, J.-S. He, and G.-Q. Zhou, A&A, 478, 915–919 (2008).
- (7) N. Seehafer, Sol. Phys., 58, 215–223 (1978).
- (8) J.-S. He, C.-Y. Tu, and E. Marsch, A&A, 468, 307–312 (2007).
- (9) H. Tian, E. Marsch, W. Curdt, and J.-S. He, ApJ, 704, 883–890 (2009).
- (10) H. Peter, and P. G. Judge, ApJ, 522, 1148–1166 (1999).
- (11) L.-D. Xia, Ph.D. Thesis (Göttingen: Georg-August-Univ.), 2003, pp. 139–141.
- (12) W. Curdt, H. Tian, B. N. Dwivedi, and E. Marsch, A&A, 491, L13–L16 (2008).
- (13) T. Aiouaz, ApJ, 674, 1144–1152 (2008).
- (14) H. Tian, C.-Y. Tu, L.-D. Xia, et al., A&A, 489, 1297–1306 (2008).
- (15) T. Wiegelmann, and S. K. Solanki, Sol. Phys., 225, 227–247 (2004).
- (16) J. Zhang, J. Ma, and H. Wang, ApJ, 649, 464–469 (2006).
- (17) H. Tian, E. Marsch, C.-Y. Tu, L.-D. Xia, J.-S. He, A&A, 482, 267–272 (2008).
- (18) H. Peter, A&A, 374, 1108–1120 (2001).
- (19) H. Tian, L.-D. Xia, J.-S. He, et al., Chin. J. Astron. Astrophys., Vol. 8, No. 6, 732–742 (2008).
- (20) J.-S. He, C.-Y. Tu, H. Tian, and E. Marsch, Advances in Space Research, in press (2009).
- (21) E. Marsch, G.-Q. Zhou, J.-S. He, C.-Y. Tu, A&A, 457, 699–706 (2006).
- (22) E. Marsch, H. Tian, J. Sun, W. Curdt, and T. Wiegelmann, ApJ, 684, 1262–1269 (2008).