Dust Transport in Protostellar DisksThrough Turbulence and Settling
Abstract
We apply ionization balance and MHD calculations to investigate whether magnetic activity moderated by recombination on dust grains can account for the mass accretion rates and the mid-infrared spectra and variability of protostellar disks. The MHD calculations use the stratified shearing-box approach and include grain settling and the feedback from the changing dust abundance on the resistivity of the gas. The two-decade spread in accretion rates among Solar-mass T Tauri stars is too large to result solely from variations in the grain size and stellar X-ray luminosity, but can plausibly be produced by varying these parameters together with the disk magnetic flux. The diverse shapes and strengths of the mid-infrared silicate bands can come from the coupling of grain settling to the distribution of the magneto-rotational turbulence, through the following three effects. First, recombination on grains 1 m or smaller yields a magnetically-inactive dead zone extending more than two scale heights from the midplane, while turbulent motions in the magnetically-active disk atmosphere overshoot the dead zone boundary by only about one scale height. Second, grains deep in the dead zone oscillate vertically in wave motions driven by the turbulent layer above, but on average settle at the rates found in laminar flow, so that the interior of the dead zone is a particle sink and the disk atmosphere will become dust-depleted unless resupplied from elsewhere. Third, with sufficient depletion, the dead zone is thinner and mixing dredges grains off the midplane. The last of these processes enables evolutionary signatures such as the degree of settling to sometimes decrease with age. The MHD results also show that the magnetic activity intermittently lifts clouds of small grains into the atmosphere. Consequently the photosphere height changes by up to one-third over timescales of a few orbits, while the extinction along lines of sight grazing the disk surface varies by factors of two over times down to a tenth of an orbit. We suggest that the changing shadows cast by the dust clouds on the outer disk are a cause of the daily to monthly mid-infrared variability found in some young stars.
1 INTRODUCTION
Concentration of the primordial solid material is a fundamental requirement for planet formation. The interstellar medium contains about 1% solids by mass in the form of dust grains, and the Sun has a similar abundance of heavy elements, while the terrestrial planets consist almost entirely of refractory material. Even the most gas-rich Solar system planet, Jupiter, has between 1.5 and 6 times the Solar abundance of heavy elements (Saumon & Guillot, 2004).
A basic concentration process operating in the Solar nebula and other protostellar disks is the settling of dust particles due to the component of the stellar gravity perpendicular to the disk plane. The grains settle at different speeds depending on their ratio of mass to area, leading to mutual collisions. If the disk gas is laminar and the initially sub-micron particles readily stick together, then most of the solid material settles into a thin midplane layer within a few tens of thousands of years at 1 to 10 AU (Weidenschilling, 1980; Nakagawa et al., 1981, 1986). Such rapid loss of the grains conflicts with observations of scattered starlight showing some dust remains suspended in the atmospheres of million-year-old protostellar disks (Burrows et al., 1996; Stapelfeldt et al., 2003; Watson & Stapelfeldt, 2004). However mid-infrared colors suggest the dust abundance is reduced near the disk photosphere, consistent with the incorporation of some material into larger bodies in the interior (Furlan et al., 2006). The smaller particles can remain aloft if stirred by turbulence in the gas (Dullemond & Dominik, 2004).
Turbulence is also commonly invoked to drive the observed flow of material onto the central star. In particular, the turbulence resulting from the magneto-rotational instability (MRI; Balbus & Hawley, 1991, 1998) can provide the necessary outward transfer of orbital angular momentum. However, the MRI requires a sufficient level of ionization for coupling the disk gas to the magnetic fields. The weak internal heating means thermal ionization is effective only very near the star, while the interstellar cosmic rays and stellar X-rays ionize only the top and bottom surfaces of the disk, failing to penetrate the interior (Gammie, 1996; Igea & Glassgold, 1999). Furthermore, the recombination of the free charges on grain surfaces is so efficient that a small mass fraction of sub-micron particles is sufficient to shut off MRI turbulence in much of the region where the planets formed (Sano et al., 2000). As a result, protostellar disks consist of a laminar dead zone sandwiched between two turbulent active layers. The dead zone extends from 0.1 to 15 AU in the minimum-mass Solar nebula, given micron-sized grains and ionization by the median stellar X-ray luminosity (Turner & Drake, 2009).
This paper deals with the consequences of the active and dead layers for dust settling and disk evolution. We investigate how the gas flows govern the distribution of the grains, and how the grains in turn affect the dead zone size, using the methods outlined in §2 to make ionization balance and 3-D MHD calculations of small patches of the disk around a T Tauri star. Since a wealth of data is now available on the abundance, size and composition of dust in the surface layers of protostellar disks overlying the regions where planets are likely to form (Furlan et al., 2006; Schegerer et al., 2006; Bouwman et al., 2008; Watson et al., 2009), we examine the observational signatures of the movements of the grains, seeking to understand the following issues.
-
1.
What is the cause of the large measured range in accretion rate at a given stellar mass (§3)? Solar-mass T Tauri stars grow at rates between about and M⊙ (compiled by Muzerolle et al., 2005), while simple magnetic accretion models have a fixed column of accreting gas set by the penetration depth of the ionizing radiation, implying a unique mass flow rate (Hartmann et al., 2006).
-
2.
Why do T Tauri stars show such diverse mid-infrared spectra (§4)? The variety in the silicate band strengths and shapes indicates wide ranges in the abundances of small and crystalline particles. High crystalline mass fractions appear more often in systems having colors consistent with grains concentrated near the midplane (Furlan et al., 2006; Watson et al., 2009).
-
3.
What are the origins of the variability over intervals of days to years in the 10-m silicate feature (Wooden et al., 2000a; Woodward et al., 2004; Bary et al., 2009) and nearby continuum (Luhman et al., 2008; Muzerolle et al., 2009) (§5)? The shorter variation timescales are substantially faster than the orbital periods at the AU radii where the feature forms.
A summary, discussion and conclusions are in §6.
2 METHODS
We consider a patch of disk lying 5 AU from a Solar-mass star, where the orbital period is 11.2 yr. The surface density g cm-2 and temperature K are taken from the minimum-mass Solar nebula (Hayashi et al., 1985). We solve the standard equations of isothermal resistive MHD (Fleming & Stone, 2003) in the frame co-rotating with the orbital speed of the domain center, using the stratified shearing-box approximation (Hawley, Gammie, & Balbus, 1995; Miller & Stone, 2000) with the ZEUS code (Stone & Norman, 1992a, b). The density in the initial hydrostatic equilibrium varies with the height as a Gaussian having scale height AU equal to the ratio of the sound speed with the orbital frequency . The mean molecular weight of the gas is . The domain size along the local Cartesian axes , corresponding to the radial, azimuthal and vertical directions, is AU and the box is divided into grid cells. The -boundaries are shearing-periodic, the -boundaries are periodic and the -boundaries allow outflow but no inflow.
A major factor in fixing the strength of magneto-rotational turbulence is the net vertical flux of the magnetic field (Hawley, Gammie, & Balbus, 1995; Sano et al., 2004; Pessah et al., 2007). The periodic horizontal boundaries in our calculations mean that the initial vertical flux is preserved over time, while any spatially-varying fields are readily destroyed through reconnection. We choose a starting field that is the sum of a uniform vertical part and a zero-net-flux part with strength , having a sinusoidal variation in with one period in the box width. The initial magnetic field thus has components , and . The uniform part is chosen on the basis of the solar nebula fields of 0.1 to several Gauss, recorded in the remanent magnetization of meteorites from the asteroid belt (Cisowski & Hood, 1991). The fields at 5 AU were more likely near the low end of this range. Magneto-rotational turbulence typically produces fields with an RMS vertical component that is 10 to 20% of the total field strength (e.g. Miller & Stone, 2000). From these considerations, we choose mG. The spatially-varying part of the initial magnetic field is given an amplitude mG similar to the RMS field strength found in ideal-MHD test calculations. The pressure in the uniform part of the field is times less than the initial gas pressure at the midplane, and times less than the gas pressure at four scale heights.
The resistivity in each grid cell is computed by solving a time-dependent ionization network including recombination in the gas phase and on grains (§2.1). We carry out three resistive MHD calculations, each involving grains of one size, either 1, 10 or 100 m, modeled as a fluid settling through the gas at the terminal speed (§2.2). Initially the grains are well-mixed with a mass fraction of 1% and the reaction network is in chemical equilibrium. The largest grains settle two orders of magnitude faster than the smallest. In addition their cross section per unit gas mass is two orders of magnitude less, producing slower recombination and a smaller dead zone.
2.1 Coupling of the Gas to Magnetic Fields
The electrical resistivity of the disk gas
| (1) |
is inversely proportional to the electron fraction , where is the electron number density and the total number density of neutrals (Blaes & Balbus, 1994). We compute the electron fraction by solving the reduced gas-phase recombination reaction network of Oppenheimer & Dalgarno (1974), augmented with reactions involving grains as described by Ilgner & Nelson (2006). The electrons recombine with the ions through grain charging and neutralization, and in the gas phase through dissociative recombination and through charge transfer to metal atoms followed by radiative recombination. The fraction of the metal atoms free to leave the grain surfaces and enter the gas phase is chosen to be 1%. The advection of the reacting species across the grid is treated in an operator-split fashion (Turner et al., 2007).
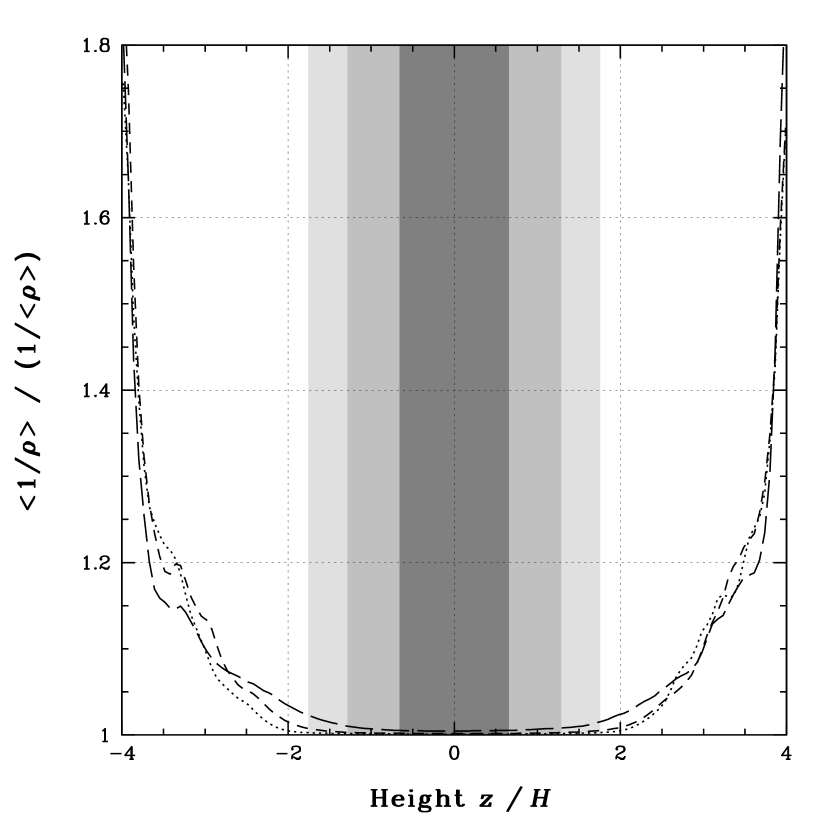
The ionization is due to the X-rays from the young star and the radioactive decay of 26Al nuclei within the disk. The X-ray ionization rate is interpolated in Monte Carlo radiative transfer results including scattering, computed by Igea & Glassgold (1999). At depths not shown on their plot we attenuate the X-rays using an -folding column of 8 g cm-2. The X-rays have a 5 keV thermal spectrum. Where not otherwise specified we use a fiducial stellar X-ray luminosity of erg s-1, matching young Solar-mass stars observed in the Orion nebula (Garmire et al., 2000). The ionization rate is proportional to the luminosity. The 26Al radioactive decay ionization rate is s-1 at the initial dust-to-gas mass ratio of 0.01, and varies in proportion to the local dust abundance. The X-rays dominate the ionization in the outermost 30 g cm-2, or the top and bottom 20% of the mass column (Figure 1). We neglect the changes in the X-ray ionization rate caused by the variation of the opacity with the dust abundance (Glassgold et al., 1997), since no detailed radiative transfer calculations are available. In line with the absence of heavy-element opacities in the Monte Carlo calculations, we also neglect the absorption of X-rays in the grains.

2.2 Treatment of Grain Settling
The drag force between the gas and dust follows the Epstein law, since the mean free path of the molecules in the gas is much larger than the grain size, and the particles generally move through the gas at subsonic speeds. The acceleration felt by dust particles of radius and internal density moving at speed through gas with density and sound speed is
| (2) |
The particles come to rest if no other forces act after the drag time
| (3) |
Figure 2 shows the variation of the drag time with height and grain size in the hydrostatic equilibrium density profile. For grains 100 m and smaller, the drag time is less than the orbital period within four scale heights of the midplane. We have chosen an internal density for the particles g cm-3 about twice that of rock, so that the grains will settle significantly within the 60-orbit time span of the MHD calculations. The geometric cross-section per unit gas mass, a key to determining the recombination rate, is thus equal to that of particles with a more typical internal density g cm-3 and a lower dust-to-gas mass ratio 0.5%.
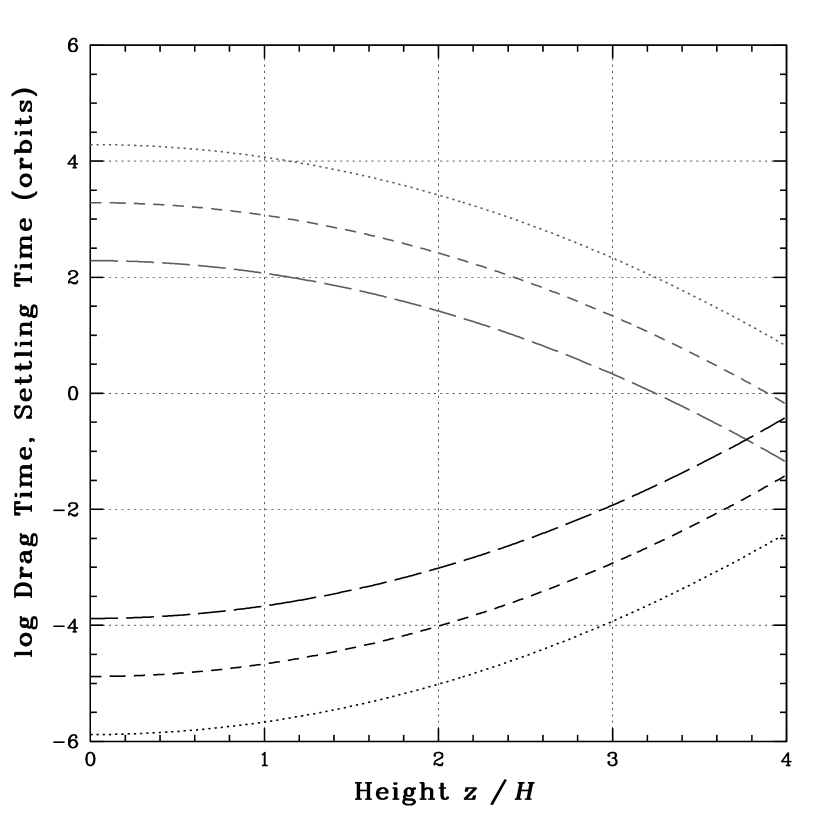
Particles falling through the gas under gravity after one drag time reach a steady-state in which the two forces are equal and opposite. Balancing the drag force with the vertical acceleration due to gravity in the disk, , gives the terminal speed
| (4) |
This amounts to times the sound speed for each scale height of distance from the midplane. The time to settle to a height is approximately
| (5) |
or, in words, the settling time in orbits is or about one-fortieth the inverse of the drag time in orbits.
We wish to model the grain settling in magneto-rotational turbulence. Since the drag time is less than the correlation time of the gas motions in the turbulence (Fromang & Papaloizou, 2006; Turner et al., 2006), the particles settle at their terminal speeds almost always. An exception occurs for 100-m particles near , which have drag times comparable to the correlation time, but as shown by the estimates above and confirmed in §4, these particles quickly settle into the interior. We treat the dust as a fluid moving with a velocity equal to the sum of the gas velocity and the terminal velocity , with the latter directed toward the midplane. When the gas is near hydrostatic equilibrium, this is equivalent to the short friction time approximation used by Johansen & Klahr (2005), and has the advantage that the time step can be longer than the drag time, reducing the computing load by several orders of magnitude compared with the full dust equation of motion. The back-reaction of the dust on the gas is neglected. We solve the conservation equation for the grain number density ,
| (6) |
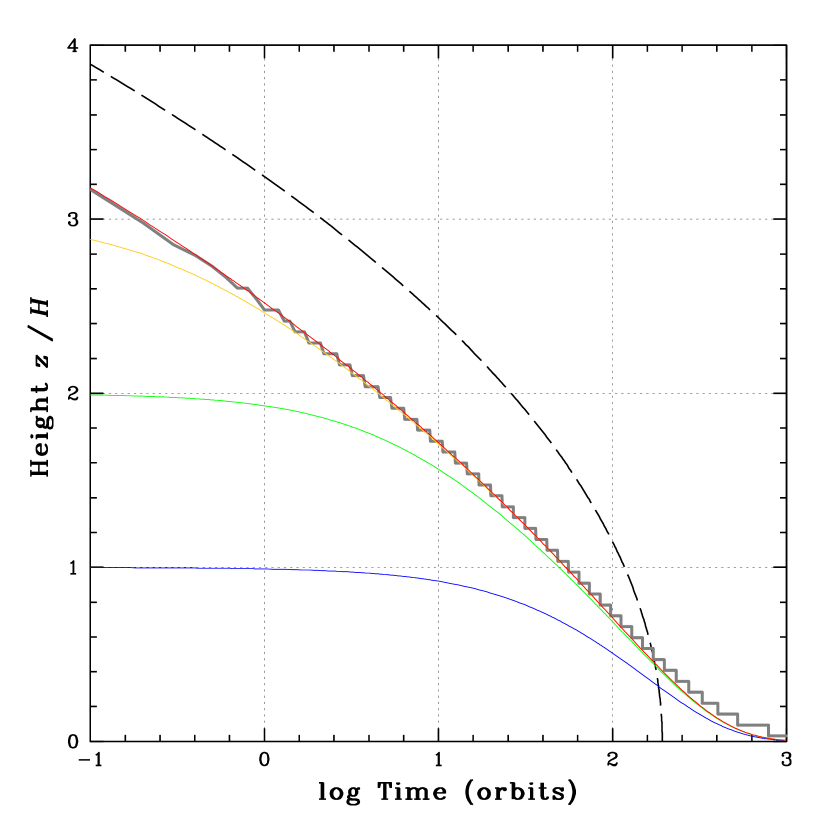
using the same standard second-order accurate van Leer transport algorithm applied to the gas. The Courant condition for the dust is satisfied in our MHD calculations because the terminal speed is less than the greatest Alfvén speed on the grid, typically about . To test the method, we compute the time evolution of a layer of 100 m dust particles initially well-mixed with the gas. The domain extends from the midplane to four scale heights and is divided into 64 grid cells. The gas is stationary while the dusty layer contracts over time through settling. To gauge the accuracy of the solution, we also compute the paths followed by individual grains using a fourth-order Runge-Kutta integration scheme (Turner et al., 2006). The results are shown in Figure 3. The settling is fastest in the low-density disk atmosphere, so that most of the grains that have settled significantly at any given time lie bunched-up near the top of the dusty layer. The thickness of the layer varies roughly as the square root of the logarithm of , in agreement with eq. 5 given the Gaussian gas density profile. Equation 5 overestimates the thickness at early times, when the distance the particles have fallen is less than their height, and underestimates the thickness after a few hundred years, when the edge of the dust layer lies near the midplane, the gas density is roughly uniform, and the terminal speed no longer decreases sharply as the particles fall. The paths of four individual grains from the trajectory integrator starting at 1, 2, 3 and 4 scale heights illustrate the pile-up near the top of the dusty layer and show that the treatment of the settling in ZEUS has satisfactory accuracy. The uppermost particle (red curve) lies near to the highest grid cell in the ZEUS calculation having a grain abundance more than half the initial value (gray line). After a few hundred years, when the dusty layer is just a few cells thick, the ZEUS calculation is less accurate as numerical diffusion becomes important and spreads the layer. Similar results are obtained in test calculations with 10- and 1-m grains where settling is 10 and 100 times slower.
3 MASS FLOW RATE
Conservation of orbital angular momentum dictates that the rate at which mass flows through the disk to the star
| (7) |
is proportional to the height-integrated accretion stress when winds are negligible. Since most of the mass flow passes through the active layers, the accretion rate is the product of the active layer thickness with the volume-averaged stress there.
The thickness of the active layer depends on the ionization profile of the disk material. Magneto-rotational turbulence can be shut off by the Ohmic resistivity when charged and neutral particles collide frequently (Jin, 1996) and by ambipolar diffusion when collisions are rare (Blaes & Balbus, 1994; Hawley & Stone, 1998). The third non-ideal term in the induction equation, the Hall term, by contrast has little effect on the saturation amplitude of the turbulence over the range of parameters that has been explored in non-linear calculations (Sano & Stone, 2002b). The active layer thickness also depends on the field strength. The linear magneto-rotational instability grows slowly if the magnetic pressure exceeds the gas pressure (Kim & Ostriker, 2000), on fields having the substantial toroidal component expected given the rapid orbital shear. Numerical ideal-MHD calculations, in general agreement with the linear results, show the stress declines with height in the strongly-magnetized disk corona (Miller & Stone, 2000).
To estimate the active layer thickness, we compare the limits imposed by the Ohmic and ambipolar terms and the magnetic pressure. We bring the ionization-recombination reaction network to local equilibrium in the presence of well-mixed grains. The electron density approaches within 10% of its equilibrium value in less than one orbit, at all locations below 4 scale heights when grains are present (Figure 4). Consequently, turbulent mixing occurring on timescales longer than the orbital period is unlikely to change the ionization significantly.

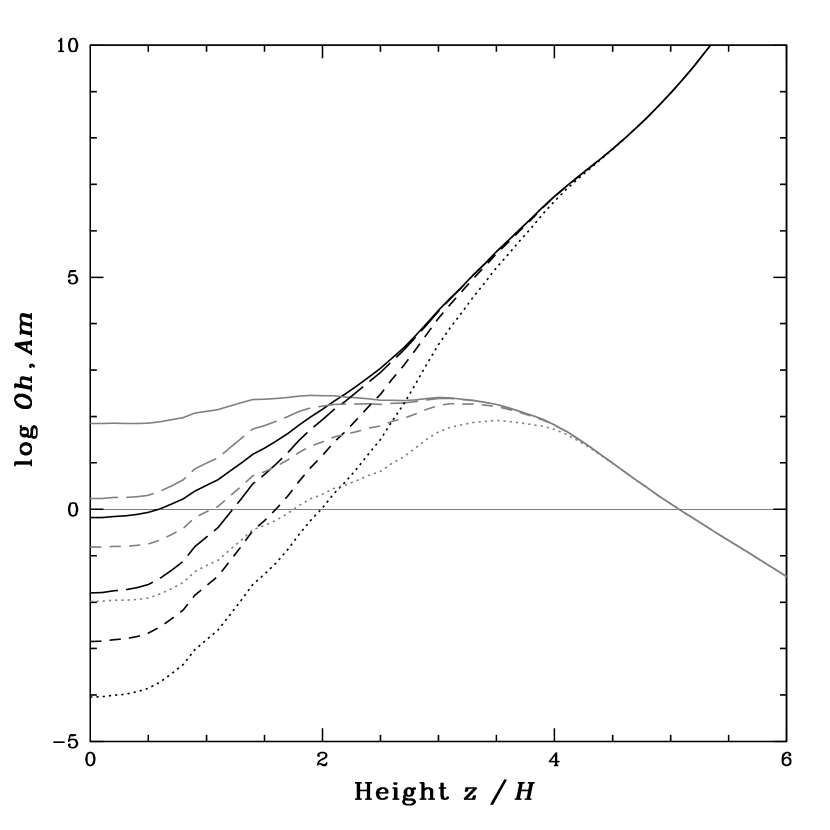
The active layer separates the dead zone inside the disk from the corona outside. Rapid Ohmic dissipation prevents magneto-rotational turbulence at the high densities found in the dead zone, and rapid ambipolar diffusion prevents turbulence at the lower densities found in the corona (Wardle, 2007). The minimum Ohmic and ambipolar diffusion rates needed to shut off the turbulence correspond to the field drifting across the characteristic vertical wavelength of the instability, , within the characteristic growth time , where the Alfvén speed . The resulting Ohmic dead zone criterion is
| (8) |
(Sano & Inutsuka, 2001; Sano & Stone, 2002b). The Elsasser number criterion eq. 8 yields more accurate estimates of the dead zone boundary than a version with the Alfvén speed replaced by the sound speed (Turner et al., 2007). The dimensionless number governing whether ambipolar diffusion prevents turbulence in the neutrals
| (9) |
(Hawley & Stone, 1998; Sano & Stone, 2002a; Chiang & Murray-Clay, 2007) is proportional to the ion-neutral drag coefficient and the ion density , and independent of the magnetic field strength. Using the drag coefficient described by Sano & Stone (2002a), we find that eq. 9 holds above about (Figure 5). The height where reaches unity is almost independent of the grain properties, because most recombination occurs in the gas phase at the low ambient densities and high ionization fractions (Wardle, 2007).
The height where the magnetic and gas pressures match depends on the strength of the magnetic fields generated in the turbulence. In our three resistive MHD calculations, the sinusoidal part of the magnetic field quickly dissipates throughout, leaving in the dead zone just the net vertical part , and in the active layers the vertical part plus a newly-regenerated tangled field. The horizontally-averaged Maxwell stress outside the dead zone is a few times the Reynolds stress, as expected in MRI turbulence. The magnetic pressure averaged over the time interval from 10 to 60 orbits exceeds the gas pressure above about , and the stress declines steeply with height near the domain boundary at . Ideal-MHD calculations in a taller shearing-box (Miller & Stone, 2000) show an exponential decline in the stress through . These results indicate that the upper boundary of the active layer is determined by the strong magnetization, rather than the ambipolar diffusion, and lies near .
At the base of the active layer the Ohmic resistivity given by eq. 1 shuts off the turbulence according to eq. 8. Combining these relations under the conditions found at 5 AU in the minimum-mass Solar nebula yields a critical electron fraction . The ratio of the gas pressure to the mean pressure in the vertical component of the field is about near the base of the active layer in our three MHD calculations, so the ionization fraction is a few times .
The allowed range of heights for the base of the active layer under more general magnetic field conditions can be found from eq. 8 using the known resistivity profile. A maximum height for the base and thus a minimum total thickness for the active layer comes from considering only the uniform part of the magnetic field mG in the MHD calculations. A minimum height for the base and an upper bound on the active layer thickness come from using the field strength mG found in the ideal-MHD tests. The resulting limits on the active layer thickness are shown in figure 6 as functions of the grain size and X-ray luminosity. The X-ray luminosity range plotted corresponds to the spread found in Chandra X-ray Observatory studies of the Orion nebula that detected most of the lightly-obscured young Solar-mass stars (Garmire et al., 2000; Preibisch et al., 2005). The active layer thickness varies from , when the field takes the weaker value, the X-ray luminosity is low and the grains are small, to the full extent of the disk, when the field is strong and the grains are 10 m or larger. The range in active layer thickness is thus a factor 3.2.


Determining the range of possible mass flow rates involves estimating the mean stress in the active layers. The turbulence regenerates the fields, so that the saturated field strength is determined jointly by the imposed magnetic flux and, through the resistivity of the gas, by the X-ray illumination and the distribution of the grains. The mass flow and the extent of the active layers in the three MHD calculations are shown in figure 7. The quantity plotted is proportional to the total accretion stress resulting from magnetic and hydrodynamic forces. The overall mass flow rate in the run with 100-m grains is 3.55 times that in the run with 1-m grains. This total is made up of a factor 1.49 due to the range in active layer thicknesses, and a remaining factor 2.38 due to the stronger magnetic fields found in the thicker active layers. If the stresses have the same proportionality to the active layer thickness over the whole of figure 6, then variations in the X-ray luminosity and grain size can change the mass flow rate by about a factor 16. Magneto-rotational turbulence can explain the two-decade range in the observed accretion rates if the remaining factor of six comes from other effects. Possibilities include (1) some disks having an abundance of very small grains, yielding a very thin active layer (Sano et al., 2000); (2) a range of magnetic fluxes among T Tauri systems [the stress increases with the vertical magnetic flux (Hawley, Gammie, & Balbus, 1995; Sano et al., 2004; Pessah et al., 2007)]; and (3) changes in the mass flow rate with radius and time (Gammie, 1996; Armitage et al., 2001).
It is of interest to compare the mass column of the active layer with the X-ray attenuation column, 8 g cm-2. The active column is less than the attenuation column when the grains are small and recombination is fast, and greater when the grains are large. The mean active column in the run with 1-m grains is 5.18 and 4.82 g cm-2 on the disk top and bottom, respectively. The numbers are 13.3 and 12.7 g cm-2 in the run with 10-m grains, and 32.3 and 33.6 g cm-2 in the run with 100-m grains. The average values of 5.0, 13.0 and 32.9 g cm-2 span a factor 6.6.
4 GRAIN MOVEMENTS
The dust particles in our three MHD calculations move by settling and by advection with the gas. The gas is near magneto-hydrostatic equilibrium throughout. Its velocity field consists of magneto-rotational turbulence superimposed on a gradual expansion due to outflow from the disk surfaces. Wave motions replace the turbulence inside the dead zone. The three following sections outline the effects on the dust of the settling, the outflow and the turbulent stirring, while the fourth section deals with the movements of the particles in the dead zone.
4.1 Settling
Dust settles fastest in the upper atmosphere, where the gravity is strong and the low density means weak gas drag. In the absence of turbulence, settling is quick. According to the rough estimate of eq. 5, particles 1, 10 and 100 m in size in 100 orbits reach heights of 3.2, 2.4 and , while the more accurate numerical integrations shown in figure 3 yield 2.5, 1.7 and . Coagulation can decrease the cross-sectional area per unit mass, making settling faster still, but we have assumed here that the particles do not stick to one another.
The settling speed is inversely proportional to the gas density (eqs. 3 and 4). The magnetic fields cause substantial departures from the hydrostatic equilibrium Gaussian density profile outside about , where the magnetic pressure approaches or exceeds the gas pressure. Magnetic support allows higher densities in the upper atmosphere, with the extra material coming from the deeper layers where the density is correspondingly reduced (figure 8). The mean gas density at is up to eight times greater than the hydrostatic value.

Horizontal density fluctuations in the turbulence however yield an average settling speed greater than the speed predicted from the mean density (figure 9). The fluctuations make settling faster than the mean density profile by about 10% at and 80% at . Density fluctuations in the dead zone are small and have little effect on the settling.
The ionization remains near its time-varying equilibrium value in the MHD calculations as the grains settle out. Chemical equilibration occurs faster than settling except with 100 m grains above 3.5 scale heights (figures 2 and 4). At the low densities found above this height, reactions on the surfaces of the large grains in any case are negligible and the ionization state is determined by gas-phase processes.
4.2 Outflow
Gas intermittently escapes from the top and bottom of the domain as the turbulence carries material across the boundaries. The greatest speeds are a few times the sound speed, and thus the lost gas remains gravitationally bound to the star and may return to the disk. Since the calculations do not reach high enough nor include the radial gradients that may be important for any acceleration through escape speed, we here describe the outflows only to the extent needed to subtract their effects.
The outflows result in the surface density declining between 10 and 60 orbits by 6.9, 8.3 and 11% in the calculations with 1-, 10- and 100-m grains. The average mass flow rate in the 1-m case is yr-1 AU-2. The remaining gas stays near hydrostatic equilibrium by expanding slightly, and the expansion carries gas and in some cases dust from the interior into the disk atmosphere. For continuity of mass, the expansion speed is approximately proportional to the inverse density. The speeds of gas upwelling and grain settling thus have similar functional increases with height. At , the gas flows away from the midplane at about 0.3% of the sound speed, while grains of 1, 10 and 100 m settle at 0.012, 0.12 and 1.2% of the sound speed in the initial Gaussian density profile according to eq. 4 and figure 2. The settling is faster than the outflow at all heights in the run with 100-m grains, so that the dust distribution results mostly from the competition between settling and turbulent stirring. By contrast the outflow is faster than the settling everywhere in the run with 1-m grains, but at the grains settle at 30% of the gas upwelling speed. As a result, the grains are lost at a slower rate than the gas and their mass fraction increases over time in the upper atmosphere. The run with 10-m grains is an intermediate case, and the outflow carries the particles to about (figure 10). Above this height the settling is faster than the outflow.

4.3 Turbulent Stirring
Turbulence causes mixing, making the dust-to-gas ratio more uniform. The timescale for mixing through one density scale height is
| (10) |
where the denominator is the turbulent diffusion coefficient and is proportional to the correlation time of the turbulence and to the mean squared turbulent vertical velocity (Fromang & Papaloizou, 2006). The turbulent speed is obtained by subtracting the horizontally-averaged outflow speed from the total. The mixing timescale is tens of orbits in much of the active layer. In particular, at the dead zone boundary the average mixing time is 24, 53 and 46 orbits in the calculations with 1, 10 and 100 m grains, respectively. By comparison, grains initially in the upper atmosphere settle to the dead zone boundary in 900, 270 and 112 orbits, respectively. Also, the outflowing gas crosses one scale height near the dead zone boundary in approximately 43, 162 and 288 orbits. The turbulent mixing is thus the fastest of the three processes at the edge of the dead zone.
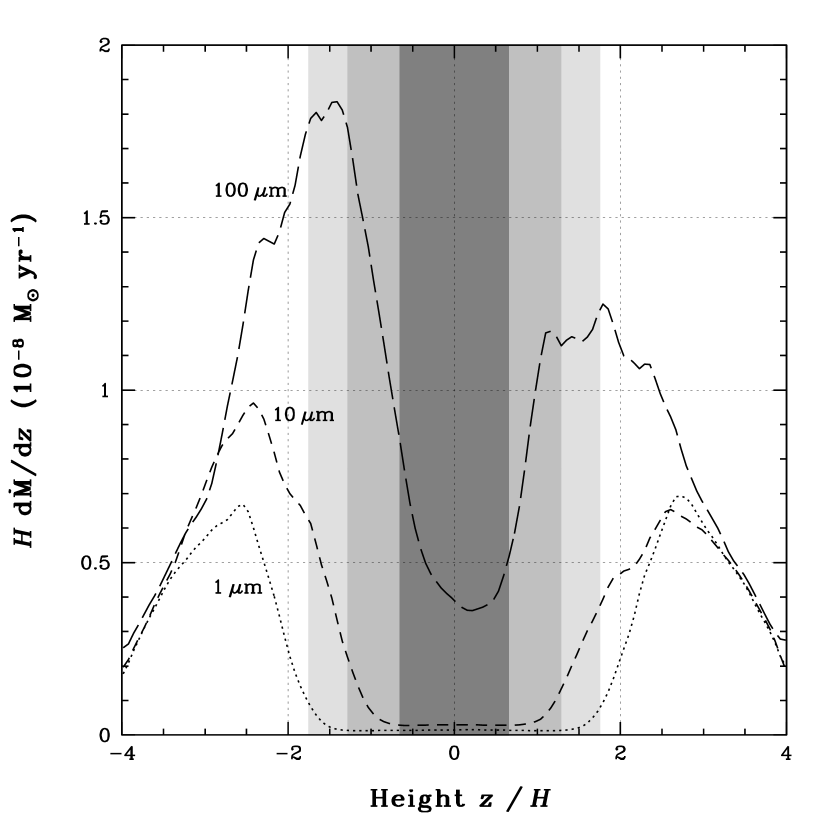
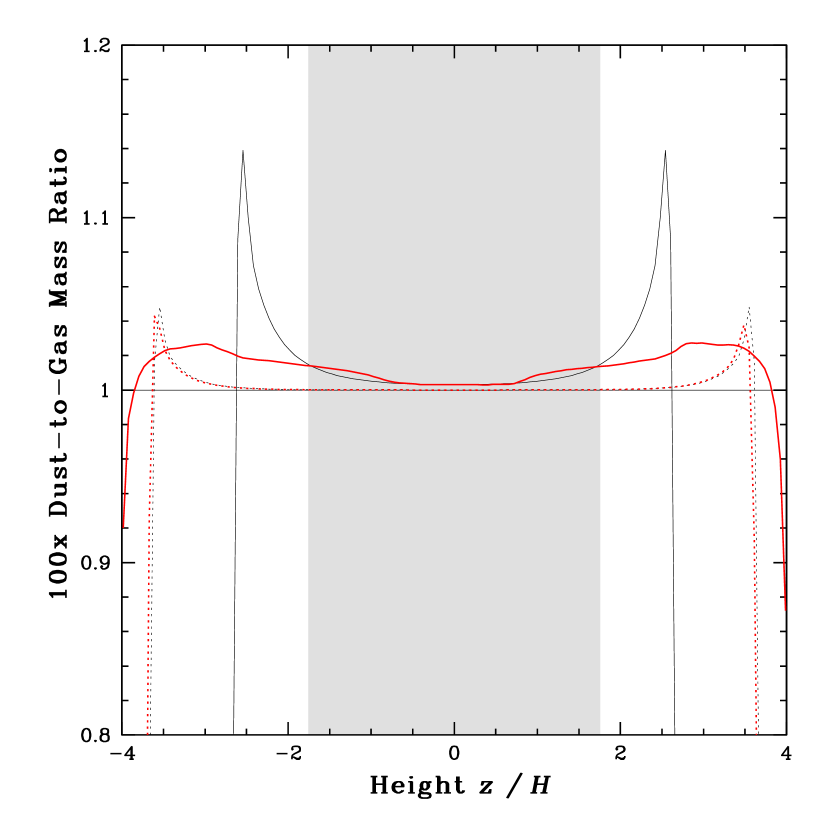
The results of mixing the 1-m grains appear in figure 11, showing the dust mass fraction versus height. The dust settles in one orbit to . By 60 orbits, settling without turbulence produces a spike in the dust abundance near . In the MHD calculation where outflow and turbulence occur alongside the settling, the spike is smoothed out across the active layer as follows. The settling enhances the dust abundance at 2 to . The outflow carries some of the dust-enriched material upward, and the turbulence spreads the dust-enriched material both up into the atmosphere and down into the dead zone. The downward mixing overshoots the dead zone boundary by about one scale height. Settling and turbulence together thus speed up the concentration of the solids in the deeper layers compared with the laminar case. This contradicts the usual wisdom that turbulence counteracts settling.
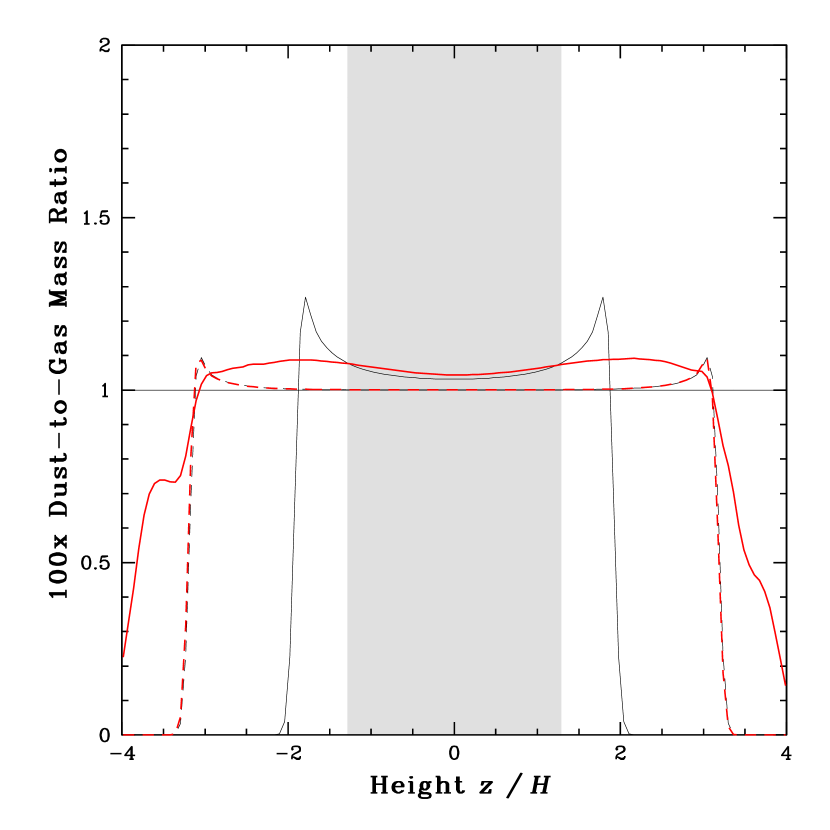
Similar processes operate on the 10-m grains (figure 12). Few of the particles remain by 60 orbits above , where the settling time is less than an orbit and settling overwhelms both the turbulent mixing and the entrainment in the outflow. The turbulence mixes the dust almost uniformly through the dead zone, as the movements of the gas overshoot the dead zone boundary all the way to the midplane.
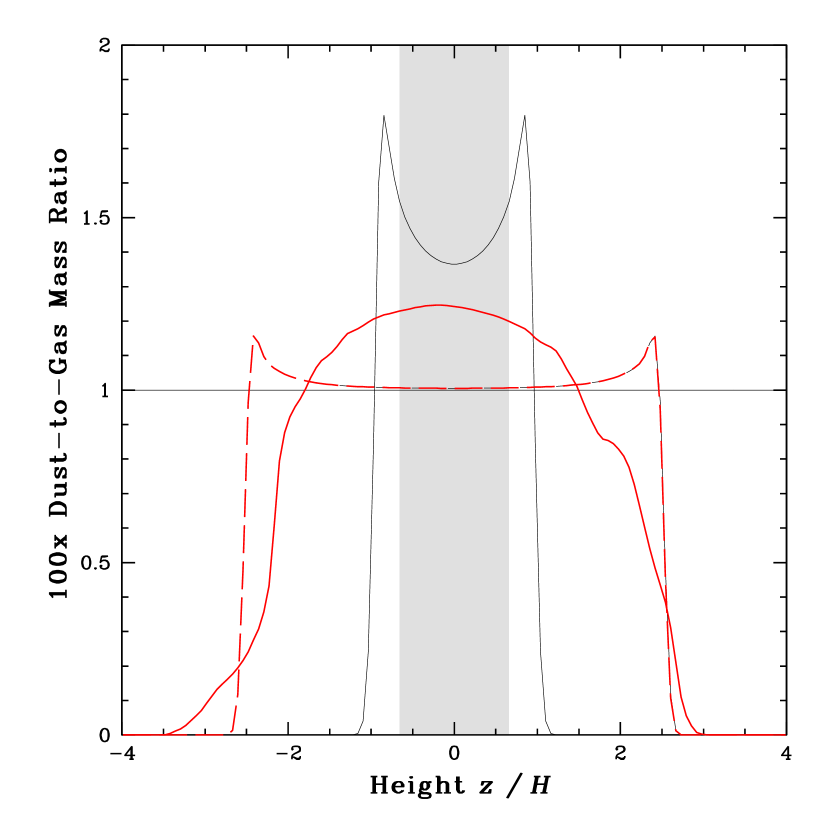
The 100-m grains (figure 13) have mostly settled below by 1 orbit and remain there at 60 orbits. Nearer the midplane, the stirring and settling timescales are comparable. The dead zone extends just either side of the midplane, and overshooting turbulent motions reach all parts of the interior. The settling is fast enough that the dust abundance has become greatest close to the midplane. The turbulent mixing thus on balance moves grains from the dead zone to the active layers, preventing further concentration.
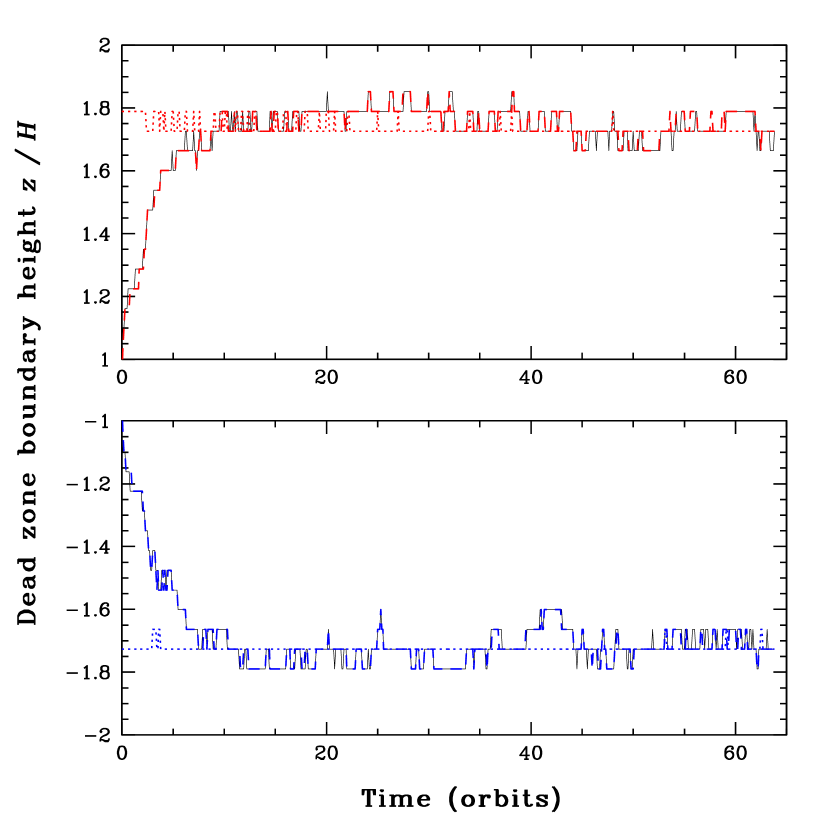
The movements of the dust have little effect on the dead zone depth over the time interval spanned by the calculations. In figure 14 we plot three different measures of the dead zone boundary height versus time, in the case with 1-m grains. The Elsasser number from eq. 8 is computed (1) holding the resistivity profile fixed at its time-averaged level, (2) holding the squared Alfvén speed profile fixed, and (3) allowing both the resistivity and the Alfvén speed to vary with time. The first and third cases generally coincide, showing that it is the magnetic field, rather than the rate of recombination on grains, that controls the changes in the dead zone size over timescales comparable to the orbital period.
To check whether neglecting particle growth is valid, we compare the expected grain-grain collision speeds with the threshold of about 1000 cm s-1 for the disruption of silicate aggregates established by laboratory measurements (Blum & Wurm, 2008). Adopting the expressions for the relative velocities of particles in isotropic turbulence derived by Ormel & Cuzzi (2007), we find that aggregates of 10 m or larger can be disrupted by collisions with 1-m particles in the three MHD calculations above about . Compact spheres as large as 100 m settle fast enough that they rarely reach such heights, judging from figure 13. Meanwhile near the midplane, collisions are too slow for disruption, and growth to larger sizes is likely.
4.4 Grains in the Dead Zone
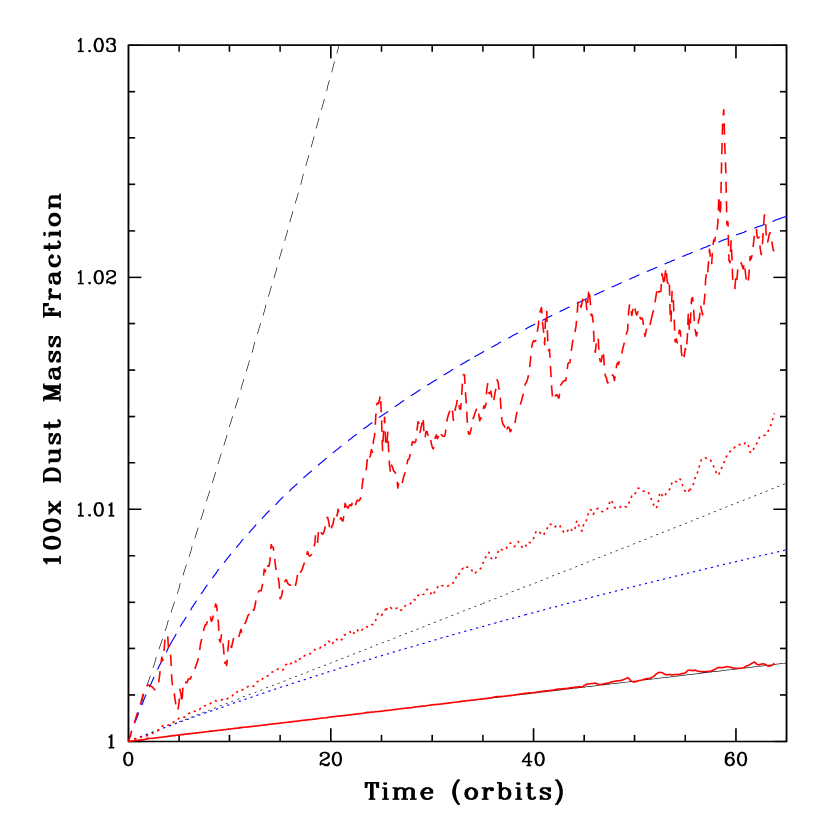
In this section we examine the movements of the dust particles in and near the dead zone. We focus first on the calculation with the 1-m grains, where the dead zone is deep enough that turbulent mixing fails to reach the midplane. To isolate the contributions of settling and outflow we compare the MHD results against (1) the hydrostatic settling case and (2) a numerical solution of the dust continuity equation in a time-constant flow that approximates the outflow found in the MHD calculation. The expansion of the gas carries less-settled and therefore less-dust-enhanced interior material into the surface layers, leading to slower increases in the dust abundance over time than in the hydrostatic case. The evolution of the dust abundance at several different heights is shown in figure 15. Outside the dead zone boundary, at , the abundance in the MHD calculation increases and decreases intermittently due to the turbulence, while overall tracking slightly below the outflow solution. The deficit results from the loss of dust to the deeper layers through turbulent mixing (figure 11). Just inside the dead zone boundary, at , the abundance is higher than the outflow solution owing to the dust mixed down from above. Meanwhile at the midplane, the dust abundance follows the laminar solution with small oscillations. Deep in the dead zone, the settling proceeds largely as if there were no turbulence in the active layers.
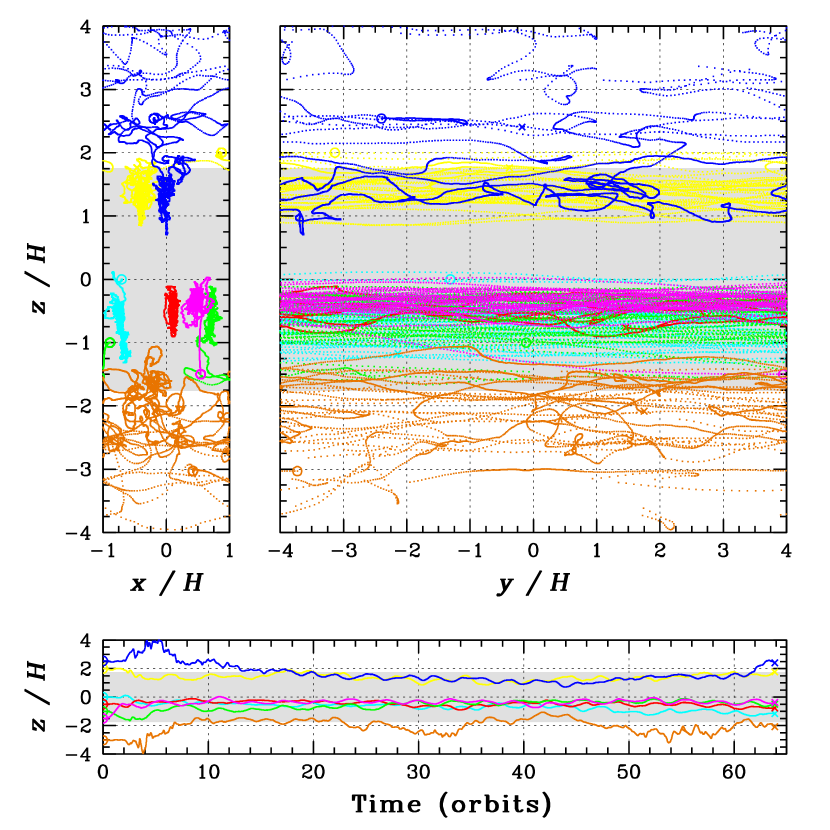
To see how turbulence overshooting the dead zone boundary affects the motions of individual grains, we have also computed the paths followed by a large number of particles in the time-dependent gas density and velocity field of the MHD calculation using the Runge-Kutta scheme described in section 2.2. Selected particles are shown in figure 16. The grains found in the active layers follow looping paths in the turbulence, as on parts of the blue and orange curves. The radial and vertical speeds are comparable, and the vertical motions plotted in the bottom panel are irregular. Grains found in the dead zone in contrast show mostly slower periodic vertical oscillations and have little radial motion, as on the red, green, cyan and magenta curves. Particles cross the dead zone boundary moving both toward and away from the midplane, while particles near the midplane remain close to their initial positions. The non-zero hydrodynamic accretion stress in the dead zone results from propagating waves, which have little impact on the particle settling. On the other hand, the particles near the midplane oscillate with amplitudes a few tenths of a scale height and phases that drift over time relative to one another, suggesting that the settling will not yield a thin flat midplane dust layer of the kind typically assumed for the formation of planetesimals by gravitational instability (Goldreich & Ward, 1973). The thickness of the settled layer in an otherwise stationary nebula is just 1% of the gas scale height, if limited by the onset of the Kelvin-Helmholtz instability between the dust-rich Keplerian component and the overlying gas that orbits at sub-Keplerian speeds owing to its partial support against the stellar gravity by the radial gas pressure gradient (Chiang & Youdin, 2009).
5 TIME VARIABILITY
Time variations in the strength and shape of the silicate band at wavelength 10 m have now been seen by several groups using instruments on the ground and in space. About a quarter of the two dozen low- and intermediate-mass young stars monitored by Wooden et al. (2000a) and Woodward et al. (2004) from 1992 to 2002 showed significant variations in the silicate bands but not in the continuum. The observations were separated by months to years and the variations showed no clear period. The generally poor correlations with changes in optical brightness and extinction appear to rule out an origin in the reprocessing of the starlight by a static envelope, but may be consistent with the features arising from dust in the disk atmosphere (Wooden et al., 2000b). Judging from static models, the 10-m emission would come mostly from dust near 1 AU (D’Alessio et al., 2006). A much larger census of the Chameleon I star-forming region with the Spitzer Space Telescope detected photometric variations at 3.6 to 8 m in about half of all disk-bearing sources observed at intervals of months to years (Luhman et al., 2008). The silicate band varied on comparable timescales in two of 11 accreting T Tauri stars observed with Spitzer by Bary et al. (2009) and in the EX Lupi system observed by Ábrahám et al. (2009). A further system, the transitional disk LRLL 31, exhibits variability in the silicate feature and mid-infrared continuum in observations separated by as little as a week, which might be due to changing shadows cast on the disk by material near the star (Muzerolle et al., 2009). In several examples, spatially resolved optical and near-infrared images taken a few days to months apart show changes in shape and brightness at distances of 50 to 350 AU (Burrows et al., 1996; Cotera et al., 2005; Watson & Stapelfeldt, 2007; Luhman et al., 2009). Dynamical processes operating at these radii appear incapable of producing such rapid changes. Photopolarimetry of one of the objects, HH30, shows periodic modulation on timescales of about a week, explained by a lighthouse picture in which a beam or shadow from a central source sweeps across the disk (Durán-Rojas et al., 2009). Altogether, the evidence is consistent with the widespread infrared variability arising at least in part from changes in the distribution or illumination of the dust in the disk atmospheres. To help evaluate whether magnetic activity moves the dust around enough to cause the variability, we use the results of the MHD calculation with 1-m particles in this section to compute in turn the height of the photosphere, the appearance of the disk patch at mid-infrared wavelengths, and the obscuring column along lines of sight grazing the disk surface.
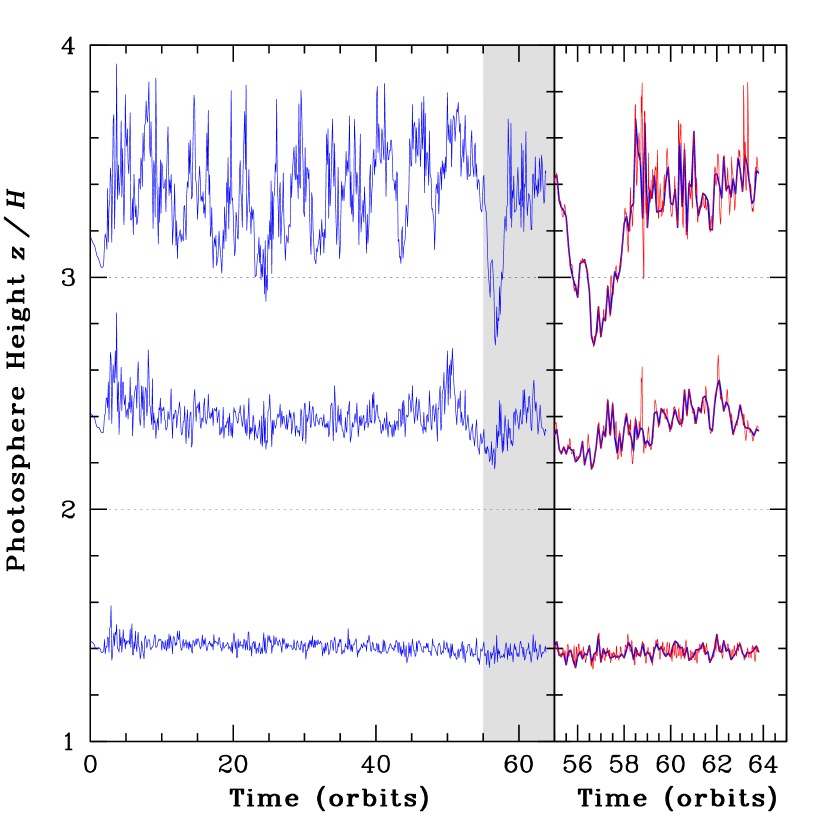
The photosphere height is plotted versus time in figure 17. Optical depths are calculated by integrating the dust column along the ray passing vertically down through the center of the box. The results are shown for opacities of 1000, 100 and 10 cm2 per gram of dust. The highest of these is comparable to the geometric cross-section of 1500 cm2 g-1 for the 1-m grains and to the 982 cm2 g-1 opacity at wavelength 10 m obtained for grains in dense molecular cloud cores by Preibisch et al. (1993). This highest opacity places the photosphere in the most magnetically-active layers, where the fluctuations in the dust density are greatest. The location of the photosphere varies over time by more than a scale height. The lower-opacity curves correspond to dust depletions of one and two orders of magnitude. At the lowest opacity, the active layers are optically thin and the photosphere lies inside the dead zone. Optically-thin active layers at 1 AU have been suggested as a consequence of the low dust abundance needed for magnetic stresses there to yield the measured stellar accretion flows (Bai & Goodman, 2009).
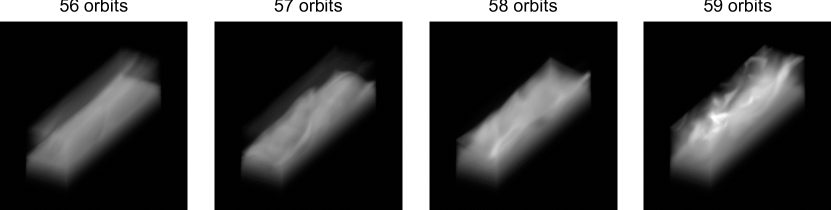
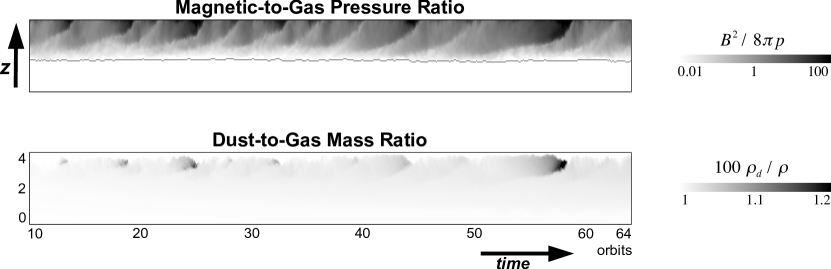
The time variation in the thermal emission from the dust is illustrated in figure 18. We calculate the emission at wavelength 10 m using a ray-tracing radiative transfer code based on that of Yorke (1986) as described by Turner et al. (1997), taking an opacity of 100 cm2 per gram of dust. Scattering provides a small fraction of the total opacity (e.g. Preibisch et al., 1993) so we treat only absorption and thermal emission. To mimic the warm surface layer produced by starlight (Chiang & Goldreich, 1997), stellar X-ray irradiation (Glassgold et al., 2004) and photoelectric heating (Kamp & Dullemond, 2004), we assume when solving the transfer equation that the temperature increases linearly above one scale height, reaching 600 K at . Temperature fluctuations due to changes in the location where the stellar radiation is absorbed are neglected. The time sequence in figure 18 shows the brightness variations over a three-orbit span. Every few orbits, the magnetic fields along the orbital direction grow strong through the shear, reducing the gas density by one to two orders of magnitude so that the dust quickly settles out (figure 19). The fields eventually become buoyant and rise through the boundary. Gas expanding into the space vacated by the fields carries dust particles back into the warm layer where they become bright in the 10-m band. The eruptions of dusty gas recur episodically, synchronized with the variations in the magnetic activity.
Uncorrelated brightness variations in many patches across the disk will produce only slight changes in the emission of the system as a whole. However the atmosphere can contribute to variability also by casting time-dependent shadows on the more distant parts of the disk, and by obscuring the central star in systems viewed near edge-on. The shadows sweep across the disk on the orbital period of the shadowing material, while possibly changing in size and strength over shorter timescales determined by the turbulence. We estimate the magnitude of the faster variations by measuring the mass column along a horizontal ray that is fixed in the rotating frame of the shearing-box, passing above the origin. The extinction to the central star as seen by an outside observer, on the other hand, changes as the orbital motion carries material through the line of sight. We estimate the timescales involved by measuring the mass column along a ray that is fixed in the inertial frame and moves across the shearing-box at the orbital speed, making use of the periodic azimuthal boundary condition. The inertial line of sight crosses the azimuthal extent of the domain in just 0.06 orbits.
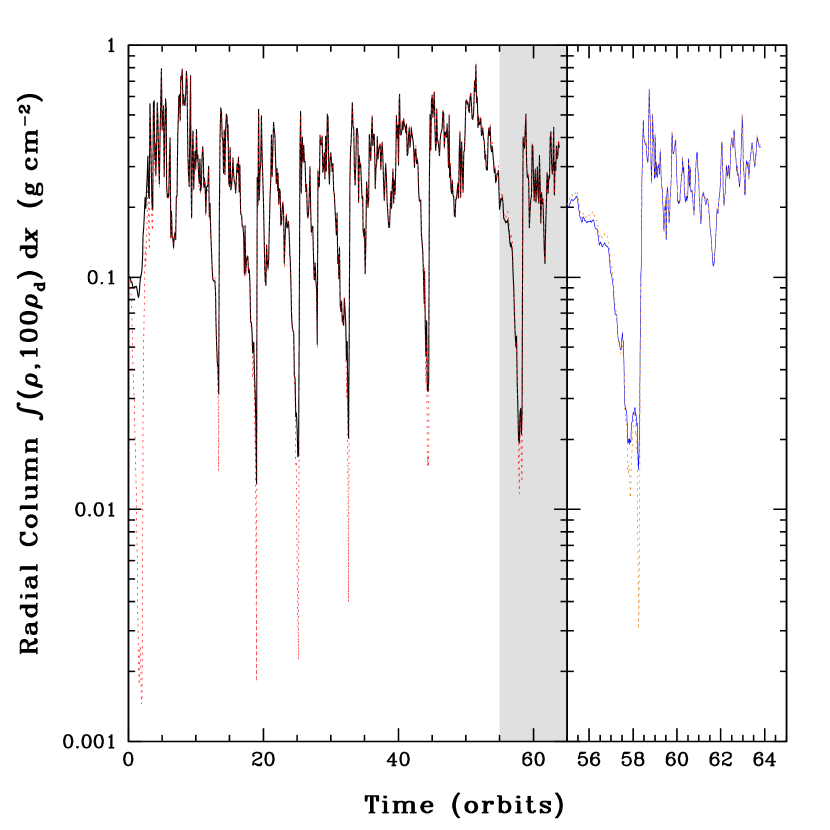
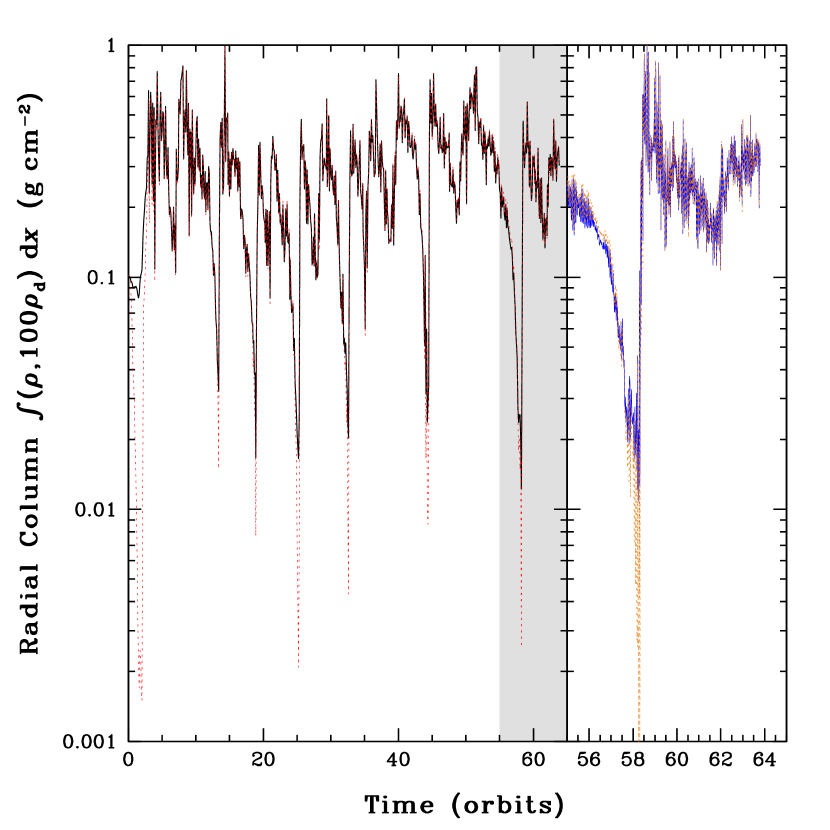
The columns of gas and dust are plotted against time in figure 20. Over intervals of several orbits, the column decreases by an order of magnitude due to the growth of the magnetic field, before quickly returning to its old level when the field escapes. The dust settles out fastest when the column is low, reducing the ratio of dust to gas. Faster, erratic column variations on timescales orbit result from the density fluctuations in the turbulence, while still faster variations over about 0.01 orbit, visible only on the inertial line of sight, result from the orbital motion. As seen on the rotating line of sight, the dust column changes by more than a factor two in 0.1 orbit every 2.3 orbits on average, while similar changes within a shorter interval of 0.01 orbit occur just once in 8.8 orbits. On the inertial line of sight, dust column measurements separated by 0.1 orbit differ by more than a factor two every 1.4 orbits, and those separated by 0.01 orbit show a similar change every 0.22 orbits. These results indicate that the turbulence will yield changes in the depth of the shadows cast on the disk mostly over timescales longer than a tenth of an orbit, while changes in the extinction to an observer will be substantial on timescales down to at least 0.01 orbit. Note that the patch of disk treated in the MHD calculation has radial optical depth near unity at and thus can cast a strong shadow, if the opacity is a few hundred cm2 per gram of dust.
In the calculation with 10-m grains, the settling is so effective at times of low column that the upper atmosphere becomes almost dust-free. The gas expands owing to the magnetic pressure making the densities less than the initial hydrostatic profile. The particles then settle below in less than an orbit (figure 12). The case with 100-m grains is dust-free at almost always.
6 DISCUSSION & CONCLUSIONS
We have made resistive MHD calculations of a patch of disk in orbit around a young star, treating simultaneously for the first time three processes that together regulate the distribution of magneto-rotational turbulence. First, the dust drifts through the gas under the gravity and gas drag forces. Second, the dust alters the resistivity of the gas, and third, the resistivity controls the evolution of the magnetic fields driving the gas flows. The three processes combine in quite different ways in the disk atmosphere and interior.
In the atmosphere, the high flux of ionizing radiation from the star allows good coupling between gas and magnetic fields even when the dust abundance is high. Intermittency in the turbulence and in the distribution of dust result from fluctuations in the magnetic field strength. During intervals of weak fields, the magnetic forces drive turbulence that carries dust particles high in the atmosphere. The turbulent mixing of the grains is faster than either the settling or the outflows resulting from the open boundaries. When the fields are stronger, their large pressure prevents magneto-rotational turbulence and reduces the gas density, so that the particles settle quickly.
At the same time in the dead zone near the disk midplane, recombination on grain surfaces reduces the ionization fraction below the level needed to sustain turbulence. Grains settle at the laminar rate, with superimposed vertical oscillations due to the propagation of waves excited in the turbulent layers. Particles falling into the laminar layer do not return to the disk atmosphere and will eventually concentrate near the midplane, in a layer whose thickness is not less than the minimum imposed by the vertical oscillations. A dead zone enriched in solids may provide a favorable environment for the growth of larger bodies. Many T Tauri systems show a combination of 10-m silicate emission and shallow millimeter spectral slope that is consistent with micron-sized grains in the disk atmosphere and millimeter-sized or larger particles in the interior, though it should be noted that the two wavelengths probe different distances from the star (D’Alessio et al., 2006; Pinte et al., 2008).
The turbulent and dead zones exchange dust and gas when turbulent motions overshoot the mutual boundary. The mixing extends about one scale height into the dead zone, as shown by the penetration of the dust-enriched material in figures 11 to 13. The motions can perhaps be described in terms of Alfvén waves driven by the breakup of channel flows in the disk atmosphere (Suzuki & Inutsuka, 2009). The net effect is a transfer of dust to the dead zone, because settling proceeds fastest in the disk atmosphere. During the early stages of the concentration of the solid material, turbulence thus speeds up settling. The turbulent layer will eventually become dust-free unless replenished through radial transport within the disk or rain-out from an outflow or from the circumstellar envelope.
Well-mixed micron or sub-micron grains with the interstellar mass fraction produce a dead zone reaching more than two scale heights from the midplane at 5 AU in the minimum-mass solar nebula. However, grains 10 m or larger yield a dead zone ending below one scale height. Turbulent mixing then penetrates to the midplane, consistent with the finding by Fromang & Papaloizou (2006) that diffusion adequately describes the effects of the gas motions on particles in a dead zone with a small vertical extent. While we were able to run the case with 1-m grains only about 60 orbits, the continuing loss of dust into the dead zone without resupply will ultimately yield a depletion factor in the surface layers exceeding the value of about ten needed for mixing to reach the midplane.
The rate at which mass flows through the patch of disk toward the star is the product of the turbulent layer depth with the mean accretion stress. Both these quantities increase with the grain size, the ionizing flux from the star, and the magnetic flux threading the disk. Depletion of the dust in the surface layers will have a similar effect to an increase in the grain size. The two-decade spread in accretion rate among T Tauri stars cannot easily be produced by grain growth and the observed spread in stellar X-ray output, but can be understood if in addition the objects have a modest range of disk magnetic field strengths. The mass accretion rate resulting from the magnetic stresses will vary with radius, leading to the build-up of material in some annuli (Armitage et al., 2001; Zhu et al., 2009), an effect not captured in our shearing-box calculations.
Apparently the stellar X-rays both increase the disk accretion rate within 5 AU (figure 6) and increase the rate at which material escapes from the disk into a photoevaporating wind at 10-40 AU (Drake et al., 2009). Furthermore the ionization of the inner disk could contribute to a wind driven by magnetic activity (Suzuki & Inutsuka, 2009). All these effects tend to reduce the surface density of gas in the planet-forming region faster around stars with high X-ray luminosities. Whether it is possible in this way to account for the tendency of non-accreting T Tauri stars to have higher X-ray luminosities (Neuhäuser et al., 1995; Stelzer & Neuhäuser, 2001; Flaccomio et al., 2003; Preibisch et al., 2005; Telleschi et al., 2007) or for an inverse correlation between X-ray luminosity and stellar accretion rate (Drake et al., 2009) remains unclear.
We suggest that the diversity in the mid-infrared silicate bands among classical T Tauri stars is a consequence of the concentration of solid material associated with planet formation. The growth of larger bodies requires a loss of dust, leading generally to a declining recombination cross-section. The smallest grains provide most of the recombination when the particles have a size spectrum appropriate for the interstellar medium (Sano et al., 2000), and will dominate still more in the disk atmosphere, where settling removes the larger grains. The disruption of aggregates through collisions (§4.3) thus slows the decline. However, unless the grains making up the aggregates also fragment so that the minimum particle size becomes smaller, the loss of cross-section is likely to continue, since even 1-m particles show appreciable settling in the turbulent disk atmosphere. The decreasing recombination rates will allow the active layers to expand into the disk interior, and if the mass column is not too great, turbulent mixing will eventually reach the midplane, returning the second-generation debris from planet formation to the atmosphere. Questions for future investigation include when and where the mixing reaches the midplane, and whether the observed correlation between the degree of settling and the crystalline mass fraction (Watson et al., 2009) can be explained by the return to the atmosphere of minerals formed near the midplane at high temperature and pressure in planetesimal interiors, impacts, or shocks. Any such correlation will be blurred by the fact that the degree of dust depletion required for mixing to reach the midplane depends on the column of gas, the X-ray luminosity of the star and the magnetic flux delivered to the disk from the surroundings.
The mid-infrared variability of protostellar disks has been proposed to arise from the changing illumination of dust in the disk atmosphere. Explaining timescales shorter than a week is a challenge, since the dust in the disks around young Solar-mass stars extends inward only to about 0.1 AU (Muzerolle et al., 2003; Akeson et al., 2005; Akeson, 2008), where the orbital period is 12 days. The results of the MHD calculations demonstrate that magnetic activity moves dust from place to place in the disk atmosphere on several timescales. The optical depth along rays grazing the surface of the patch of disk frequently varies by a factor two within a tenth of an orbit as regions of enhanced dust density pass by. Over longer time intervals of a few orbits, the photosphere moves up and down by as much as a scale height due to changes in the balance between settling and stirring. Clearly the effects of the magnetic activity on the dust distribution should be considered when attempting to understand the infrared variability. Properly accounting for the shadows cast on the disk surface requires models of the inner edge of the dust distribution, perhaps informed by the time-steady picture that has been developed for Herbig Ae stars (Dullemond et al., 2001; Isella & Natta, 2005). Our results suggest that magneto-rotational turbulence near the dust sublimation radius can cast shadows that vary over timescales as short as a day.
References
- Ábrahám et al. (2009) Ábrahám, P., Juhász, A., Dullemond, C. P. et al. 2009, Nature, 459, 224
- Akeson (2008) Akeson, R. L. 2008, Journal of Physics Conf. Ser. 131, 012019
- Akeson et al. (2005) Akeson, R. L., Boden, A. F., Monnier, J. D. et al. 2005, ApJ, 635, 1173
- Armitage et al. (2001) Armitage P. J., Livio M. & Pringle J. E. 2001, MNRAS, 324, 705
- Bai & Goodman (2009) Bai X.-N. & Goodman J. 2009, ApJ, 701, 737
- Balbus & Hawley (1991) Balbus, S. A., & Hawley, J. F. 1991, ApJ, 376, 214
- Balbus & Hawley (1998) Balbus, S. A., & Hawley, J. F. 1998, Rev. Mod. Phys., 70, 1
- Bary et al. (2009) Bary, J. S., Leisenring, J. M., & Skrutskie, M. F. 2009, ApJ, in press; arXiv:0910.3454
- Blaes & Balbus (1994) Blaes, O. M., & Balbus, S. A. 1994, ApJ, 421, 163
- Blum & Wurm (2008) Blum, J., & Wurm, G. 2008, ARA&A, 46, 21
- Bouwman et al. (2008) Bouwman, J., Henning, Th., Hillenbrand, L. A., et al. 2008, ApJ, 683, 479
- Burrows et al. (1996) Burrows, C. J., Stapelfeldt, K. R., Watson, A. M. et al. 1996, ApJ, 473, 437
- Chiang & Goldreich (1997) Chiang, E. I., & Goldreich, P. 1997, ApJ, 490, 368
- Chiang & Murray-Clay (2007) Chiang, E., & Murray-Clay, R. 2007, Nature Physics, 3, 604
- Chiang & Youdin (2009) Chiang, E., & Youdin, A. 2009, Annu. Rev. Earth Planetary Sci., in press; arXiv:0909.2652v2
- Cisowski & Hood (1991) Cisowski, S. M., & Hood, L. L. 1991, in “The Sun in Time”, ed. C. P. Sonett, M. S. Giampapa & M. S. Matthews (Tucson: Univ. of Arizona Press), 761
- Cotera et al. (2005) Cotera, A. S., Schneider, G., Hines, D. C., Whitney, B. A., Stapelfeldt, K. R., & Padgett, D. L. 2005, in proceedings of the conference “Protostars and Planets V”, LPI Contribution No. 1286., p. 8489
- D’Alessio et al. (2006) D’Alessio, P., Calvet, N., Hartmann, L., Franco-Hernández, R., & Servín, H. 2006, ApJ, 638, 314
- Drake et al. (2009) Drake, J. J., Ercolano, B., Flaccomio, E., & Micela, G. 2009, ApJ, 699, L35
- Dullemond & Dominik (2004) Dullemond, C. P., & Dominik, C. 2004, A&A, 421, 1075
- Dullemond et al. (2001) Dullemond, C. P., Dominik, C. & Natta, A. 2001, ApJ, 560, 957
- Durán-Rojas et al. (2009) Durán-Rojas, M. C., Watson, A. M., Stapelfeldt, K. R., & Hiriart, D. 2009, AJ, 137, 4330
- Flaccomio et al. (2003) Flaccomio, E., Damiani, F., Micela, G., Sciortino, S., Harnden, F. R., Jr., Murray, S. S., & Wolk, S. J. 2003, ApJ, 582, 398
- Muzerolle et al. (2009) Muzerolle, J., Flaherty, K., Balog, Z., et al. 2009, ApJ, 704, L15
- Fleming & Stone (2003) Fleming, T., & Stone, J. M. 2003, ApJ, 585, 908
- Fromang & Papaloizou (2006) Fromang, S., & Papaloizou, J. 2006, A&A, 452, 751
- Furlan et al. (2006) Furlan, E., Hartmann, L., Calvet, N. et al. 2006, ApJS, 165, 568
- Gammie (1996) Gammie, C. F. 1996, ApJ, 457, 355
- Garmire et al. (2000) Garmire, G., Feigelson, E. D., Broos, P., Hillenbrand, L. A., Pravdo, S. H., Townsley, L., & Tsuboi, Y. 2000, AJ, 120, 1426
- Glassgold et al. (1997) Glassgold, A. E., Najita, J., & Igea, J. 1997, ApJ, 480, 344
- Glassgold et al. (2004) Glassgold, A. E., Najita, J., & Igea, J. 2004, ApJ, 615, 972
- Goldreich & Ward (1973) Goldreich, P., & Ward, W. R. 1973, ApJ, 183, 1051
- Hartmann et al. (2006) Hartmann, L., D’Alessio, P., Calvet, N., & Muzerolle, J. 2006, ApJ, 648, 484
- Hawley, Gammie, & Balbus (1995) Hawley, J. F., Gammie, C. F., & Balbus, S. A. 1995, ApJ, 440, 742
- Hawley & Stone (1998) Hawley, J. F., & Stone, J. M. 1998, ApJ, 501, 758
- Hayashi et al. (1985) Hayashi, C., Nakazawa, K., & Nakagawa, Y. 1985, in: Black, D. C., & Matthews, M. S., Editors. Protostars and Planets II (Univ. of Arizona Press: Tucson), 1100
- Igea & Glassgold (1999) Igea, J., & Glassgold, A. E. 1999, ApJ, 518, 848
- Ilgner & Nelson (2006) Ilgner, M., & Nelson, R. P. 2006, A&A, 445, 205
- Isella & Natta (2005) Isella, A., & Natta, A. 2005, A&A, 438, 899
- Jin (1996) Jin, L. 1996, ApJ, 457, 798
- Johansen & Klahr (2005) Johansen, A., & Klahr, H. 2005, ApJ, 634, 1353
- Kamp & Dullemond (2004) Kamp, I., & Dullemond, C. P. 2004, ApJ, 615, 991
- Kim & Ostriker (2000) Kim, W.-T., & Ostriker, E. C. 2000, ApJ, 540, 372
- Luhman et al. (2008) Luhman, K. L., Allen, L. E., Allen, P. R., Gutermuth, R. A., Hartmann, L., Mamajek, E. E., Megeath, S. T., Myers, P. C., & Fazio, G. G. 2008, ApJ, 675, 1375
- Luhman et al. (2009) Luhman, K. L., Mamajek, E. E., Allen, P. R., & Cruz, K. L. 2009, ApJ, 703, 399
- Miller & Stone (2000) Miller, K. A., & Stone, J. M. 2000, ApJ, 534, 398
- Muzerolle et al. (2003) Muzerolle, J., Calvet, N., Hartmann, L., & D’Alessio, P. 2003, ApJ, 597, L149
- Muzerolle et al. (2005) Muzerolle, J., Luhman, K. L, Briceño, C., Hartmann, L., & Calvet, N. 2005, ApJ, 625, 906
- Nakagawa et al. (1981) Nakagawa, Y., Nakazawa, K., & Hayashi, C. 1981, Icarus, 45, 517
- Nakagawa et al. (1986) Nakagawa, Y., Sekiya, M., & Hayashi, C. 1986, Icarus, 67, 375
- Neuhäuser et al. (1995) Neuhäuser, R., Sterzik, M. F., Schmitt, J. H. M. M., Wichmann, R., & Krautter, J. 1995, A&A, 297, 391
- Oppenheimer & Dalgarno (1974) Oppenheimer, M., & Dalgarno, A. 1974, ApJ, 192, 29
- Ormel & Cuzzi (2007) Ormel, C. W., & Cuzzi, J. N. 2007, A&A, 466, 413
- Pessah et al. (2007) Pessah, M. E., Chan, C., & Psaltis, D. 2007, ApJ, 668, L51
- Pinte et al. (2008) Pinte, C., Padgett, D. L., Ménard, F., et al. 2008, A&A, 489, 633
- Preibisch et al. (2005) Preibisch, Th., Kim, Y.-C., Favata, F., et al. 2005, ApJS, 160, 401
- Preibisch et al. (1993) Preibisch, Th., Ossenkopf, V., Yorke, H. W., & Henning, Th. 1993, A&A, 279, 577
- Sano & Inutsuka (2001) Sano, T., & Inutsuka, S. 2001, ApJ, 561, L179
- Sano et al. (2004) Sano, T., Inutsuka, S., Turner, N. J., & Stone, J. M. 2004, ApJ, 605, 321
- Sano et al. (2000) Sano, T., Miyama, S. M., Umebayashi, T., & Nakano, T. 2000, ApJ, 543, 486
- Sano & Stone (2002a) Sano, T., & Stone, J. M. 2002a, ApJ, 570, 314
- Sano & Stone (2002b) Sano, T., & Stone, J. M. 2002b, ApJ, 577, 534
- Saumon & Guillot (2004) Saumon, D., & Guillot, T. 2004, ApJ, 609, 1170
- Schegerer et al. (2006) Schegerer, A., Wolf, S., Voshchinnikov, N. V., Przygodda, F., & Kessler-Silacci, J. E. 2006, A&A, 456, 535
- Stapelfeldt et al. (2003) Stapelfeldt, K. R., Ménard, F., Watson, A. M., Krist, J. E., Dougados, C., Padgett, D. L., & Brandner, W. 2003, ApJ, 589, 410
- Stelzer & Neuhäuser (2001) Stelzer, B., & Neuhäuser, R. 2001, A&A, 377, 538
- Stone & Norman (1992a) Stone, J. M., & Norman, M. L. 1992a, ApJS, 80, 753
- Stone & Norman (1992b) Stone, J. M., & Norman, M. L. 1992b, ApJS, 80, 791
- Suzuki & Inutsuka (2009) Suzuki, T. K., & Inutsuka, S. 2009, ApJ, 691, L49
- Telleschi et al. (2007) Telleschi, A., Güdel, M., Briggs, K. R., Audard, M., & Palla, F. 2007, A&A, 468, 425
- Turner et al. (1997) Turner, N. J., Bodenheimer, P., & Bell, K. R. 1997, ApJ, 480, 754
- Turner et al. (2006) Turner, N. J., Willacy, K., Bryden, G., & Yorke, H. W. 2006, ApJ, 639, 1218
- Turner et al. (2007) Turner, N. J., Sano, T. & Dziourkevitch, N. 2007, ApJ, 659, 729
- Turner & Drake (2009) Turner, N. J., & Drake, J. F. 2009, ApJ, 703, 2152
- Wardle (2007) Wardle, M. 2007, Ap&SS, 311, 35
- Watson & Stapelfeldt (2004) Watson, A. M., & Stapelfeldt, K. R. 2004, ApJ, 602, 860
- Watson & Stapelfeldt (2007) Watson, A. M., & Stapelfeldt, K. R. 2007, AJ, 133, 845
- Watson et al. (2009) Watson, D. M., Leisenring, J. M., Furlan, E. et al. 2009, ApJS, 180, 84
- Weidenschilling (1980) Weidenschilling, S. J. 1980, Icarus, 44, 172
- Wooden et al. (2000a) Wooden, D. H., Harker, D. E., & Woodward, C. E. 2000, in “Thermal Emission Spectroscopy and Analysis of Dust, Disks and Regoliths”, ASP Conf. Ser. 196, ed. Sitko, M. L., Sprague, A. L., & Lynch, D. K. (San Francisco: Astronomical Society of the Pacific), 99
- Wooden et al. (2000b) Wooden, D. H., Bell, K. R., Harker, D. E., & Woodward, C. E. 2000, BAAS, 32, 1482
- Woodward et al. (2004) Woodward, C. E., Wooden, D. H., Harker, D. E., Bell, K. R., Butner, H. M., Sitko, M. L., Lynch, D., & Russell, R. 2004, in: “Debris Disks and the Formation of Planets: A Symposium in Memory of Fred Gillett”, ASP Conf. Ser. 324, ed. Caroff, L., Moon, L. J., Backman, D., & Praton, E. (San Francisco: Astronomical Society of the Pacific), 224
- Yorke (1986) Yorke, H. W. 1986, in: “Astrophysical Radiation Hydrodynamics”, ed. Winkler, K.-H. A., & Norman, M. L., (Dordrecht: D. Reidel), 141
- Zhu et al. (2009) Zhu, Z., Hartmann, L., & Gammie, C. 2009, ApJ, 694, 1045