Measurements of Differential +jet+X Cross Sections with the DØ Detector
Sabine Lammers (on behalf of of the DØ collaboration)
Department of Physics, Indiana University, Bloomington, IN 47405, USA
Abstract
We present measurements of differential cross sections in inclusive plus jet production in a data sample of 1 collected with the DØ detector in proton antiproton collisions at
= 1.96 TeV. Measured variables include the transverse momentum () and rapidity ( ), the leading jet transverse momentum () and rapidity ( ), as well as various
angles of the Z+jet system. We compare the results to different Monte Carlo event generators and
next-to-leading order perturbative QCD (NLO pQCD) predictions, with non-perturbative corrections applied.
I Introduction
To make discoveries at the Tevatron and the LHC, background processes will need to be measured and simulated with a level of accuracy that will be comparable to the signficance of those new physics signals. There are several programs on the market that can simulate hadronic interactions at next-to-leading order (NLO) accuracy, but the processes included in these programs are limited. Matrix element plus parton shower (MEPS) programs simulate a more comprehensive set of processes, typically at leading-log (LL) or leading order (LO), and rely on models to simulate emissions and fragmentation associated with higher order processes. These programs have been employed regularly for background simulation at the Tevatron in recent years, notably in the Higgs searches Abazov:2007hk and the discovery of the production of single top quarks Abazov:2009ii .
Measurements of + jets processes are valuable for two principle reasons.
production provides a hard scale, which, along with associated jet production, is an ideal environment to test perturbative QCD (pQCD). The leptonic decay of the provides a clean signal for reconstruction of the events, and small background contamination. The test of pQCD is made by comparing the measurements to NLO pQCD predictions. + jets also makes up a major background of many new physics searches at both the Tevatron and LHC. Therefore, these data measurements unfolded to the particle level are useful for tuning LO simulation programs which are heavily relied upon to model background processes.
The Tevatron measurements presented here of + jets differential cross sections are compared to predictions by NLO pQCD in MCFM Campbell:2002tg , MEPS programs ALPGENMangano:2002ea and SHERPAGleisberg:2008ta , and PS programs HERWIGCorcella:2000bw and PYTHIASjostrand:2000wi . The measurements have either been published Abazov:2008ez Abazov:2009av or have been submitted for publication Abazov:2009pp at the time these proceedings were written. ALPGEN employs the MLM algorithm to ensure jets originating from the matrix element and the parton shower are not double counted. SHERPA is a CKKW-inspired model which uses a reweighting of the matrix elements to achieve the same appropriate jet configurations. A detailed description of these programs can be found in Alwall .
II Data Selection
The measurements are made with the DØ detector, which is described in detail elsewhere Abazov:2005pn . The analyses were performed in the and decay channels. focused on the Z+1 jet inclusive events, and differential cross sections were made in a variety of variables, including many angular variables involving the decay objects. The analysis focused on differential cross section measurements as a function of , in the 1, 2 and 3 jet inclusive samples. In both channels, the data are corrected to particle level to eliminate the effects arising from detector resolution and efficiency. In order to keep these corrections small, a limited particle level phase space for the measurements was chosen that corresponds closely to the detector level selection cuts. Some effort was made to keep the particle level phase space in the and channels close, but some differences exist due to the different nature and detector manifestations of electrons and muons. At particle level, the is reconstructed using the two highest leptons, and the jets are reconstructed using the DØ RunII Midpoint Cone algorithm with a cone radius R=0.5. In the analysis, the particle level phase space is defined with the following restrictions:
•
GeV
•
GeV
•
•
In the analysis, the particle level phase space is defined with the following restrictions:
•
GeV
•
GeV
•
III Theoretical Predictions
Due to the evolving nature of theoretical predictions, the programs used to compare to the data are not consistent in all distributions. This is due to the fact that the data are published at different times, and effort is made to always compare to the most up-to-date theoretical predictions. Next-to-leading order perturbative QCD (NLO pQCD) predictions are calculated using the program MCFM; parton-to-hadron corrections are applied to the MCFM predictions, as calculated by PYTHIA.
The meausurements of + jets are compared to different predictions than those compared in the + jets measurements. The programs and their version numbers are summarized in Table 1.
Table 1: Theoretical predictions and their versions for and + jets data comparisons.
Program
MCFM
5.4
5.3
ALPGEN
2.13
2.13
SHERPA
1.1.3
1.1.1
PYTHIA
6.420
6.416111PYTHIA 6.325 is used for interfacing ALPGEN with parton showers
HERWIG
6.510
6.510
IV Results
Particle level differential cross sections as functions of a variety of variables are shown in Figures 1-13 for + jets events. Figures 1-4 and 8-13 illustrate measurements that were made in the decay channel, while Figures 5-7 show measurements that were made in the decay channel.
Figures 8, 10 and 12 consider + jets events in the restricted range 25 GeV, while Figures 9, 11 and 13 restrict this range further to 45 GeV. These restrictions are made to reduce the dependence on the underlying event and multiple interactions. All results are made with + 1 jet inclusive samples. The results examine the + 1, 2 and 3 jet inclusive samples. A good description of the data by NLO pQCD is found in all distributions, taking into account the experimental and theoretical uncertainties. SHERPA generally gives the best and most consistent description of the angular distributions, although the normalization of the data is not reproduced. The description of the data by the LO MC models is mixed. All LO MC models suffer from large scale uncertainties which impair their ability to make precise predictions.
V Conclusions
Several differential cross sections of + jet + X events measured with the DØ detector have been presented. The data are generally consistent with predictions from NLO pQCD, although some LO programs can reproduce the shape of the data better than NLO, due either to their inclusion of higher parton multiplicity matrix elements than can be currently included in a fixed order pQCD calculation, or an optimized tune of the Monte Carlo. These data should be useful for continued tuning of these and other Monte Carlo programs.
Acknowledgements.
The author would like to thank Gavin Hesketh for providing the plots with updated theoretical predictions and for general good humor.
References
(1)
V. M. Abazov et al. [D0 Collaboration],
Phys. Lett. B 663, 26 (2008)
[arXiv:0712.0598 [hep-ex]].
(2)
V. M. Abazov et al. [D0 Collaboration],
Phys. Rev. Lett. 103, 092001 (2009)
[arXiv:0903.0850 [hep-ex]].
(3)
J. M. Campbell and R. K. Ellis,
Phys. Rev. D 65, 113007 (2002)
[arXiv:hep-ph/0202176].
(4)
M. L. Mangano, M. Moretti, F. Piccinini, R. Pittau and A. D. Polosa,
JHEP 0307, 001 (2003)
[arXiv:hep-ph/0206293].
(5)
T. Gleisberg, S. Hoche, F. Krauss, M. Schonherr, S. Schumann, F. Siegert and J. Winter,
JHEP 0902, 007 (2009)
[arXiv:0811.4622 [hep-ph]].
(6)
G. Corcella et al.,
JHEP 0101, 010 (2001)
[arXiv:hep-ph/0011363].
(7)
T. Sjostrand, P. Eden, C. Friberg, L. Lonnblad, G. Miu, S. Mrenna and E. Norrbin,
Comput. Phys. Commun. 135, 238 (2001)
[arXiv:hep-ph/0010017].
(8)
V. M. Abazov et al. [D0 Collaboration],
Phys. Lett. B 669, 278 (2008)
[arXiv:0808.1296 [hep-ex]].
(9)
V. M. Abazov et al. [D0 Collaboration],
Phys. Lett. B 678, 45 (2009)
[arXiv:0903.1748 [hep-ex]].
(10)
V. M. Abazov et al. [D0 Collaboration],
arXiv:0907.4286 [hep-ex].
(11)
J. Alwall et al.,
“Comparative study of various algorithms for the merging of parton showers
and matrix elements in hadronic collisions,”
Eur. Phys. J. C 53, 473 (2008)
[arXiv:0706.2569 [hep-ph]].
(12)
V. M. Abazov et al. [D0 Collaboration],
Nucl. Instrum. Meth. A 565, 463 (2006)
[arXiv:physics/0507191].
(13)
T. Aaltonen et al. [CDF - Run II Collaboration],
Phys. Rev. Lett. 100, 102001 (2008)
[arXiv:0711.3717 [hep-ex]].
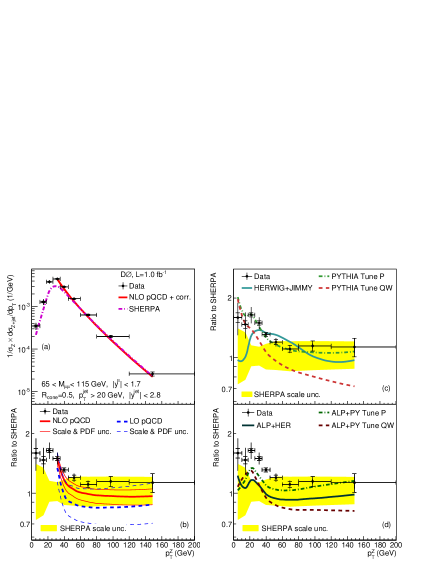
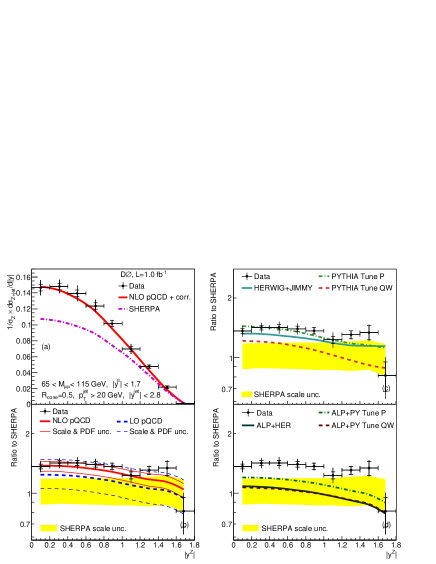
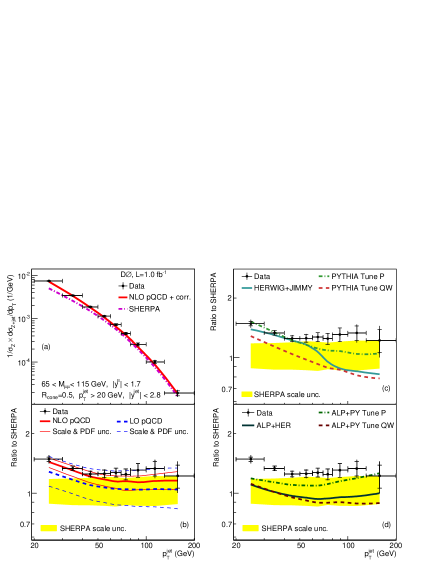
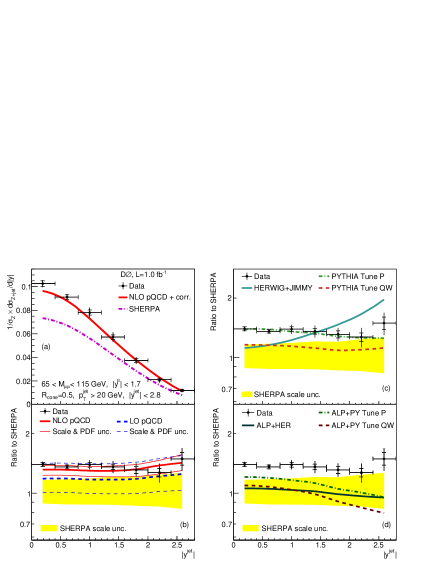
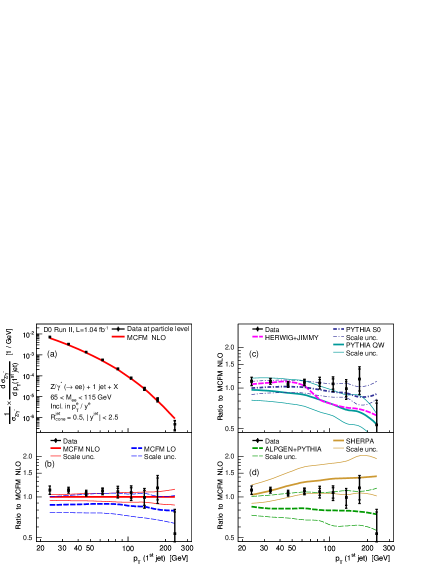
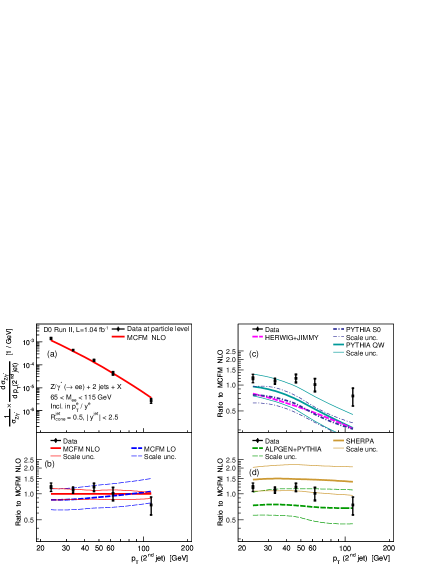
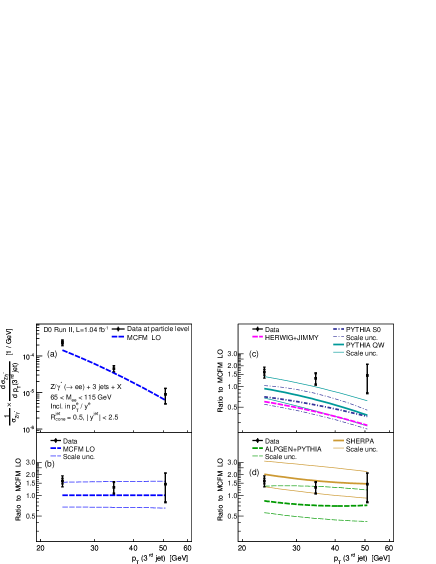
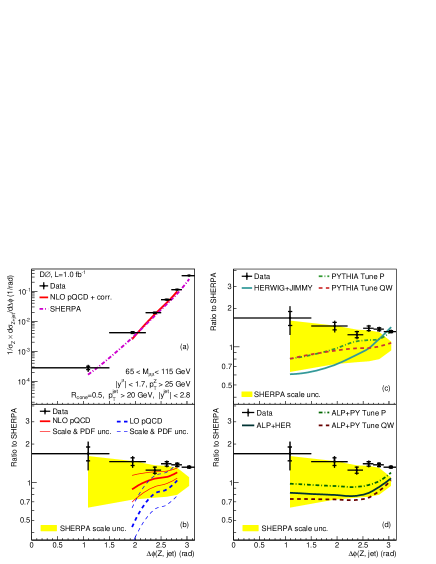
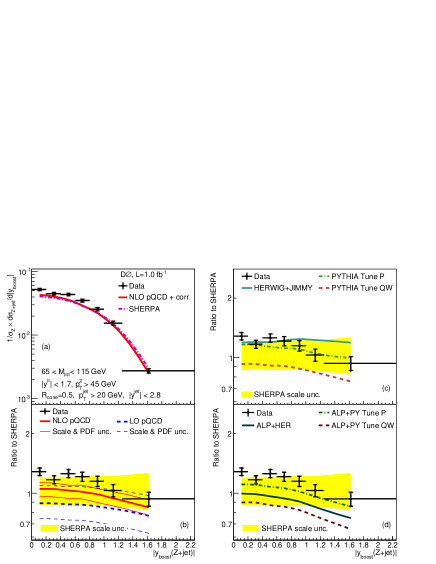
Figure 1: The measured cross section in bins of leading for + jet + X events, and predictions from NLO pQCD and SHERPA are shown in the upper left plot. The ratio of data to SHERPA are shown in the lower left plot. The ratio of LO and NLO MCFM predictions to SHERPA and associated scale and PDF uncertainties are also shown in the lower left plot. The ratio of PYTHIA and HERWIG+JIMMY to SHERPA are shown in the upper right plot. The ratio ofALPGEN+PYTHIA and ALPGEN+HERWIG to SHERPA are shown in the lower right plot. The ratio of data to SHERPA are included in all plots for comparison. Figure 2: The measured cross section in bins of leading for + jet + X events, and predictions from NLO pQCD and SHERPA are shown in the upper left plot. The ratio of data to SHERPA are shown in the lower left plot. The ratio of LO and NLO MCFM predictions to SHERPA and associated scale and PDF uncertainties are also shown in the lower left plot. The ratio of PYTHIA and HERWIG+JIMMY to SHERPA are shown in the upper right plot. The ratio ofALPGEN+PYTHIA and ALPGEN+HERWIG to SHERPA are shown in the lower right plot. The ratio of data to SHERPA are included in all plots for comparison. Figure 3: The measured cross section in bins of leading for + jet + X events, and predictions from NLO pQCD and SHERPA are shown in the upper left plot. The ratio of data to SHERPA are shown in the lower left plot. The ratio of LO and NLO MCFM predictions to SHERPA and associated scale and PDF uncertainties are also shown in the lower left plot. The ratio of PYTHIA and HERWIG+JIMMY to SHERPA are shown in the upper right plot. The ratio ofALPGEN+PYTHIA and ALPGEN+HERWIG to SHERPA are shown in the lower right plot. The ratio of data to SHERPA are included in all plots for comparison. Figure 4: The measured cross section in bins of leading for + jet + X events, and predictions from NLO pQCD and SHERPA are shown in the upper left plot. The ratio of data to SHERPA are shown in the lower left plot. The ratio of LO and NLO MCFM predictions to SHERPA and associated scale and PDF uncertainties are also shown in the lower left plot. The ratio of PYTHIA and HERWIG+JIMMY to SHERPA are shown in the upper right plot. The ratio ofALPGEN+PYTHIA and ALPGEN+HERWIG to SHERPA are shown in the lower right plot. The ratio of data to SHERPA are included in all plots for comparison. Figure 5: The measured cross section for + 1 jet + X events in bins of leading . Predictions from NLO pQCD are compared to the data in the upper left plot. The ratio of data and several LO programs to MCFM NLO are shown in the other plots. MCFM NLO predictions agree with the data. The data can be described by a selection of the LO programs, although there is a lot of freedom in the predictions due to the choice of PDF, renormalization and factorization scale, tune and underlying event model.Figure 6: The measured cross section for + 2 jet + X events in bins of the second leading . Predictions from NLO pQCD are compared to the data in the upper left plot. The ratio of data and several LO programs to MCFM NLO are shown in the other plots. MCFM NLO predictions agree with the data. The data can be described by a selection of the LO programs, although there is a lot of freedom in the predictions due to the choice of PDF, renormalization and factorization scale, tune and underlying event model.Figure 7: The measured cross section for + 3 jet + X events in bins of the third leading . Predictions from NLO pQCD are compared to the data in the upper left plot. The ratio of data and several LO programs to MCFM NLO are shown in the other plots. MCFM NLO predictions agree with the data. The data can be described by a selection of the LO programs, although there is a lot of freedom in the predictions due to the choice of PDF, renormalization and factorization scale, tune and underlying event model.Figure 8: The measured cross section in bins of between the and leading jet for + jet + X events with larger than 25 GeV. Predictions from NLO pQCD and SHERPA are compared to the data in the upper left plot. The ratio of data and predictions from NLO pQCD, ALPGEN, HERWIG and PYTHIA to the prediction from SHERPA are shown in the lower plots. The shape of the distribution is best described by SHERPA, but there is a normalization disparity. Figure 9: The measured cross section in bins of between the and leading jet for + jet + X events with larger than 45 GeV. The restricted range is chosen to isolate the measurement from biases due to the underlying event. Predictions from NLO pQCD and SHERPA are compared to the data in the upper left plot. The ratio of data and predictions from NLO pQCD, ALPGEN, HERWIG and PYTHIA to the prediction from SHERPA are shown in the lower plots. Figure 10: The measured cross section in bins of between the and leading jet for + jet + X events with larger than 25 GeV. Predictions from NLO pQCD and SHERPA are compared to the data in the upper left plot. The ratio of data and predictions from NLO pQCD, ALPGEN, HERWIG and PYTHIA to the prediction from SHERPA are shown in the lower plots. Figure 11: The measured cross section in bins of between the and leading jet for + jet + X events with larger than 45 GeV. The restricted range is chosen to isolate the measurement from biases due to the underlying event. Predictions from NLO pQCD and SHERPA are compared to the data in the upper left plot. The ratio of data and predictions from NLO pQCD, ALPGEN, HERWIG and PYTHIA to the prediction from SHERPA are shown in the lower plots. Figure 12: The measured cross section in bins of for + jet + X events with larger than 25 GeV, where is the average rapidity of the reconstructed Z boson and the leading jet rapidity. Predictions from NLO pQCD and SHERPA are compared to the data in the upper left plot. The ratio of data and predictions from NLO pQCD, ALPGEN, HERWIG and PYTHIA to the prediction from SHERPA are shown in the lower plots. The shape of the distribution is best described by SHERPA, but there is a normalization disparity. Figure 13: The measured cross section in bins of for + jet + X events with larger than 45 GeV. Predictions from NLO pQCD and SHERPA are compared to the data in the upper left plot. The ratio of data and predictions from NLO pQCD, ALPGEN, HERWIG and PYTHIA to the prediction from SHERPA are shown in the lower plots.