Dust Processing and Mineralogy in Protoplanetary Accretion Disks
In this chapter we discuss the different dust components a protoplanetary disk is made of with a special emphasis on grain composition, size and structure. The paper will highlight the role these dust grains play in protoplanetary disks surrounding young stars, as well as observational results supporting this knowledge. First, the path dust travels from the interstellar medium into the circumstellar disk is described. Then dust condensation sequences from the gas are introduced, to determine the most likely species that occur in a disk. The characteristics of silicates are handled in detail: composition, lattice structure, magnesium to iron ratio and spectral features. The other main dust-forming component of the interstellar medium, carbon, is presented in its many forms, from molecules to more complex grains. Observational evidence for polycyclic aromatic hydrocarbons (PAHs) is given for both young stars and solar system material. We show how light scattering theory and laboratory data can be used to provide the optical properties of dust grains. From the observer’s point of view, we discuss how infrared spectra can be used to derive dust properties, and present the main spectral analysis methods currently used and their limitations. Observational results, determining the dust properties in protoplanetary disks, are given: first for the bright intermediate-mass Herbig Ae/Be stars, and then for the lower-mass Tauri stars and brown dwarfs. Here we present results from the space observatories ISO and Spitzer, as well as from the mid-infrared interferometer VLTI, and summarise the main findings. We discuss observational evidence for grain growth in both Herbig Ae/Be and T Tauri stars, and its relation with spectral type and dust settling. We conclude with an outlook on future space missions that will open new windows, towards longer wavelengths and even fainter objects.
1 Introduction
Dust grains dominate the opacity in protoplanetary disks whenever they are present. This implies that their radiation properties play a crucial role in determining the temperature and density structure of these disks. The initial population of (sub)micron-sized particles evolves over time towards planetesimals, eventually providing the building blocks for terrestrial planets.
The dust grains shield the interior of protoplanetary disks from energetic cosmic particles and stellar X-ray radiation and provide the surface for electron recombination. This regulates the ionization structure of disks, which is an important ingredient for the magneto-rotational instability to operate and to drive angular momentum transport. The dust particles are equally important for disk chemistry because chemistry on grain surfaces leads to the formation of molecular ices and, possibly, complex organic molecules, which will enter the gas phase when their evaporation temperature is reached.
Infrared spectroscopy is a powerful tool to characterize the properties of protoplanetary dust. With ground-based telescopes, the Infrared Space Observatory ISO and the Spitzer Space Telescope, an enormous amount of data has been obtained to characterize the mineralogy of disks around a variety of objects, ranging in luminosity from Herbig Ae/Be stars to T Tauri stars, and even brown dwarfs. These data allow us to put constraints on the chemical composition and amorphous/crystalline state of the dust particles, and to address questions such as radial distribution and mixing processes. Mid-infrared long-baseline interferometry is starting to contribute as well to our understanding of the structural properties of dust in the different radial zones of protoplanetary disks.
2 Dust Components in Protoplanetary Disks
2.1 General Overview
As the infalling disk material originates from the interstellar medium (ISM), more precisely from the parental molecular cloud core, the initial dust composition in a protoplanetary accretion disk is assumed to be similar to the molecular cloud dust composition. It can be slightly altered from this composition, as volatile molecular ices could evaporate during the passage of the accretion shock front, oxygen could convert into water and quartz (SiO2) could form from silicon atoms. For a detailed discussion of the various dust populations in space, including dust in molecular clouds, we refer to the review by Dorschner & Henning (1995). The most abundant cosmic dust species are compounds of O, Si, Mg, Fe, and C: silicates and carbonaceous dust.
Depending on the angular momentum of the material, molecular cloud dust will accrete onto the disk at different radial distances from the star, which may influence subsequent grain evolution (Dullemond et al. 2006). In protoplanetary disks, a whole range of modification processes are expected to occur, ranging from thermal annealing in hot regions of the inner disk, ion irradiation by stellar flares, X-ray and UV irradiation, destruction of carbonaceous dust by oxidation close to the central star, equilibration with the gas through sublimation-condensation processes and solid-phase reactions, as well as molecular ice formation in the outer disk. In addition, grain growth and both radial and vertical mixing processes need to be considered, leading to the expectation that the grain composition changes both over time and with radial distance from the star, so that a relatively large diversity of dust compositions can be expected in protoplanetary disks.
As a reference for the composition of protoplanetary dust in the outer disk regions, the dust model introduced by Pollack et al. (1994) is widely used. It is based on the solar elemental composition and the ISM gas depletion pattern, the composition of primitive solar system material, including the mass-spectroscopy results of the space probes to comet Halley, and theoretical considerations. The model contains the iron-magnesium silicate minerals olivines and pyroxenes, quartz, metallic iron, troilite (FeS), volatile and refractory organics, as well as water ice in the outer disk. The authors already noted that the silicates are certainly mixtures of amorphous and crystalline silicates, with the amorphous silicates dominating. In fact, they used the optical constants of amorphous silicates at mid-infrared wavelengths as a pragmatic choice. The dust model divides the products of the most abundant dust-forming elements O, C, Si, Mg, Fe, S, and N into three categories: gases, molecular ices, and refractory grains. Based on the dust composition and the optical properties of these various components, Pollack et al. (1994) also derived dust opacities for disks. They were further improved by including dust aggregates (Henning & Stognienko 1996), as well as updated optical data for the various materials (Semenov et al. 2003).
Molecular ices only exist in the cold outer disk, while FeS forms from Fe and H2S at condensation temperatures of 680 K. Besides water ice, also CO, CO2, NH3, CH4, and CH3OH ices have been detected in the infrared spectra of disks (Pontoppidan et al. 2005, Zasowski et al. 2008).
The exact fractional abundance of the various solids remains an open question. In general, we would expect a radial variation of the dust composition, as already mentioned for Fe/FeS and molecular ices. As another example, carbonaceous dust should be destroyed in the inner disk when evolving towards an equilibrium dust mixture under oxygen-rich conditions.
The bulk of the ISM/molecular cloud dust consists of amorphous silicates and amorphous carbonaceous material. ISO observations around 10 micron have shown that most of the silicates ( 98% by mass) in the ISM have an amorphous structure (e.g. Kemper et al. 2004). In contrast, infrared spectroscopy of Herbig Ae/Be stars, T Tauri stars and brown dwarfs has demonstrated that a significant fraction of the dust in protoplanetary disks is in a crystalline state, implying that these crystals have been formed inside the disks (see Sect. 5). Amorphous silicates only crystallize at relatively high temperatures through thermal annealing processes (e.g. Fabian et al. 2000), suggesting that these materials have experienced high temperatures in the disks (typically 800–1000 K).
In an actively accreting disk, the main accretion flow points to the star and most of the dust will be destroyed by sublimation and subsequently incorporated in the star. Once the main accretion phase has terminated and the star has grown close to its final mass, the material will only slowly move inwards. In both cases, the dust grains will experience an increase in temperature when approaching the star. This will lead to both (1) annealing of the amorphous material into a more crystalline structure and (2) chemical processing through evaporation and re-condensation, herewith changing the abundance of the different species. It is important to remember that the dust species are the main source of the opacities, which determine the disk structure. So when chemical processing or sublimation causes a certain dust species to disappear, a change in the opacities will occur, with consequences for the structure of the disk.
2.2 Condensation of dust
Condensation sequences of dust from the gas phase are often based on chemical equilibrium calculations, starting from the early studies by Larimer (1967), Grossman (1972), Lattimer et al. (1978) to the more recent investigations by Gail (1998) and Krot (2000). Although the gas-dust mixture may often not be in a state of chemical equilibrium, these calculations are a useful tool to predict which dust species can be expected in the considered elemental gas mixture.
Gail (1998; see also Gail 2003 for a comprehensive discussion) proposed a scheme to determine the stable dust materials expected to be present in a disk. It starts from the - vaporized into the gas phase - dust mixture from Pollack et al. (1994), and is based on chemical equilibrium considerations. The most important parameters in this scheme are the temperature and the pressure, which critically depend on the location in the disk; as a consequence, the stability of a certain dust species (hence its presence) will be radially dependent. To summarize Gail’s results, we will give an overview of the condensates that are expected to be stable at a certain temperature, starting from the outer disk region and moving inwards:
-
•
At low temperatures (below 700 K), FeS (troilite) will be formed and is stable, with the remaining iron (excess Fe over S) contained in pure iron particles. Silicon will be in magnesium-rich amorphous silicates, while SiO2 is found to be unstable in chemical equilibrium.
-
•
At higher temperatures (around 800 K), FeS will disappear and contribute to metallic iron, while amorphous silicates will anneal into crystalline silicates.
-
•
At even higher temperatures (1300-1400 K), both crystalline silicates and solid iron can no longer survive and are destroyed; the last remaining dust particles are aluminium-rich species such as corundum (Al2O3).
-
•
Above 1850 K also these last remaining dust species can no longer survive.
From a comparison with dust condensation experiments by e.g. Nuth and Donn (1982), it is also known that also non-equilibrium processes must play a role in the formation of dust (e.g. Tielens et al. 2005). Unfortunately, condensation paths which also include kinetic considerations are not yet available (e.g. Gail 2003), mainly due to the lack of reaction rates. This is especially true for the first step in the dust formation process in oxygen-rich environments, the nucleation of tiny seed particles from the gas phase.
However, the predictions based on the chemical equilibrium considerations are already in relatively good agreement with observations. In a more refined model, Gail (2004) added radial mixing, moving processed material from the inner disk to more outward regions. We should also note that several additional dust components can exist in the temperature-density regime of protoplanetary disks, including Al- and Ca-containing compounds such as hibonite (CaAl12O19) and spinel (MgAl2O4).
2.3 Silicates
Silicates form a diverse class of materials, ranging from amorphous and glass-like structures, characterized by three-dimensional disordered networks, to well-ordered crystals (e.g. Colangeli et al. 2003, Henning 2009). The different silicates are assembled by linking the corners of individual [SiO4]4- tetrahedra through their oxygen atoms with different levels of complexity. The negative net charge of the ion group must be balanced by metal or hydrogen cations to produce an electrically neutral compound. The cations are dispersed between the individual tetrahedra or the tetrahedra arrays. Mineral structures that have been extensively discussed in the context of protoplanetary dust are Mg-Fe olivines and pyroxenes. Olivines with the composition Mg2xFe2(1-x)SiO4 can be considered as a solid solution of their end members forsterite (Mg2SiO4) and fayalite (Fe2SiO4). Pyroxene with the composition of MgxFe(1-x)SiO3 is a solid solution formed from enstatite (MgSiO3) and ferrosilite (FeSiO3). The lattice structures of olivines and pyroxenes are very different: olivines are island silicates (nesosilicates) with isolated tetrahedra, while pyroxenes are chain silicates (inosilicates) in which one oxygen atom of every tetrahedron is shared with its neighbor. We should explicitly note that the terminology of olivines and pyroxenes refers to crystal structures and should not be used for amorphous silicates of the same chemical composition. The silicate particles show a wide variety of infrared features, characteristic of their chemical composition and structure, as is shown for the wavelength range between 8 and 13 m in Fig. 1, where we also show an example of a template with PAH features.

In the equilibrium calculations for the inner disk by Gail (1998), iron is seldom found to be incorporated in silicates, so that only the magnesium-rich end-members of the compounds are present: forsterite (Mg2SiO4) for the olivines and enstatite (MgSiO3) for the pyroxenes. Enstatite appears to be the most stable of those two, with forsterite only appearing in a narrow temperature range, just below the stability limit. It is thus predicted that in a disk, enstatite is the dominating component of the crystalline silicates, and forsterite is only important in the more inward regions of the disk, near the region where it becomes too hot to survive (around 1400 K). However, Gail (2004) cautions that the high enstatite abundance he predicts might need to be lowered, as the forsterite-enstatite conversion might be too slow to reach complete chemical equilibrium within the relevant timescales involved. We will discuss the enstatite to forsterite ratio, as determined from observations in Sect. 5.
The Mg/Fe ratio of the amorphous silicates located in the outer regions of protoplanetary disks is not well-constrained. In the Pollack et al. (1994) dust model, an average value of 0.3 was assumed for the Fe/(Fe+Mg) ratio, guided by the mass-spectroscopy results of comet Halley dust (Jessberger et al. 1989), as well as results obtained for anhydrous chondritic porous interplanetary dust particles (CP IDP; Bradley et al. 1988) that were collected in the stratosphere. Such IDPs consist mainly of GEMS (Glass with Embedded Metal and Sulfides), whose properties are consistent with that of interstellar amorphous silicates (Bradley et al. 1994). However, their origin is currently under debate: Bradley et al. (2008) argue that they are of presolar nature, as some of the GEMS have a non-solar isotopic composition and the ISM dust is anyway only for a small part characterized by non-solar isotopic composition, while Min et al. (2007) argue that most of them were formed in the solar system. From an analysis of the shape and position of interstellar silicate features, Min et al. (2007) concluded that interstellar silicates are predominantly Mg-rich. However, the interplay between shape and composition in determining the relatively broad infrared features of amorphous silicates introduces quite some uncertainty in such an analysis (see, e.g., Chiar & Tielens 2006 for different conclusions). So far, in the analysis of protoplanetary disk spectra, mainly amorphous silicates with a mixed Fe/Mg ratio have been used (e.g. Bouwman et al. 2001, Kessler-Silacci et al. 2006). Therefore, a detailed examination of high-quality spectra, taking into account different chemical compositions and size/shape effects still needs to be performed.
Amorphous silicates with the same stoichiometry as pyroxenes and olivines (note again that the amorphous silicates have a different structure from pyroxenes and olivines despite the same chemical bulk composition) typically show two broad infrared bands at about 10 and 18 m, corresponding to Si–O stretching and O–Si–O bending vibrations, respectively. These bands are frequently observed in the spectra of protoplanetary disks. The large width of the bands results from a distribution of bond lengths and angles, typical for the amorphous structure of these solids. The 18 m band is additionally broadened and generally weaker due to the coupling of the bending mode to the metal-oxygen stretching vibrations occurring in this spectral region. The exact position of the Si–O stretching vibration depends on the level of SiO4 polymerization. As an example, the band is shifted from 9 m for pure (sub)micron-sized SiO2 grains to about 10.5 m for Mg2.4SiO4.4 (Jäger et al. 2003a).
In contrast to amorphous silicates, crystalline pyroxenes and olivines produce a wealth of narrow bands from the mid-infrared to the far-infrared wavelength range due to metal-oxygen vibrations. In crystalline pyroxenes and olivines, the majority of the infrared peaks are shifted to longer wavelengths with increasing iron content. These observed shifts are caused by an increase in bond lengths between the metal cations and the oxygen atoms when Mg2+ is substituted by Fe2+. The wavenumber shift is very closely related with the Fe content and allows a determination of the Mg/Fe ratio from infrared spectroscopy (Jäger et al. 1998). However, it is difficult to derive the Mg/Fe ratio from 10 m observations alone, as the shift there is rather small; fortunately it is more pronounced for bands at longer wavelengths, enabling the determination of the ratio. Based on laboratory data, forsterite grains have strong bands at 10.0, 11.3, 16.3, 19.8, 23.5, 27.5, 33.5 and 69.7 m, while enstatite grains have bands at 9.4, 9.9, 10.6, 11.1, 11.6, 18.2, 19.3 and 21.5 m. The exact position of these features vary with the quality of the crystals and temperature, and will also depend on the shape distribution of the particles.
By observing the mid-infrared wavelength range, the ISO and Spitzer missions provided a wealth of information on the presence of crystalline olivines and pyroxenes in protoplanetary disks through spectroscopy (e.g. Bouwman et al. 2001, 2008; Kessler-Silacci et al. 2006, see also Sect. 5). Strong bands were observed at 9.3, 10.1, 11.3, 19.0, 23.4, 27.8 and 33.5 m - in Fig. 2, we illustrate the wealth of crystalline features observed in T Tauri stars.

2.4 Carbonaceous Grains
Carbon is a major player in the ISM, as it is a primary cooling and heating agent. It can be present in many different forms: as pure atoms, in simple molecules (CO, SiC, CN, CH,…) and more complex ones (Polycyclic Aromatic Hydrocarbons; PAHs) up to carbonaceous solids. Carbonaceous solids span a wide range of materials (Henning & Salama 1998, Henning et al. 2004) from ordered structures such as graphite and diamond to complicated amorphous structures such as a variety of hydrogenated carbonaceous particles. The relevance of these materials as cosmic dust analogues and their spectroscopic properties have been summarized by Henning et al. (2004). Hydrogen-deficient amorphous carbon grains have only weak or lacking infrared modes and will be difficult to identify in the spectra of protoplanetary disks. Saturated aliphatic hydrocarbons show CH stretching and deformation modes in CH2 and CH3 groups at 3.4 and 6.6 m, seen in the diffuse ISM, but so far not detected in the spectra of protoplanetary disks. An exception is the Herbig Ae/Be star HD 163296 where ISO spectroscopy provided evidence for the presence of aliphatic carbonaceous dust (Bouwman et al. 2001). We can certainly expect more evidence for this dust component from a detailed analysis of high-quality Spitzer data (e.g. Juhász et al. 2009b).
In the Pollack et al. (1994) model for the dust composition of the cooler, outer disk, a kerogen-like material is assumed: it is a carbon-rich structure containing a significant amount of H, N, and O, typical of the matrix material in carbonaceous chondrites. This material should show C=O stretching vibrations in carbonyl groups. However, spectroscopic evidence for the presence of this material in disks is still lacking. So far, we have to conclude that the nature of the carbonaceous material in protoplanetary disks remains ill-defined.
In protoplanetary disks around Herbig Ae/Be stars, PAHs were convincingly detected at 3.3, 6.2, 7.7, 7.9, 8.2, 8.6, 11.2, and 12.7 m (Peeters et al. 2002, Sloan et al. 2005, Boersma et al. 2008, Keller et al. 2008). The ratio of the band strengths can be used to derive the charge state of the PAHs, from which the ionization parameter can be calculated (e.g. Bakes et al. 2001). Furthermore, the band ratio can also be related to the size of the emitting PAHs (Allamandola et al. 1985). In T Tauri stars, there is much less evidence for the presence of PAHs, certainly because of the different stellar UV radiation fields (Geers et al. 2006, 2007). The presence of PAHs in the disks of Herbig Ae/Be stars shows that at least some carbonaceous material survives in protoplanetary disks.
Evidence for the presence of nanodiamonds have been found in a very small number of Herbig Ae/Be stars (van Kerckhoven et al. 2002). Their infrared features at 3.43 and 3.53 m have been interpreted as vibrational modes of hydrogen-terminated crystalline facets of diamond particles (Guillois et al. 1999; pure nanodiamonds have no infrared features). Alternatively, diamondoid molecules were recently discussed as the carriers of these bands (Pirali et al. 2007). There are actually only three Herbig Ae/Be stars known to date that have clear diamond signatures: HD 97048 (Whittet et al. 1983), MWC 297 (Terada et al. 2001), and Elias 1 (Whittet et al. 1984). An extensive 3 m spectroscopic survey of over 60 Herbig Ae/Be stars did not add a single source with a pronounced diamond spectrum to the already known objects (Acke & van den Ancker 2006). Goto et al. (2009) argued that the presence of diamonds in the disks around selected Herbig Ae/Be stars may be related to the transformation of graphitic material into diamond under the irradiation of highly energetic particles.
Carbonaceous material was also found in solar system material: in chondritic meteorites, nanodiamonds and graphitic particles were detected (e.g. Sandford 1996, Hill et al. 1997), while PAHs were observed in comets (e.g. Moreels et al. 1994, Joblin et al. 1997).
2.5 Iron-containing Grains
Iron-containing particles have an important effect on the dust opacity (Ossenkopf et al. 1992, Henning & Stognienko 1996). In amorphous silicate grains, they strongly influence the near-infrared absorptivity and the temperature of the grains (Dorschner et al. 1995). Pure iron aggregates would dramatically increase the dust opacities (Henning & Stognienko 1996). In the Pollack et al. (1994) dust model, most of the iron is in silicates and troilite (FeS), and the remainder 20% of its solar abundance is assumed to be in metallic iron. In the inner disk, most of the iron would be in metallic iron. Only at temperatures below 700 K part of the metallic iron will be incorporated in FeS.
There is strong evidence for the widespread occurrence of Fe and FeS in primitive solar system material, including the dust analyzed by the mass spectrometers onboard the space probes to comet Halley and the Stardust samples from Comet 81P/Wild 2 (e.g. Bradley et al. 1988, 1994, Zolensky et al. 2006). Solid iron and troilite form solid solutions with the available Ni and NiS under the conditions of protoplanetary disks and standard cosmic element mixtures.
Despite the important role of iron in determining the opacities of protoplanetary dust, so far no convincing spectroscopic identification in astronomical spectra has been presented. Small iron particles will only contribute to the general infrared continuum and show no infrared resonance. Therefore, they cannot be identified by distinct infrared spectroscopic features. Laboratory measurements demonstrated that (sub)micron-sized FeS particles should have relatively strong infrared features between 30 and 45 m (Begemann et al. 1994, Mutschke et al. 1994). Again, no observational evidence for the presence of these features exists in spectra of protoplanetary disks.
3 Optical Properties of Dust Particles
In order to interpret astronomical spectra and to be able to assign solid-state features to given species, the optical properties of the dust particles need to be calculated. Such calculations are based on light scattering theory and laboratory data.
The interaction of a radiation field with a system of solid particles can be described by their absorption and scattering cross sections and , respectively. They describe what fraction of the incoming radiation is absorbed or scattered by a dust particle. The extinction cross section is given by
| (1) |
The cross sections depend on the chemical and structural properties of the solid particles, ranging from the atomic scale (chemical composition, crystal and defect structure), to the mesoscopic scale (porosity and inhomogeneities, mantles, surface states), and finally the macroscopic morphology (size and shape distribution, agglomeration, coalescence).
Instead of the extinction cross section, the mass extinction coefficient , defined as the extinction cross section per unit particle mass, is often used to characterize the extinction of light. This quantity is actually more appropriate in describing how much light is removed from the incoming radiation field by a fixed mass of particles. For a spherical particle, = where is the particle radius, the material density, and the extinction efficiency (extinction cross section per geometrical cross section, ).
The optical properties of small particles can considerably deviate from those of bulk materials because of the occurrence of surface modes. The structure of the interface of small particles, including their shape, can have strong effects on their optical behavior. A comprehensive description of the classical electrodynamics of light absorption and scattering by small particles goes far beyond the goal of this section and we refer to the excellent textbook by Bohren & Huffman (1983) for a detailed discussion.
The qualitative features of the absorption and scattering of light strongly depend on the ratio between the wavelength of the incident light and the size of the particle (for a spherical particle, the radius ). We can distinguish three cases:
-
1.
Geometrical optics (Size parameter =2/ 1): The propagation of light is described by rays which are reflected and refracted at the surface of the scatterer and finally transmitted, according to Snell’s law and the Fresnel formulae. The scattering of a wave incident on a particle can be described as a combination of a reflected and a transmitted wave. For absorbing materials, light can penetrate only within the skin depth. Scattering, therefore, is mainly a surface effect and the absorption cross section becomes proportional to the area of the particle as the radius increases. In this case, the mass absorption coefficient for a sphere scales roughly as 1/. We should note that for very large size parameters, the extinction efficiency approaches the limiting value 2.
-
2.
Wave optics (): The angular and wavelength dependence of the scattered radiation is dominated by interferences and resonances. For spherical particles, this is the domain of Gustav Mie’s (1908) scattering theory, which is often applied in astrophysics.
-
3.
Rayleigh limit (Size parameter =2/ 1): If, in addition, we have , where is the (complex) refractive index of the particle, we are in the quasi-static limit. Then, both the incident and the internal field can be regarded as static fields. In this regime, phase shifts over the particle size are negligible. For non-magnetic particles this implies that it is generally sufficient to only consider the dipolar electric mode.
The interaction of infrared and (sub)millimeter radiation with sub-micron sized grains can generally be considered as good examples of the quasi-static case. However, particles with high imaginary parts of the refractive index (metals, semiconductors, crystalline grains) and particles of somewhat larger sizes can easily violate the conditions for the quasi-static limit, even at infrared wavelengths.
In Fig. 3, we show an example of the extinction efficiencies for four different grain sizes for the case of an infrared resonance of amorphous silicates in the 10 m range, caused by Si–O stretching vibrations. It is clear that the feature changes shape with increasing grain size: larger (micron-sized) grains show typical “flat-topped” features and eventually disappears. This behavior can be used to trace the size of the particles by infrared spectroscopy. Here, we already want to note that the infrared features loose their diagnostic value for grain sizes much larger than the wavelength of the feature.

For the sake of simplicity and physical insight, we will only discuss the quasi-static case (Rayleigh limit) in the following. In this case, there is a connection between electrostatics and scattering by particles. Therefore, the expressions for the scattering and absorption cross sections for (small) spherical particles can be derived by treating the particle as an ideal dipole with the dipole moment given by electrostatic theory (see, e.g., Bohren & Huffman 1998).
According to Rayleigh’s law, the scattering cross section scales with , where is the wavenumber. This means that for very small absorbing particles (compared with the wavelength of incident radiation) the extinction cross section is given by the absorption cross section. For the extinction cross section we can write
| (2) |
where the quantity denotes the polarizability and Im stands for the imaginary part of this quantity. The polarizability is defined as the ratio of the induced electrical dipole moment to the electric field that produces this dipole moment. This quantity depends on the complex dielectric function (dielectric permittivity), = + i (for dielectrics ), of the particle and on the dielectric function of the embedding medium, , which is in most cases a wavelength-dependent real number (in vacuum =1).
One cannot only treat spheres in the electrostatic approximation, but also other particles, as long as their characteristic dimensions fulfill the same conditions as defined for the spherical particles. Therefore, we will now consider ellipsoids as a more general particle shape, including both spheres (all axes equal) and spheroids (two axes having the same length).
For ellipsoids, the polarizability, , in an electric field parallel to one of the principal axes is given by
| (3) |
where are geometrical factors and is the volume of the ellipsoid. The relation implies that only two of these three factors are independent. For a continuous distribution of ellipsoids (CDE) we get the relation (in vacuum with )
| (4) |
where denotes the principal value of the logarithm of the complex number . The CDE in this form assumes equal probability for the presence of every shape and averages over all orientations. This implies that also extreme shapes are equally weighted, although they are less probable to be present in real shape distributions. Nevertheless, the CDE can be used for a first estimate of how important shape effects for a certain resonance really are. It is important to note that the previous equations also demonstrate that the mass extinction coefficient for such particles is independent of their size, but not of their shape.
The simplest case of light scattering in the quasi-static limit is that of a spherical particle where all axes are equal and = 1/3. This gives = and results in the expression
| (5) |
Equation (3) demonstrates that resonances for particles surrounded by a non-absorbing medium occur close to the wavelength where the imaginary part of the dielectric function is close to zero and the real part fulfills the condition
| (6) |
This equation immediately implies that the resonance wavelengths depend on the shape of the particles. The resonances can only occur in regions where the real part of the dielectric function is negative (for a sphere = -2 ). Examples of astronomically relevant materials which fulfill these criteria are SiC and SiO2 in the infrared and graphite in the UV. In contrast, the lattice features of amorphous silicates do not always show this behavior. In Fig. 4 we show an example of the shape effects for SiO2 particles. In the case of lattice modes, the resonances are always located between the transverse and longitudinal phonon frequencies, which makes it possible to estimate the wavelength range where the peak absorption can occur. The equations also show that the positions of the resonances depend on the surrounding medium. This is important for protoplanetary dust, as it consists of core-mantle grains where the core is made of refractory material and the mantle is composed of molecular ices.

For particles of arbitrary shapes there exists no analytical solution, not even in the quasi-static limit. Numerical models frequently used for non-spherical particles are the “Separation of Variables method”, the “T-matrix method”, and the “Discrete Dipole (or Multipole) method” (see, e.g., Draine et al. 1988; Michel et al. 1996; Voshchinnikov et al. 2000, 2006; Min et al. 2008).
We should stress again that the occurrence of resonances is a property typical of small particles. For metal particles, resonances even occur at wavelengths where the bulk material does not show any absorption bands. In reality, the resonances will be modified and smeared out by a distribution of shapes and the real difficulty is to evaluate which shape distribution would be a realistic description for the observed infrared features (Min et al. 2005, 2007, Voshchinnikov & Henning 2008). An analysis of the dust composition, based on the simple assumption that the particles are compact spheres, certainly leads to unreliable results. Min et al. (2005, 2007) recommend the application of a distribution of hollow spheres (DHS) for the calculations of the dust cross sections, which is computationally easy to use. In the Rayleigh limit, the absorption properties for a distribution of spheroidal particles and for a distribution of hollow spheres are very similar. However, the DHS method can also be used outside the Rayleigh limit, in contrast to the CDE. Absorption properties, calculated by the DHS method, seem to provide a reasonable representation of the shape of observed dust features (see, e.g., van Boekel et al. 2005, Kessler-Silacci et al. 2006).
In the dense regions of protoplanetary disks, we expect that particles coagulate and form larger particles (Beckwith et al. 2000, Henning et al. 2006, Natta et al. 2007). For a description of the interaction of electromagnetic radiation with fluffy aggregates composed of individual particles, two distinct approaches are possible:
-
1.
The “Deterministic” approach: The frequency-domain Maxwell equation is solved for an individual cluster. The resulting cross sections are calculated for many clusters and then averaged both over the ensemble of clusters and their orientation. The advantage of this approach is that for special systems (e.g. clusters of spheres), exact solutions of the problem exist. For computational reasons, however, these methods are often limited to either comparatively small clusters or moderately absorbing systems. Examples of this kind of approach are the discrete dipole and multipole approximations (DDA/DMA) and the extended Mie theory for multisphere aggregates.
-
2.
The “Statistical” approach: The equations are formulated in terms of statistically relevant quantities (e.g. average radial density function of the clusters, density correlation function), without any explicit treatment of individual particles. Whereas a given cluster generally does not have any symmetry, statistical averages show rotational invariance, unless alignment mechanisms break this symmetry. The advantage of this approach is that only the necessary information (ensemble and orientation averaged quantities) enter the calculations. Examples of this approach are the different effective medium theories and the strong permittivity fluctuation theory.
The dielectric function or the complex refractive index can be determined in the laboratory for relevant astronomical materials. The term “optical constants” for the real () and imaginary part () of the complex refractive index is somewhat misleading since the quantities strongly depend on frequency. For certain materials they also depend on temperature. The optical constants or dielectric functions are macroscopic quantities and loose their meaning for small clusters and molecules.
The dispersion with frequency is determined by resonances of the electronic system, of the ionic lattice and, at very low frequencies, by the relaxation of permanent dipoles. In the resonance regions the absorption becomes strong (high imaginary part) and the real part shows “anomalous dispersion“, i.e. a decrease with frequency. In many cases, this behavior can be described by Lorentzian oscillators.
Compilations of optical “constants” of solid materials can be found in a number of databases which are either available in the form of books or electronic media. The most important database in book form is the “Handbook of Optical Constants of Solids”, edited by E.D. Palik, that currently consists of three volumes which appeared in 1985, 1991 and 1998. These books are highly recommended since they comprise detailed discussions of the origin and errors of each data set. A database which is especially dedicated to cosmic dust has been developed by Henning et al. (1999) and can be found in its updated electronic form at http://www.mpia-hd.mpg.de/HJPDOC (Heidelberg-Jena-St. Petersburg Database of Optical Constants).
4 Spectral Analysis Methods
Dust properties are best studied in the infrared, as it is here that the vibrational resonances of many astronomically relevant materials occur. Indeed, silicates and other oxides, sulfides, hydrogenated amorphous carbon particles, PAH molecules, and even hydrogen-terminated nanodiamonds all show characteristic features at those wavelengths (see Sect. 2). This makes the infrared the fingerprint region for cosmic dust studies. Sensitivity, spectral coverage and resolution are important observational parameters for such studies. Ground-based mid-infrared spectroscopy is mostly limited to the 8-13 m atmospheric window, but can deliver data with very high spectral and spatial resolution; however, always with limited sensitivity due to the thermal background of the atmosphere. The ISO SWS spectrometer covered the extremely interesting wavelength range between 2 and 45 m with a spectral resolution between 1000 and 2000. In addition, the ISO LWS instrument extended the wavelength range to wavelengths between 45 and 200 m with a resolution 100-200 up to 6800-9700 in high-resolution mode. The Spitzer Short-Low and Long-Low spectrometers covered a wavelength range between 5.3 and 14.5 m and 14.2 and 38.0 m, respectively, with a spectral resolution of 60-120. The Short-High and Long-High spectrometers had a wavelength coverage between 10.0 and 19.5 m and 19.3 and 37.2 m with a spectral resolution of 600. The ISO mission was the first infrared space observatory which delivered high-quality data for the bright Herbig Ae/Be stars over a wide wavelength range. The Spitzer Space Telescope, with its unprecedented sensitivity, provided spectra of very high quality not only for these intermediate-mass stars but also for large and statistically significant samples of T Tauri stars, and even made the first measurement of spectra of brown dwarf disks possible.
4.1 Location of the ’observable’ dust grains
The dust spectral features that are seen in emission arise in the optically thin, warm disk atmosphere - the dust regions closer to the mid-plane are optically thick and do not show spectral features. This means that we can only trace a very small part of the total disk material with infrared spectroscopy. A major concern here is the differential sedimentation of particles: larger grains would reach a smaller scale height, that is an equilibrium between sedimentation and vertical turbulent mixing, implying that through spectroscopy, we only get selective information of the uppermost disk layer. In the case of efficient mixing between the optically thick (featureless) disk midplane and the upper disk layers, the observations would provide information on the complete dust population of the disks.
The properties of the dust grains - size, shape, agglomeration state, chemical composition and material structure - as well as the dust temperature distribution determine the shape of the spectral features which occur on top of the continuum, arising in the optically thick part of the disk. In addition, the disk geometry also has an important influence on the observed spectrum: in disks with a flared geometry, the outer disk contributes significantly to the spectrum in the 10 m range, whereas in disks with a flat geometry, the inner disk edge (the inner “rim”) is more dominant. The inner disk edge is often strongly “crystallized”, whereas the regions further out contain much less crystalline material. Therefore, a disk with a flat geometry may appear to have a higher crystallinity than a flared disk, even though the actual composition of the dust is identical - this is purely a contrast effect.
Furthermore, it is important to realize that spectra around 10 m trace different regions of the disk as a function of (sub)stellar luminosity: . For brown dwarfs and T Tauri stars the emission comes from regions of 0.05 and 0.5 AU distance from the brown dwarf/star, respectively, whereas the 10 m emission from Herbig Ae stars traces the 10 AU range (see Kessler-Silacci et al. 2007 for a discussion of the scaling of the silicate emission region with luminosity). In the inner disk, a more rapid grain growth is expected, leading to different contrast ratios between amorphous and crystalline silicate features, as the amorphous features ‘flatten’ with increasing size (see Fig. 3). This fact also needs to be kept in mind when comparing spectra of objects with different luminosities and arriving at conclusions about the amount of crystalline grains.
4.2 Spectral decomposition
The combination of disk thermal structure and dust optical properties can lead to degeneracies between these properties in the modelling results, even if sophisticated radiative transfer calculations are used to interpret the spectral energy distributions. Such degeneracies can be reduced when additional interferometric data, intensity maps, and polarization data are used to further constrain the disk properties. An additional problem comes from the fact that some materials do not show any specific resonance (e.g. metallic iron particles in the infrared) and that large particles “lose” their characteristic features. Such “featureless” grains produce a continuum which is difficult to separate from the continuum of the optically thick part of the disk.
The most studied region in the context of dust is around 10 m, where amorphous and crystalline silicates show features, as well as silica and PAHs. It is fortunate that this region is also observable from the ground, unlike most longer wavelength regions. However, many of the features typical of crystalline grains are located at longer wavelengths and can only be observed by space missions. As the dust emission arises in an optically thin region, the modelling of the features should be straightforward, but it is complicated by the temperature distribution of the particles and the underlying continuum. Here, we should note that a certain wavelength range in the spectrum corresponds to a certain temperature range in the disk. This immediately implies that the analysis of a wider spectral range requires the application of a temperature distribution.
In order to analyze larger data sets, especially in the 8-13 m region, different simple spectral decomposition methods have been used in the literature to narrow down the properties of the grains that produce the features and to determine quantities such as composition, shape, size, and crystallinity.
In a simple approach, the continuum below the spectral features is modelled by a polynomial and then subtracted from the measured spectrum. In this continuum subtraction method (Bouwman et al. 2001), the continuum is fitted outside of the feature which is often hardly possible in ground-based observations because the spectrum cannot be sampled in the atmospherically opaque regions. In addition, the continuum can be associated with the bands themselves because the grains generally contribute to the continuum mass absorption coefficients. It is further assumed that the dust grains have a single temperature. The continuum-subtracted feature is then fitted with a linear combination of mass absorption coefficients of dust particles of different sizes, composition and structure (see Bouwman et al. 2001); the necessary optical constants for the materials are provided by laboratory measurements.
Two other methods are very similar, but differ in the modelling of the underlying continuum: in the ’single temperature method’ (van Boekel et al. 2005) the spectrum is fitted by a linear combination of optically thin and thick emission. In this approach, it is assumed that the disk continuum is well represented by a Planck function and that the temperature of this continuum is the same as the temperature of the optically thin disk emission. The ’two temperature method’ (Bouwman et al. 2008) is formally identical to the single temperature method, but fits the temperature for the feature and the continuum separately. In the two temperature method, the observed monochromatic flux is given by
| (7) |
where is the Planck function with a continuum temperature , the Planck function with the characteristic dust temperature, the mass absorption coefficient for species and grain size , and the PAH template spectrum. , and are weighting factors.
The strongest limitations of these approaches are that the underlying continuum of the optically thick dusty disk is assumed to be well represented by a Planck function which is never the case in realistic disk models (e.g. Men’shchikov & Henning 1997, Chiang & Goldreich 1997, Dullemond et al. 2001, Dullemond & Dominik 2004), and that even in the narrow spectral range from 8 to 13 m, grains of quite different temperatures contribute to the emission.
Recently, Juhász et al. (2009a) developed a more realistic but still fast approach, the ‘two layer temperature distribution method’ in which a continuous distribution of temperatures is applied, rather than a fixed temperature, and the correct continuum is calculated. The continuum emission below the silicate features consists of three components: a high-temperature component from the star and from the inner rim of the disk, a low-temperature component from the cold disk midplane and the optically thin emission from featureless grains (e.g. carbon) from the disk atmosphere. This again illustrates that the real continuum is complex and cannot (and should not) be modelled by a Planck function with a single temperature.
In the two layer temperature method, the observed monochromatic flux is given by
Here and are the radius and temperature of the central star, is the Planck-function and is the exponent of the temperature distribution which is assumed to be a power law. The subscripts ‘atm’, ‘rim’ and ‘mid’ refer to the disk atmosphere, puffed-up inner rim and disk midplane, respectively. Note that one fits the value of for the disk atmosphere, inner rim and disk midplane separately. denotes the flux of the optically thin disk atmosphere which is given by
| (9) |
where and are the number of dust species and of grain sizes used, respectively. The temperature range for the integrals is fixed by the contribution from grains of different temperatures to the emission of the actually analyzed spectral range. In other words, the outer disk does not contribute and does not need to be considered when analyzing the emission in the 10 m range. In this (and the other) method(s), one assumes that the dust mixture is uniform over the fitted range of disk temperatures and corresponding disk radii. This means that one has to split the wavelength interval if one wants to analyze the whole spectral region covered by ISO or the Spitzer Space Telescope.
Juhász et al. (2009a) compared the robustness of the various methods mentioned above with the aid of synthetic disk spectra, calculated with a 2D radiative transfer code, so that the input dust composition is known. They show that the two layer temperature method does the best job in retrieving the input composition. Furthermore, they showed that - within the interval 5 to 35 micron - the wavelength region between 7 and 17 micron is best suited to derive the various dust parameters, assuming a dust composition close to that generally obtained in the analysis of disk spectra.
We note, however, that the two layer temperature method has its own limitations, as it assumes that all dust species have the same temperature at a given disk location and does not consider the influence of the amount of disk flaring. This may lead to spurious inverse correlations between the derived mass-averaged grain size and the flaring of the disk because the radiative transfer effect, discussed at the beginning of the section, is not appropriately taken into account. In addition, the input grain model should contain the major dust species expected to be present in protoplanetary disks.
The next step in sophistication would be to use a real radiative transfer model, but this would need additional information to constrain the model. In the most recent models, it is now possible to include a realistic treatment of the irradiation of the inner disk by the central star, different flaring configurations as well as dust sedimentation (see, e.g., Dullemond et al. 2001, Dullemond & Dominik 2008).
5 Mineralogy of Protoplanetary Dust
The derivation of the dust properties in protoplanetary disks can be tackled through the analysis of primitive material in the solar system as an analogue for young disks as well as through infrared spectroscopy of protoplanetary disks (see Henning 2003 for a comprehensive coverage of the field of astromineralogy). In this context, the ISO and Spitzer missions provided a legacy of spectroscopic data on protoplanetary disks. In the following, we will discuss what knowledge these space missions have provided about the dust properties in disks around young stars.
5.1 Intermediate-mass stars: The Herbig Ae/Be stars
Protoplanetary dust has most thoroughly been studied for disks around intermediate-mass (2 to 8 M⊙) pre-main sequence stars, the Herbig Ae/Be stars (HAEBEs). This is mainly because they are brighter than their lower-mass counterparts, providing spectra with high signal-to-noise ratios. The characterization of the dust in the disks around HAEBEs made important steps forward with the launch of the Infrared Space Observatory (ISO), which provided high-quality infrared spectra, and also with ground-based data in the 8-13 m window. Broad emission features from silicates (at 9.7 and 18 m), features assigned to crystalline silicates, and PAH features (see Sect. 2.4) have been observed (e.g. Malfait et al. 1998, Bouwman et al. 2001, Acke & van den Ancker 2004, van Boekel et al. 2005).
These observations showed that the dust composition and size distribution vary widely from object to object: some objects (e.g. AB Aur; Bouwman et al. 2000, van Boekel et al. 2005) have dust features typical of amorphous dust grains, as found in molecular clouds and in the diffuse interstellar medium. Other HAEBEs have dust features showing a large fraction of crystalline dust grains, similar to solar-system bodies such as comets and interplanetary dust particles. The striking similarity between the silicate mineralogy of comet Hale-Bopp’s dust and the dust around the isolated Herbig Ae/Be star HD 100546 was both an exciting and surprising result, showing that some cometary material has seen partial processing at high temperatures and can serve as an analogue for silicate minerals in disks (Malfait et al. 1998). An amazing observation with the Spitzer Space Telescope (Lisse et al. 2007) and ground-based N-band observations (Harker et al. 2007) was the detection of “crystalline” silicate features after the Deep Impact Encounter on comet 9P/Tempel 1. That encounter lifted grains from the cometary nucleus into the coma. Although the claims on the abundance of minor grain components from the analysis of the infrared Spitzer spectrum by Lisse et al. (2006) should be taken with some caution, the experiment clearly demonstrates the presence of crystalline silicates in the cometary nucleus. For a more detailed discussion on cometary grains and its implications for dust mineralogy, heating, as well as on radial mixing in protoplanetary disks, we refer to the papers by Hanner (2003) and Wooden et al. (2007).
The analysis of long-wavelength spectroscopy data ( 20 m) can provide a determination of the Mg/Fe content of the crystalline silicates as discussed in Section 2.3. Focused on the 69 m feature, such an analysis demonstrated that crystalline olivines in the outflows of evolved stars are predominantly Mg-rich (Molster et al. 2002). A similar result was obtained for the pyroxenes, based on the 40.5 m feature. The exact determination of the chemical composition of crystalline silicates in the disks around young stars is more complicated, due to a lack of relevant spectral features observed with high S/N ratio. The only source where the 69 m feature has been detected through ISO observations was the bright Herbig Be star HD 100546. Here, the analysis also showed that the crystalline silicates are predominately magnesium-rich (e.g. Malfait et al. 1998, Bouwman et al. 2003). The shorter-wavelength data on crystalline silicate bands in the spectra of disks around young stars (and comet Hale-Bopp) also point to a low iron content in crystalline silicates (e.g. Bouwman et al. 2008, Juhász et al. 2009b).
Spitzer observations provided a compilation of high signal-to-noise ratio spectra for about 45 HAEBE disk sources (Juhász et al. 2009b). These spectra provide a strong indication for forsterite grains dominating the dust composition in the outer disk, characterized by the long-wavelength data. In Fig. 5, we show the high-quality spectrum of the optically brightest Herbig Ae star, HD 104237.

Fig. 6 shows a high-quality ground-based spectrum of a HAEBE star which illustrates that such data can also provide important constraints on the dust composition. The spectrum shows very convincing evidence for the presence of enstatite in HD 179218.
Interferometric measurements with the mid-infrared instrument MIDI at the Very Large Telescope Interferometer, providing for the first time spatially resolved spectroscopy, demonstrate dust processing by thermal annealing and coagulation to be most efficient in the innermost parts of the disk ( 2 AU; van Boekel et al. 2004): a spatial gradient in amount of crystallinity and size distribution was found in the disks of 3 Herbig Ae stars. These data also indicated a radial dependence of the chemical composition of the crystalline silicate dust: olivines dominate in the inner disk, while pyroxenes dominate in the outer disk.

5.2 The lower-mass T Tauri stars and brown dwarfs
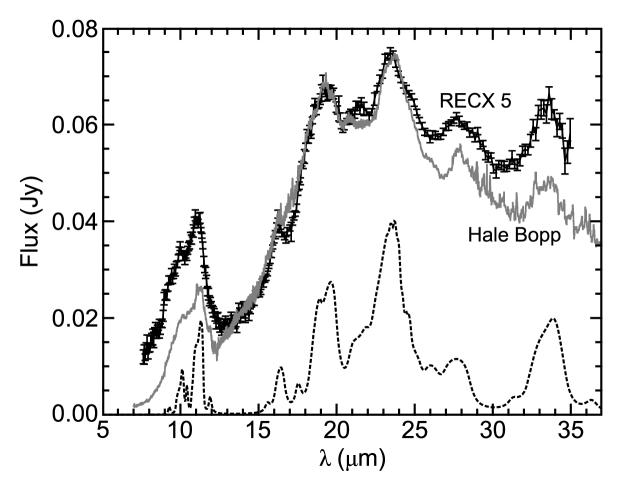
Also the grain properties in the lower-mass ( 1 solar mass) T Tauri stars (TTS) have been derived in the last few years, and a similar diversity in dust properties as observed in HAEBEs was found (e.g. Meeus et al. 2003, Przygodda et al. 2003). Thanks to the sensitivity of Spitzer, it soon became possible to study larger samples of TTS, confirming the similarity in dust properties with the higher-mass stars (e.g. Forrest et al. 2004, Kessler-Silacci et al. 2006, Sicilia-Aguilar et al. 2007, Watson et al. 2008). Kessler-Silacci et al. (2006) also found that half of their sample (40 TTS) show crystalline silicate features at longer wavelengths (33-36 m). Sicilia-Aguilar et al. (2007) and Watson et al. (2008) found no correlation between the crystallinity and any stellar parameter, but showed that in general, the crystallinity in TTS is relatively low (less than 20 %). In Fig. 7, we show a comparison between the Spitzer spectrum of the disk around a low-mass star and the ISO spectrum of comet Hale-Bopp. The two spectra show remarkable similarity, indicating that comet-like material is present in the disks around TTS.
In two different samples of TTS, Bouwman et al. (2008) and Meeus et al. (2009) determined that the forsterite to enstatite ratio is low in the inner disk (1 AU), while forsterite dominates in the outer (5 - 15 AU), colder regions. The same results were obtained for the Spitzer sample of HAEBEs (Juhász et al. 2009b). This is in contradiction with the chemical equilibrium calculations by Gail (2004), which predict that - assuming the crystalline silicates form as high temperature gas phase condensates - forsterite is only present in the innermost regions where crystalline silicates can survive, while enstatite dominates in the more distant regions. Also radial mixing, investigated in the study by Gail (2004), would not resolve this discrepancy, as this model still predicts enstatite to dominate the outer disk regions. Here one should keep in mind that the reaction rates for the conversion from forsterite to enstatite and vice versa are still relatively uncertain.
Most likely, non-equilibrium processes contribute to the formation of enstatite (see the extensive discussion on this topic by Bouwman et al. 2008). As an alternative scenario for the formation of crystals, local heating in transient events has been discussed - either by lightning in the disks (Desch & Cuzzi 2000), or by shocks caused by gravitational instabilities (Harker & Desch 2002). Compositional and structural features of enstatite and forsterite in primitive chondrite matrices also point to the formation through shock heating in the solar nebula, at distances from 2-10 AU from the Sun (Scott & Krot 2005). Here, we should note that potential correlations between stellar parameters and crystallinity may be erased by additional processes such as amorphization of grains through ion irradiation associated with stellar activity (see, e.g., Jäger et al. 2003b).
In the mid-infrared spectra of a few T Tauri stars, taken with the Spitzer Space Telescope, Sargent et al. (2008) detected prominent narrow emission features at 9.0, 12.6, 20, and sometimes 16.0 m, indicating the presence of crystalline SiO2 (silica). Modeling suggests that the two polymorphs of silica, tridymite and predominantly cristobalite, which form at high temperatures and low pressure, are the dominant form of silica responsible for the spectral features. This material is certainly largely the result of processing of primitive material in the protoplanetary disks around these stars. Tridymite and cristobalite, once formed, must be cooled quickly enough in order to keep their crystalline structure.
Finally, for brown dwarfs, the field of disk studies is quite new, but also here Spitzer has somewhat lifted the veil. The silicate emission feature observed in young brown dwarfs in Chamealeon I (2 Myr, Apai et al. 2005) suggest similar dust processing as in the young stellar disks: the 10 m feature varies from source to source, with different degrees of flattening (due to larger grains). Remarkably - given their cooler temperature - a high degree of crystallinity (between 10 and 50 %) is derived.
Here, we note that the brown dwarf spectra generally have a lower signal-to-noise ratio than those of the brighter stars, which makes the derivation of dust parameters less reliable. In addition, due to the low luminosity of brown dwarfs, we probe a physically much smaller region of their disks so that we only see those regions where grain growth is expected to be very fast (see also Sect. 6). This may also explain the observational evidence for often flatter disk geometries in brown dwarfs, due to the fast settling of larger grains and the associated transition from flared to flat disk structures. We already noted in Sect. 4.1 that a flatter disk may have a higher apparent crystallinity than a flared disk, even though the actual composition of the dust is identical - this may, at least partly, explain the brown dwarf results.
In this context, it is interesting to note that the 10 m feature in brown dwarfs seems to disappear fast: in the 5 Myr-old Upper Scorpius region, the feature is either absent or very weak (Scholz et al. 2006), while the feature is completely absent in the 3 brown dwarfs observed in TW Hya (10 Myr; Morrow et al. 2008), so that not much is known about dust evolution in brown dwarf disks.
5.3 PAHs and non-silicate dust
PAH emission is widespread in disks around HAEBEs (see Sect.2.4), with stronger features in more flaring disks, and weak or absent features in geometrically flat disks (e.g. Acke & van den Ancker 2004). This can be explained by the fact that flared disks intercept a larger fraction of the UV radiation from the central star than flat disks. However, Dullemond et al. (2007) found that dust sedimentation can enhance the infrared features of PAHs. For disks with low turbulence, the sedimentation causes the thermal (larger) dust grains to sink below the photosphere, while the PAHs still stay well-mixed in the surface layer. The sedimentation of the larger grains would also lead to a reduced far-infrared flux. Therefore, this investigation predicts that sources with weak far-infrared flux have stronger PAH features, which is - at least among the HAEBEs - opposite to what has been observed. This suggests that sedimentation is not the only factor responsible for the weak mid- to far-infrared excess in some disks. We also refer to Keller et al. (2008) for a discussion of this topic.
PAH emission is also expected to be less strong in the cooler T Tauri stars, as the PAH molecules are excited by UV photons. Geers et al. (2007) showed that at least 8% of TTS show PAH features, but their latest spectral type is only G8. Bouwman et al. (2008) report the first detection of the 8.2 m PAH feature in young low-mass objects, and observe this feature in 5 of their 7 sources.
It is interesting to note that apart from the discussed silicates and PAHs, not much convincing spectroscopic evidence for other grain components has been found - so far.
6 Evidence for Grain Growth
Grain growth in protoplanetary disks is a complex process, driven by gas-grain dynamics, leading to collisions between the particles and finally coagulation (Beckwith et al. 2000, Henning et al. 2006, Dominik et al. 2007, Natta et al. 2007). A state-of-the art grain growth model for the conditions of protoplanetary disks has recently been developed, taking into account radial drift and vertical sedimentation, as well as coagulation and the relevant microphysics (Brauer et al. 2008).
In the ISM, the mass-averaged grain size for silicates is smaller than 0.1 micron (Kemper et al. 2004). In young disks, the derived average grain size varies a lot between the objects (e.g. Bouwman et al. 2001, van Boekel et al. 2005), but it is generally found to be much larger than in the diffuse interstellar medium. Van Boekel et al. (2003) related the shape and the strength of the 10 m feature, and showed that this relation provides proof for grain growth (see Fig. 8): strong and triangular 10 m features are typical of submicron-sized grains, whereas a weaker and flattened structure indicates the presence of grains with sizes between 2 and 4 m. Here, we should again note that the shape of the feature can be influenced by other parameters than size (Min et al. 2006, Voshchinnikov et al. 2006, Voshchinnikov & Henning 2008). The actual particle size can be underestimated when using homogeneous spheres instead of fractal dust aggregates, as pointed out by Min et al. (2006).

Spitzer observations of 40 TTS by Kessler-Silacci et al. (2006) reveal evidence for fast grain growth to micron-sized grains in the disk surface. They did not find a correlation with either age of the systems, nor with accretion rates. Kessler-Silacci et al. (2006) further found that later type (M) stars show flatter 10 m features (pointing to larger grain sizes) than earlier type (A/B) stars. This finding was confirmed by Sicilia-Aguilar et al. (2007), who reported that strong silicate features are a factor of 4 less frequent among disks around M-type stars compared to stars of earlier type. This inverse relation between stellar luminosity and grain size was further investigated in a study by Kessler-Silacci et al. (2007). It can easily be explained by a different location being probed at 10 m: for later type stars, this is more inwards than for earlier types (e.g. TTS 0.1-1 AU vs. HAEBEs 0.5-50 AU). In the inner disk we would expect a faster grain growth because of the higher collision rates of grains. This may also explain the fast disappearance of the silicate features in the spectra of brown dwarfs, discussed in the previous section.
Sicilia-Aguilar et al. (2007) found a somewhat counter-intuitive relation for TTS in the cluster Tr37. Only the youngest (0-2 Myr) objects show evidence for large grains by flat and weak spectral features, while features typical of submicron-sized grains were seen in the oldest objects ( 6 Myr), indicating that dust settling removes larger grains from the disk atmosphere. In addition, objects with a lot of turbulence (witnessed by larger accretion rates) have larger dust: it is likely that the turbulence supports large grains against settling towards the disk midplane. They also relate the observed weakness of silicate emission features in later-type objects with inner disk evolution.
Dullemond & Dominik (2008) investigated the effect of differential settling of grains on the appearance of the silicate feature. They confirmed that sedimentation can turn a “flat” feature into a “triangular” one, but only to a limited degree and for a limited range of grain sizes. Only in the case of a bimodal size distribution, i.e. a very small grain population and a bigger grain population, the effect is strong. If sedimentation were the sole cause of the feature variation, one would expect disks with weak mid- to far-infrared excess to have a stronger 10 m silicate feature than disks with a strong excess at these wavelengths, this is not what has been observed in a sample of 46 HAEBEs with a wide range of mid- to far-infrared excesses (Acke & van den Ancker 2004).
In a sample of 24 HAEBEs, van Boekel et al. (2005) derived the composition and grain size of the dust with the “single temperature method” (see Sect. 4.2). They used this decomposition to derive the mass fraction of the observable grains in the 10 m region, and found that a high crystallinity (above 10 %) is only observed in those cases where the mass fraction in large grains is higher than 85 %, suggesting that crystallization and grain growth are related. However, this may partly be a contrast effect, as the strength of the amorphous feature becomes weaker with increasing grain size, thus more clearly revealing crystalline features.
For grains with sizes larger than about 5 m, 10 m spectroscopy will no longer be able to trace such particles which anyway may sediment below the optically thin atmosphere. Here millimeter observations of HAEBEs and TTS have provided evidence for the presence of even cm-sized grains in protoplanetary disks (see, e.g., Natta et al. 2007 for a review). In the case that the disks are optically thin at millimeter wavelengths - a feature which can be expected because of the low mass absorption coefficients at these wavelengths - the slope of the spectral energy distribution ( ) can be directly related to the frequency dependence of the mass absorption coefficient ( ) via the relation = . Here the Planck function is represented by its Rayleigh-Jeans approximation. For typical submicron-sized dust grains in the diffuse ISM, the spectral index has been found to be close to 2 (e.g. Draine & Lee 1984). For particles that are very large compared with the wavelength, which will block the radiation by virtue of their geometrical cross sections, the mass absorption coefficient becomes independent of frequency (grey behavior). Particles of about the same size as the wavelength, for instance 7 mm, selected for studies at the Very Large Array - VLA, i.e. pebble-sized particles, are expected to have spectral indices in the intermediate range. For silicate particles, indices 1 suggest the presence of dust particles with millimeter sizes. Such values have been found in the VLA studies of disks around HAEBEs (Natta et al. 2004) and TTS (Rodmann et al. 2006), clearly indicating the presence of large particles.
7 Conclusions and Future Directions
The last decade has seen huge progress in our knowledge of dust properties in protoplanetary disks, which was made possible mostly through observations with both the Infrared Space Observatory and the Spitzer Space Telescope. A first surprise was the vast variety in appearance of dust features around young stars. A more detailed analysis, however, showed that those dust features, although so different in appearance, could be related to a handful of dust species, with different sizes and structures.
The dust in protoplanetary disks bears the signature of processing compared to ISM dust, the grains are clearly larger and most young sources also show evidence for crystalline silicates.
Despite the large number of spectra now available to the community, it has proven difficult to pin down the relationships between the observed dust properties, on the one hand, and the stellar and disk properties on the other hand. The obviously expected relation of increasing grain size with age, or of increasing crystallinity with higher temperature of the central star has proven to be incorrect.
The problem lies in the fact that there are many parameters to take into account: the age, stellar luminosity, disk flaring angle and dust sedimentation, presence of a close companion, to name just a few. Furthermore, dust features cannot be directly related to a specific dust species and size: other parameters, such as the dust temperature or the shape of the dust particles also play an important role. In addition, good laboratory data for astronomical dust species over the full observable wavelength range remain a much needed ingredient. The same is true for reaction rates which determine the conversion between different grain species.
Therefore, we expect to make more progress in the coming years by comparing the wealth of data provided by Spitzer in a thorough statistical study, eliminating as much as possible those parameters that can be determined, so that, e.g., when studying the size distribution, stars with a similar luminosity are being compared.
In the coming years, several new observatories and instruments will become available. With the launch of the Herschel Space Observatory in 2009, covering the far IR wavelength region (PACS instrument 57-210 m) we will be able to study the lattice vibrations of heavy ions or ion groups with low bond energies with a high signal-to-noise. In particular, studies of the forsterite band at 69 m will be promising in the context of determining the dust temperature and the composition of the olivines, while aqueous alteration can be studied through features of hydrous silicates at 100-110 m.
Further on the horizon lies the launch of the James Webb Space Telescope (JWST), where the unprecedented sensitivity will allow us to study the disks of brown dwarfs with the same ease as we now study T Tauri stars, opening up yet another region of the parameter space in dust processing studies.
Last but not least, a lot can be learned from comparing observations of protoplanetary disks and dust with the composition of primitive material in the solar system, provided by the analysis of meteoritic material and interplanetary dust particles of cometary origin as collected by the STARDUST mission.
References
- (1) Acke, B., van den Ancker, M.E. 2004, A&A, 426, 151
- (2) Acke, B., van den Ancker, M.E., Dullemond, C.P., van Boekel, R., Waters, L.B.F.M. 2004, A&A, 422, 621
- (3) Acke, B., van den Ancker, M.E. 2006, A&A, 457, 171
- (4) Apai, D., Pascucci, I., Bouwman, J., Natta, A., Henning, Th., Dullemond, C.P. 2005, Science, 310, 834
- (5) Allamandola, L.J., Tielens, A.G.G.M., Barker, J.R. 1985, ApJ, 290, L25
- (6) Bakes, E.L.O., Tielens, A.G.G.M., Bauschlicher, C. et al. 2001, ApJ 560, 261
- (7) Beckwith, S.V.W., Henning, Th., Nakagawa, Y., In: Mannings, V., Boss, A.P., Russell, S.S. (eds.), Protostars & Planets IV. Univ. of Arizona Press. Tucson. 2000. p.533
- (8) Begemann, B., Dorschner, J., Henning, Th., Mutschke, H., Thamm, E. 1994, ApJ, 423, L71
- (9) Boersma, C., Bouwman, J., Lahuis, F. et al. 2008, A&A, 484, 241
- (10) Bohren, C.F., Huffman, D.R.: Absorption and Scattering of Light by Small Particles. J. Wiley & Sons. New York. 1998.
- (11) Bouwman, J., de Koter, A., van den Ancker, M.E., Waters, L.B.F.M. 2000, A&A, 360, 213.
- (12) Bouwman, J., Meeus, G., de Koter, A. et al. 2001, A&A, 375, 950
- (13) Bouwman, J., de Koter, A. Dominik, C. and Waters, L.B.F.M. 2003, A&A, 401, 577
- (14) Bouwman, J., Henning, Th., Hillenbrand, L.A. et al. 2008, ApJ, 683, 479
- (15) Bradley, J.P., Sandford, S.A., Walker, R.M.. In: Kerridge, J.F., Matthews, M.S. (eds.), Meteorites and the Early Solar System. University of Arizona Press. Tucson. 1988. P. 861
- (16) Bradley, J.P. 1994, Science, 265, 925
- (17) Bradley, J.P., Ishii H.A. 2008, A&A 486, 781
- (18) Brauer, F., Dullemond, C.P., Henning, Th. 2008, A&A, 480, 859
- (19) Chiang, E.I., Goldreich, P. 1997, ApJ, 490, 368
- (20) Chiar, J.E., Tielens, A.G.G.M. 2006, ApJ, 637, 774
- (21) Chihara, H., Koike, C., Tsuchiyama, A., Tachibana, S., Sakamoto, D. 2002, A&A, 391, 267
- (22) Colangeli, L., Henning, Th., Brucato, J.R. et al. 2003, A&A Rev., 11, 97
- (23) Crovisier, J., Leech, K., Bockelee-Morvan, D. 1997, Science 275, 1904
- (24) Desch, S.J., Cuzzi, J.N. 2000, Icarus, 143, 87
- (25) Dominik, C., Blum, J., Cuzzi, J.N., Wurm, G. In: Reipurth, B., Jewitt, D., Keil, K. (eds.), Protostars & Planets V. University of Arizona Press. Tuscon. 2007. p.783
- (26) Dorschner, J., Henning, Th. 1995, A&A Rev., 6, 271
- (27) Dorschner, J., Begemann, B., Henning, Th., Jäger, C., Mutschke, H. 1995, A&A, 300, 503
- (28) Draine, B.T. 1988, ApJ, 333, 848
- (29) Draine, B.T., Lee, H.M. 1984, ApJ, 285, 89
- (30) Dullemond, C.P., Dominik, C., Natta, A. 2001, ApJ, 560, 957
- (31) Dullemond, C.P., Dominik, C. 2004, A&A, 417, 159
- (32) Dullemond, C.P., Apai, D., Walch, S. 2006, ApJ, 640, L67
- (33) Dullemond, C.P., Henning, Th., Visser, R. et al. 2007, A&A, 473, 457
- (34) Dullemond, C.P., Dominik, C. 2008, A&A, 487, 205
- (35) Fabian, D., Jäger, C., Henning, Th., Dorschner, J., Mutschke, H. 2000, A&A, 364, 282
- (36) Forrest, W.J., Sargent, B., Furlan, E. et al. 2004, ApJS 154, 443
- (37) Gail, H.-P. 1998, A&A, 332, 1099
- (38) Gail, H.-P.: In: Henning, Th. (ed.), Astromineralogy: Springer. Berlin. 2003. LNP Vol.609, p. 55
- (39) Gail, H.-P. 2004, A&A, 413, 571
- (40) Geers, V.C., Augereau, V.-C., Pontoppidan, K.M. et al. 2006, A&A, 459, 545
- (41) Geers, V.C., van Dishoeck, E.F., Visser, R. et al. 2007, A&A, 476, 279
- (42) Goto, M., Henning, Th., Kouchi, A. et al. 2009, ApJ, 693, 610
- (43) Grossman, L. 1972, Geochimica et Cosmochimica Acta, 36, 597
- (44) Guillois, O., Ledoux, G., Reynaud, C. 1999, ApJ, 521, L133
- (45) Hanner, M.S.: In: Henning, Th. (ed.), Astromineralogy: Springer. Berlin. 2003. p. 171
- (46) Harker, D.E., Desch, S.J. 2002, ApJ, 565, L109
- (47) Harker, D.E., Woodward, C.E., Wooden, D.H., Fisher, R.S., Trujillo, C.A. 2007, Icarus, 191, 432
- (48) Henning, Th., Stognienko, R. 1996, A&A, 311, 291
- (49) Henning, Th., Salama, F. 1998, Science, 282, 2204
- (50) Henning, Th., Ilin, V.B., Krivova, N.A., Michel, B., Voshchinnikov, N.V. 1999, A&A Suppl. Ser., 136, 405
- (51) Henning, Th. (ed.): Astromineralogy. Springer. Berlin. 2003.
- (52) Henning, Th., Jäger, C., Mutschke, H.: In: Witt, A.N., Clayton, G.C., Draine, B.T. (eds.), Astrophysics of Dust. ASP Conf. Ser. 309. 2004. p.603
- (53) Henning, Th., Dullemond, C.P., Wolf, S., Dominik, C.: In: Klahr, H., Brandner, W. (eds.), Planet Formation, Cambridge University Press. Cambridge. 2006. p.112
- (54) Henning, Th.: In: Boulanger, F., Joblin, C., Jones, A., Madden, S. (eds.), Interstellar Dust. From Astronomical Observations to Fundamental Studies. EDP Sciences. EAS Publ. Ser. 35, 2009. p.103
- (55) Hill, H.G.M., d’Hendecourt, L.B., Perron, C., Jones, A.P. 1997, M&PS 32, 713
- (56) Jäger, C., Molster, F.J., Dorschner, J. et al. 1998, A&A, 339, 904
- (57) Jäger, C., Dorschner, J., Mutschke, H., Posch, Th., Henning, Th. 2003a, A&A, 408, 193
- (58) Jäger, C., Fabian, D., Schrempel, F., Dorschner, J., Henning, Th., Wesch, W. 2003b, A&A, 401, 57
- (59) Jessberger, E.K., Kissel, J., Rahe, J.: In: Atreya, S.K., Pollack, J.B., Matthews, M.S. (eds.), Origin and Evolution of Planetary and Satellite Atmospheres. University of Arizona Press. Tucson. 1989. p.167
- (60) Joblin, C., Boissel, P. and de Parseval, P. 1997, P&SS 45, 1539
- (61) Juhász A., Henning Th., Bouwman J. et al. 2009a, ApJ, 695, 1024
- (62) Juhász A., Bouwman, J., Henning Th. et al. 2009b, ApJ, in press
- (63) Keller, L.D., Sloan, G.C., Forrest, W.J. et al. 2008, ApJ, 684, 411
- (64) Kemper, F., Vriend, W.J., Tielens, A.G.G.M. 2004, ApJ, 609, 826
- (65) Kessler-Silacci, J., Augereau, J.-C., Dullemond, C.P. et al. 2006, ApJ, 639, 275
- (66) Kessler-Silacci, J., Dullemond, C.P., Augereau, J.-C. et al. 2007, ApJ, 659, 680
- (67) Krot, A.N., Fegley, B., Jr., Lodders, K., Palme, H.: In: Mannings, V., Boss, A.P., Russel, S.S. (eds.), Protostars & Planets IV. University of Arizona Press. Tucson. 2000,, p.1019
- (68) Larimer, J.W. 1967, Geochimica et Cosmochimica Acta, 31, 1215
- (69) Lattimer, J.M., Schramm, D.N., Grossman, L. 1978, ApJ, 219, 230
- (70) Lisse, C.M., VanCleve, J., Adams, A.C. et al. 2006, Science, 313, 635
- (71) Malfait, K., Waelkens, C., Waters, L.B.F.M. 1998, A&A, 332, L25
- (72) Meeus G., Waters L.B.F.M., Bouwman J. et al. 2001, A&A, 365, 476
- (73) Meeus G., Sterzik M., Bouwman J. et al., 2003, A&A, 409, L25
- (74) Meeus G., Juhász A., Henning Th., et al. 2009, A&A, 497, 379
- (75) Men’shchikov, A.B., Henning, Th. 1997, A&A 318, 879
- (76) Michel, B., Henning, Th., Stognienko, R., Rouleau, F., 1996, ApJ, 468, 834
- (77) Min, M., Hovenier, J.W., de Koter, A. 2005, A&A, 432, 909
- (78) Min, M., Dominik, C., Hovenier, J.W., Koter, A., Waters, L.B.F.M. 2006, A&A, 445, 1005
- (79) Min, M., Waters, L.B.F.M., de Koter, A. et al. 2007, A&A, 462, 667
- (80) Min, M., Hovenier, J.W., Waters, L.B.F.M., de Koter, A. 2008, A&A, 489, 135
- (81) Molster, F.J., Waters, L.B.F.M., Tielens, A.G.G.M., Koike, C., Chihara, H. 2002, A&A, 382, 241
- (82) Moreels, G., Clairemidi, J., Hermine, P. et al. 1994, A&A 282, 643
- (83) Morrow, A.L., Luhman, K.L., Espaillat, C. et al. 2008, ApJ, 676, 143
- (84) Mutschke, H., Begemann, B., Dorschner, J., Henning, Th. 1994, Infrared Physics & Technology, 35, 361
- (85) Natta, A., Testi, L., Neri, R., Shepherd, D.S., Wilner, D.J. 2004, A&A, 416, 179
- (86) Natta, A., Testi, L., Calvet, N., Henning, Th., Waters, R., Wilner, D.: In: Reipurth, B., Jewitt, D., Keil, K. (eds.), Protostars & Planets V. University of Arizona Press. Tuscon. 2007. p. 767
- (87) Nuth, J.A., Donn, B. 1982, J. Chem. Phys., 77, 2639
- (88) Ossenkopf, V., Henning, Th., Mathis, J.S., 1992, A&A, 261, 567
- (89) Peeters, E., Hony, S., Van Kerckhoven, C. et al. 2002, A&A, 390, 1089
- (90) Pirali, O., Vervloet, M., Dahl, J.E. et al. 2007, ApJ, 661, 919
- (91) Pollack, J.B., Hollenbach, D., Beckwith, S. et al. 1994, ApJ, 421, 615
- (92) Pontoppidan, K.M., Dullemond, C.P., van Dishoeck, E.F. et al. 2005, ApJ, 622, 463
- (93) Przygodda, F., van Boekel, R., Abraham, P. et al. 2003, A&A, 412, L43
- (94) Rodmann, J., Henning, Th., Chandler, C.J., Mundy, L.G., Wilner, D.J. 2006, A&A, 446, 211
- (95) Sandford S.A. 1996, M&PS 31, 449
- (96) Sargent, B.A., Forrest, W.J., Tayrien, C. et al. 2009, ApJ, 690, 1193
- (97) Scholz, A., Jayawardhana R., Wood K. et al. 2007, ApJ, 660, 1517
- (98) Scott, E.R.D., Krot, A.N. 2005, ApJ, 623, 571
- (99) Semenov, D., Henning, Th., Helling, C. et al. 2003, A&A, 410, 611
- (100) Sicilia-Aguilar, A., Hartmann, L.W., Watson, D. et al. 2007, ApJ, 659, 1637
- (101) Sloan, G.C., Keller, L.D., Forrest, W.J. et al. 2005, ApJ, 632, 956
- (102) Spitzer, W.G., Kleinman, D.A. 1960, Phys. Rev., 121, 1324
- (103) Terada, H., Imanishi, M., Goto, M., Maihara, T. 2001, A&A, 377, 994
- (104) Tielens, A.G.G.M., Waters, L.B.F.M., Bernatowicz, T.J. 2005, ASPC 341, 605
- (105) van Boekel, R., Waters, L.B.F.M., Dominik, C. et al. 2003, A&A, 400, L21
- (106) van Boekel, R., Min, M., Leinert, Ch. et al. 2004, Nature, 432, 479
- (107) van Boekel, R., Min, M., Waters, L.B.F.M. et al. 2005, A&A, 437, 189
- (108) van Kerckhoven, C., Tielens, A.G.G.M. and Waelkens, C. 2002, A&A 384, 568
- (109) Voshchinnikov, N.V., Henning, Th. 2008, A&A, 483, L9
- (110) Voshchinnikov, N.V., Il’in, V.B., Henning, Th., Michel, B., Farafonov, V.G. 2000, JQRST, 65, 877
- (111) Voshchinnikov, N.V., Il’in, V.B., Henning, Th., Dubkova, D.N. 2006, A&A, 445, 167
- (112) Watson, D.M., Leisenring, J.M., Furlan, E. et al. 2009, ApJS, 180, 84
- (113) Whittet, D.C.B., Williams, P.M., Zealey, W.J., Bode, M.F., Davies, J.K. 1983, A&A 123, 301
- (114) Whittet, D.C.B., McFadzean, A.D., Geballe, T.R. 1984, MNRAS, 211, 29
- (115) Wooden, D., Desch, S., Harker, D., Gail, H.-P., Keller, L.: In: Reipurth, B., Jewitt, D., Keil, K. (eds.), Protostars & Planets V. University of Arizona Press. Tuscon. 2007. p.815
- (116) Zasowski, G., Kemper, F., Watson, D.M. et al. 2009, ApJ, 694, 459
- (117) Zolensky, M.E., Zega, Th.J., Yano, H. et al. 2006, Science, 314, 1735