Role of topological defects in the phase transition of modified XY model
: A Monte Carlo study
Abstract
Monte Carlo simulation has been performed on a classical two dimensional XY-model with a modified form of interaction potential to investigate the role of topological defects on the phase transition exhibited by the model. In simulations in a restricted ensemble without defects, the system appears to remain ordered at all temperatures. Suppression of topological defects on the square plaquettes in the modified XY-model leads to complete elimination of the phase transition observed in this model.
PACS: 05.10.Ln, 03.75.Lm, 64.60.an
1 Introduction
In 1984, Domany, Schick and Swendsen [1] introduced an extension of the two-dimensional (2D) XY-model where the classical spins (of unit length), located at the sites of a square lattice and free to rotate in a plane, say the XY plane (having no z-component) interact with nearest-neighbors through a modified potential
| (1) |
where is the angle between the nearest neighbor spins and is a parameter used to change the shape of the potential. For , the potential reduces to that of a conventional XY- model while with the increase in , the potential well gets narrower with a width and for it is essentially constant at . The shape of the potential is shown in Fig. 1 for several values of . The conventional 2D XY-model does not possess any true long range order [2] and it is known that in this model, non-singular spin wave excitations alone cannot destroy the quasi long range order (QLRO). However, the presence of topological defects leads to a QLRO-disorder phase transition, now familiar as the Kosterlitz-Thouless (KT) phase transition. Kosterlitz and Thouless [3, 4]predicted that topological singularities are both necessary and sufficient for the QLRO-disorder phase transition in the 2D XY-model and using a renormalization group (RG) approach they established that the phase transition is mediated by unbinding of vortices and anti-vortices which are stable topological defects in this system. The phase with QLRO is characterized by a slow algebraic decay of the spin-spin correlation function whereas a fast exponential decay is observed in a disordered system. The KT transition in the 2D XY model was unambiguously confirmed numerically by A. C. Irving and R. Kenna [5].
The modified XY-model of Eqn. (1) has been analyzed by a number of investigators [1, 6, 7, 8, 9, 10, 11, 12, 13, 14, 15] and they all were of the opinion that it exhibits a first order phase transition for large values of . However, some investigators [16, 17, 18] attempted to interpret the Monte Carlo (MC) results for the first order phase transition in other ways. In a recent work [19] we have shown by performing extensive numerical simulations on relatively larger lattice sizes (upto ) that the modified XY-model for large values of exhibits first order phase transition and all the finite size scaling rules for a first order phase transition were seen to be obeyed accurately. van Enter and Shlosman [12, 20] provided a rigorous proof of a first order phase transition in various SO(n)-invariant n-vector models which have a deep and narrow potential well and the model under investigation is a member of this general class of systems.
It was argued in Ref. [1] that more than one type of excitations (i.e., topological excitations as well as vacancy excitations) may play a role in changing the nature of the phase transition, as one would become relatively more important than the other by the alteration of the potential. Later Himbergen argued that topological excitations alone are sufficient to account for both the continuous and the first order phase transitions, but in a qualitatively different manner [6]. Algebraic topology or homotopy theory in the study of defects [21, 22] has a wide application in the physics of phase transition. In the present paper, we investigate the role of topological defects in the phase transition of the modified XY-model under consideration. We are specifically interested in inquiring whether the first order phase transition in the modified XY-model is defect driven or not. In other words, if in the absence of the role played by topological defects, would one observe the same order-disorder phase transition as the one found in the system with topological defects? If suppression of the defects changes the nature of the phase transition or eliminates it altogether, one may conclude that topological defects are necessary to describe the phase transition correctly.
The present work was motivated to a great extent by the work of Lau and Dasgupta [23] and Dutta and Roy [24]. Lau and Dasgupta have shown that hedgehogs (point singularities in the 3D Heisenberg model) are necessary for the phase transition in 3D Heisenberg model. They observed that if the formation of topological defects is suppressed in the 3D Heisenberg model, the system remains ordered at all temperatures and the transition to the disordered phase disappears altogether. Dutta and Roy performed MC simulations on planer and models which are known to exhibit a continuous and a first order phase transition respectively. It was noticed that the suppression of the defects in these models leads to a total disappearance of the phase transitions observed in these systems [24]. Other work, along the same line, that should be mentioned in this context, is that of Lammert [25]. These authors have shown in a MC study that the nature of the nematic-isotropic transition changes when one suppresses the formation of the stable line defects, called the disclination lines.
In the present work, we have found that topological defects are necessary for the existence and also for proper description of phase transitions exhibited by these class of models. We also find that the change in the nature of the phase transition that is observed with the change in the value of is due to a change in the role played by the topological defects in these systems.
We arrange the rest of the paper as follows : Section 2 describes the simulational procedures used in the present work. The results and discussions are then presented in Section 3 followed by the concluding remarks.
2 The simulation details
In order to study the behavior of the topological excitations and the role of topological defects in the phase transitions exhibited by the model under investigation, we have used the conventional Metropolis single spin update algorithm [26, 27] with some modifications in our MC simulation. We have found that while simulating a continuous lattice spin model using standard Metropolis algorithm, we need to adjust a parameter very carefully to generate a new a configuration. This parameter determines the amplitude of the random angular displacements of the spins and the results become very sensitive to the value of this parameter. In order to get rid of this difficulty of choosing the parameter, we generate a new spin configuration following the prescription of Wolff [28]. We take a random unit vector and a spin flip is defined as where is the dot product of and . Apart from this method of generating a new configuration, the rest of the algorithm is the standard Metropolis algorithm. Defining a spin flip in that way, our modified Metropolis algorithm is free from tuning any adjustable parameter while simulating a lattice spin model with continuous energy spectrum while the conditions of ergodicity and detail balance remain fulfilled. The Metropolis algorithm runs as follows: first we choose a spin at random from within the specified range. Then the change in energy associated with an attempted move is calculated. If , the attempted move is accepted. If , the attempted move is accepted with probability where is the dimensionless temperature.
The average defect pair density is calculated in the following way. A vortex (anti-vortex) is a topological defect in which the angle variable , specifying the direction of the order parameter, changes by in one circuit of any closed contour enclosing the excitation core. In order to trace out the topological defects, we consider a square plaquette in the physical space. Let , , and be the four spins at the corners of the square plaquette. The angles between these adjacent spins are calculated with proper sign and these are then summed algebraically to find the total angle. The square plaquette is said to enclose a vortex (topological charge ) when the sum equals or more precisely very close to , taking into account the possible numerical errors. The square plaquette is said to enclose a anti-vortex (topological charge ) if the sum equals . If the sum is zero, there is no topological defect in the plaquette. Average defect pair density (taking into consideration both vortices and anti-vortices) is calculated as the thermodynamic average of the absolute value of the vorticity summed over the entire lattice divided by the total number of spins. In this method, it is ensured that the net topological charge is always equal to zero in a system with periodic boundary conditions. It should be mentioned here that the smallest part of the system in real space that enclose a point defect is a triangle. We can divide each elementary square plaquette diagonally into two triangles. One could thus consider a triangular plaquette in the physical space as well to trace out topological defects. We have tested that the total number of topological charges in the entire lattice remains the same whether we choose a square plaquette or a triangular plaquette. Only topological charges of strength are considered since they are energetically favorable. In our investigation of the equilibrium behavior of topological defects near phase transition, we carried out simulations on system sizes with linear dimension , , and with periodic boundary conditions. Monte Carlo sweeps (MCS) were used for equilibration and MCS were used for calculating thermodynamic averages. One MC sweep is said to be completed when the number of attempted single spin moves equals the total number of spins in the system. The values of taken to study the variation of average defect pair density with are , , , , , , , and .
In order to implement the procedure of the suppression of topological defects in our model, a “chemical potential” term associated with the topological charges is included [23, 24]. The modified Hamiltonian in the simulation is given by
| (2) |
where is the angle between the nearest neighbor spins , and is the absolute value of the charge enclosed by the square plaquette. A positive value of ensures that the formation of the charges becomes expensive in terms of energy. So for positive , this “chemical potential” term has the effect of suppressing configurations containing defects. In simulation with this modified Hamiltonian, a calculation of , the energy change associated with an attempted move of a spin, involves calculations of the changes in topological charges associated with the four unit square plaquettes which share the spin under consideration. For almost complete suppression of the defects, the value of was chosen to be between and irrespective of temperature. The limit of Eqn. (2) indicates an ensemble in which configurations containing topological defects are not allowed. We started our simulation in that restricted ensemble with a configuration in which all the spins are aligned parallel to one another, ie, there is no topological defect. The restricted simulations were carried out by using the modified Metropolis spin update algorithm described earlier in this section. We performed our restricted simulations on system sizes with linear dimension , , and with periodic boundary conditions. The corresponds to an unrestricted simulation, where no suppression of topological defects take place.
For the purpose of calculating various thermodynamic quantities, we have used multiple histogram reweighting technique of Ferrenberg and Swendsen [29]. In the restricted simulations, MCS were taken for equilibration and MCS were used for computing the raw histograms (both energy and order parameter histograms). The value of was taken to be in order to carry out the restricted simulations.
3 Results and discussions
In this section we present in detail the results obtained from our simulations.
3.1 Behavior of topological excitations near phase transition
We used the method described in Sec. 2 to determine the average defect pair density () of the system. The variation of the with the dimensionless temperature is shown in Fig. 2 for several values of the parameter . The average defect pair density is found to increase sharply as increases through the transition temperature and appears to exhibit a sharp jump at , particularly for . Fig. 2 indicates that decreases as the values of increases. It is evident from Fig. 2 that for larger values of , at some temperature , vortices suddenly appear in great numbers and a first order phase transition takes place which is in accordance with the explanation of Himbergen [6]. It may be noted that Jonsson, Minnhagen and Nylen [11] also performed MC simulations on a 2D XY-model with a modified potential, which is essentially equivalent to that of Eqn. (1), and interpreted the first order transition to be of vortex unbinding type.
We have also studied the behavior of topological excitations with the parameter . The average defect pair density () as a function of the parameter is plotted in Fig. 3 for three different system sizes at a temperature which is above the transition temperature of the model for . We observe that above the transition temperature, the data for versus are nicely fitted by the following expression
| (3) |
Eqn. (3) takes into account both vortices and anti-vortices. The values of for the three system sizes are listed in Table 1. There is no significant system size dependence of the parameters and it may be noted that increases with . In the limit , the system contains only vortex excitations. This means that in the high limit, the system must be disordered even at very small temperatures and consequently the transition temperature must be very low. This is the reason behind the decrease in the transition temperature with increase in . In this context, we refer to the work of Romano [30] who, in a MC study of 2D generalized XY-model with spin component , discussed the nature of the phase transition with the variation of a generalized parameter.
We have also calculated the defect core energy () for various values of . Because there is always a positive energy cost associated with the creation of a vortex core, thermally excited vortices in thermal equilibrium always contribute terms proportional to to the partition function. Therefore the total number of topological charges () shows an exponential behavior at low temperatures and is given by
| (4) |
Taking natural logarithm on both sides of Eqn. (4)
| (5) |
The defect core energy for each is determined from the linear fit of the plot versus and Fig. 4 shows the plot of variation of versus . The defect core energy for model (which is known to exhibit a strongly first order phase transition) is found to be while that for model (which is known to exhibit a continuous phase transition) is found to be . This is in apparent contradiction with the main finding of Saito [31] who, in a MC study of a system of interacting dislocation vectors, predicted a continuous phase transition due to large core energy and a first order phase transition due to small core energy.
3.2 Restricted simulations with no defects
Before presenting our results of restricted simulations, we briefly define the thermodynamic quantities that we have evaluated. The MC simulations were carried out with the modified Hamiltonian given by Eqn. (2) where the new term acts as a “chemical potential” for the defects.
The specific heat is evaluated from the energy fluctuations
| (6) |
where is the dimensionless temperature and is the total number of spins. The average order parameter is given by
| (7) |
where is the angle that a spin makes with the preferred direction of orientation and the average is over the entire sample. The first rank pair correlation function is defined as
| (8) |
where and are two spins separated by a distance . The second rank pair correlation function is defined as
| (9) |
We did not find any evidence for a phase transition from the ordered to the disordered phase at any temperature in the simulations of the restricted ensemble where configurations containing defects are not allowed.
The energy histograms obtained for are shown in Fig. 5. For this lattice, simulations were performed at 12 different temperatures ranging from to . It is evident from the energy histograms that the dual peak nature of the histograms as obtained for an unrestricted simulation [19] disappears in a restricted simulation. It is known that the dual peak nature of the histograms is a signature of a first order transition where two phases can coexist at a given temperature.
Fig. 6 shows the temperature dependence of the average energy (E) for a number of lattices, as obtained by applying the histogram reweighting technique. For comparison, the same plots for unrestricted simulations (where no defect is suppressed) are shown by thick lines in the same figure. It is evident from the figure that the energy changes only gradually and smoothly with temperatures for the restricted simulations while a sharp variation of the same with temperature is observed in the unrestricted case. The average value of the order parameter defined in Eqn. (7), is, always nonzero for a finite size system. Hence we have studied the system size dependence of . The values of at versus are plotted in Fig. 7 and the system size dependence is, in fact, well fitted by the form with and . It is clear from Fig. 7 that there is no indication of extrapolating to zero in the thermodynamic limit and thereby suggesting a state with long range ferromagnetic order.
The specific heat was obtained from the energy fluctuation relation (Eqn. (6)). The specific heat data for in a restricted ensemble are shown by dashed line in Fig. 8 where the results for the unrestricted case are also shown by solid line for comparison. For clarity the data for the restricted and the unrestricted simulations are plotted in two different scales. While has a large peak height at the transition temperature in the unrestricted case, which presumably is a signal of a phase transition in a finite system, in the defect-free case the peak height is drastically reduced and almost disappears in comparison with the normal case (where no defect is suppressed). We would like to argue that, in the restricted ensemble, the existence of a peak in of insignificant height (compared to that of an unrestricted ensemble) over the temperature range cannot be a sign of a phase transition. These may be attributed to the fact that complete suppression of topological defects is never possible, there always exists a small number of residual charges in the system. We have also calculated the free energy like quantity from the energy histograms. It is defined as where is the histogram count of the energy distribution. Fig. 9 shows the plot of the quantity against for . The inset of Fig. 9 shows the same plot for the original model (Eqn. (1)) where a double well structure of equal depth at the transition temperature signals a first order transition. We observe the absence of any such double well structure in when defects are suppressed. We would be inclined to conclude from the results of and that the defect free phase exhibits no phase transition at all.
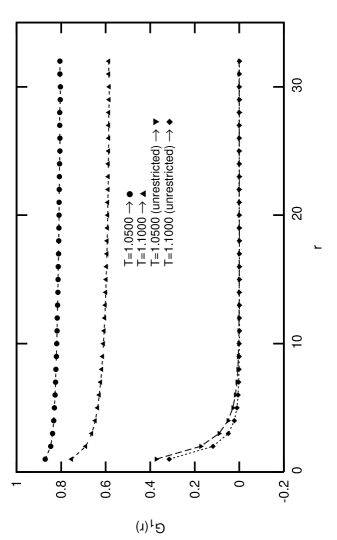
We now turn to pair correlation functions defined earlier in this section. Fig. 10 shows the plot of against for in the restricted as well as the unrestricted cases. The first rank pair correlation function for at temperatures and , which is much higher than the transition temperature of the original model, decays exponentially to zero in the unrestricted simulations, as it should, in the complete absence of long range order and a best fit with yields and for and and for . For the simulation where the defects are suppressed, decays algebraically and a best fit with yields the parameter , and for and , and for . It may be noted that the parameter is the asymptotic value of the pair correlation function. The next higher order correlation function against for is plotted in Fig. 11 at and for both the cases. The results indicate that decays algebraically in both the cases and long range order prevails in the system via higher order correlation functions.
We now need to address the question of phase space connectivity before arriving at the conclusion that topological defects are indeed necessary for the phase transition. Since we have used large values of in our restricted simulations in order to suppress the evolution of topological defects, we have to demonstrate that the observed behavior is not caused by trapping of the system in a small region of phase space with nonzero . Any MC study is guaranteed to generate appropriate ensemble averages if there is a path connecting any two points in the phase space with nonzero transition probability. We have investigated the phase space connectivity by observing the evolution of the order parameter and energy with MC sweeps. The connectedness is satisfied if the observed quantities for different initial states converge to the same final value. In Fig. 12, we have shown that for , after suppressing the defects (by using ) on the square plaquettes, the final values of the order parameter is same for three different initial configurations. This observation ensures that we can use a value of upto without violating the phase space connectivity and the observed non-vanishing of is not a result of trapping of the system in the phase space.
4 Conclusions
It is established in this paper that topological defects play a very crucial role in the phase transitions exhibited by the models we discussed. We have observed that the average defect pair density grows rapidly with the increase in (which increases the non-linearity of the potential well). For high , the potential well becomes narrower so that there is an insufficient increase in the defect density at low temperatures and then, at a certain temperature, they suddenly appear in the system in great numbers. Therefore it may be thought that for larger values of the class of models, we have investigated, behave like a dense defect system and give rise to first order phase transition as has been predicted by Minnhagen [8, 9, 10]. It has also been observed that the first order transition is eliminated totally when configurations containing topological defects are not allowed to occur and the system appears to remain ordered at all temperatures. Hence topological defects are necessary to account for the first order phase transition for larger values of .
Another point which must be mentioned before ending this section is the performance of the Metropolis algorithm with the modification discussed earlier in this paper. The modification makes us free from tuning any adjustable parameter while simulating a continuous model and this has resulted in the model being successfully simulated.
5 Acknowledgment
The authors acknowledge the award of a CSIR (India) research grant 03(1071)/06/EMR-II. One of us (SS) acknowledges the award of a fellowship from the same project. SS also thankfully acknowledges his colleague Subhrajit Dutta for helpful discussions.
References
- [1] E. Domany, M. Schick and R. H. Swendsen, Phys. Rev. Lett. 52, 1535 (1984).
- [2] N. D. Mermin and H. Wagner, Phys. Rev. Lett. 17, 1133 (1966).
- [3] J. M. Kosterlitz and D. J. Thouless, J. Phys. C 6, 1181 (1973).
- [4] J. M. Kosterlitz, J. Phys. C 7, 1046 (1974).
- [5] A. C. Irving and R. Kenna, Nucl. Phys. B 485, 583 (1997); Phys. Rev. B 53, 11568 (1996); Phys. Lett. B 351, 273 (1995).
- [6] J. E. van Himbergen, Phys. Rev. Lett. 53, 5 (1984).
- [7] T. Garel, J. C. Niel and H. Orland, Europhys. Lett. 11, 349 (1990).
- [8] P. Minnhagen, Rev. Mod. Phys. 59, 1001 (1987).
- [9] P. Minnhagen, Phys. Rev. Lett. 54, 2351 (1985).
- [10] P. Minnhagen, Phys. Rev. B 32, 3088 (1985).
- [11] A. Jonsson, P. Minnhagen and M. Nylen, Phys. Rev. Lett. 70, 1327 (1993).
- [12] A. C. D. Van Enter and S. B. Shlosman, Phys. Rev. Lett. 89, 285702 (2002).
- [13] R. H. Swendsen, Phys. Rev. Lett. 49, 1302 (1982).
- [14] S. Sinha and S. K. Roy, Phys. Lett. A 373, 308 (2009).
- [15] S. Ota and S. B. Ota, Int. J. Mod. Phys. B 21, 3591 (2007).
- [16] H. J. F. Knops, Phys. Rev. B 30, 470 (1984).
- [17] J. E. van Himbergen, Solid State Commun. 55, 289 (1985).
- [18] F. Mila, Phys. Rev. B 47, 442 (1993).
- [19] S. Sinha and S. K. Roy, To appear in Phys. Rev. E (In Press).
- [20] A. C. D. van Enter and S. B. Shlosman, Commun. Math. Phys. 255, 21 (2005).
- [21] N. D. Mermin, Rev. Mod. Phys. 51, 591 (1979).
- [22] R. Kenna, Condensed Matter Physics 9, 283 (2006).
- [23] M. Lau and C. Dasgupta, Phys. Rev. B 39, 7212 (1989).
- [24] S. Dutta and S. K. Roy, Phys. Rev. E 70, 066125 (2004).
- [25] P. E. Lammert, D. S. Rokhsar and J. Toner, Phys. Rev. E 52, 1778 (1995); Phys. Rev. Lett. 70, 1650 (1993)
- [26] N. Metropolis, A. W. Rosenbluth, M. N. Rosenbluth, A. H. Teller and E. Teller, J. Chem. Phys. 21, 1087 (1953).
- [27] Monte Carlo Methods in Statistical Physics, M. E. J. Newman and G. T. Barkema (Clarendon Press, Oxford, 1999).
- [28] U. Wolff, Phys. Rev. Lett. 62, 361 (1989); Nucl. Phys. B 322, 759 (1989).
- [29] A. M. Ferrenberg and R. H. Swendsen, Phys. Rev. Lett. 61, 2635 (1988); 63, 1195 (1989)
- [30] L. A. S. Mol, A. R. Pereira, H. Chamati and S. Romano, Eur. Phys. J. B 50, 541 (2006)
- [31] Y. Saito, Phys. Rev. Lett. 48, 1114 (1982).