A direct limit on the turbulent velocity of the intracluster medium in the core of Abell 1835 from XMM-Newton
Abstract
We examine deep XMM-Newton Reflection Grating Spectrometer (RGS) observations of the X-ray luminous galaxy cluster A1835. For the first time in a galaxy cluster we place direct limits on turbulent broadening of the emission lines. This is possible because the coolest X-ray emitting gas in the cluster, which is responsible for the lines, occupies a small region within the core. The most conservative determination of the 90 per cent upper limit on line-of-sight, non-thermal, velocity broadening is , measured from the emission lines originating within 30 kpc radius. The ratio of turbulent to thermal energy density in the core is therefore less than 13 per cent. There are no emission lines in the spectrum showing evidence for gas below keV. We examine the quantity of gas as a function of temperature and place a limit of (90 per cent) for gas cooling radiatively below 3.85 keV.
keywords:
X-rays: galaxies — intergalactic medium — galaxies: clusters: individual: Abell 1835 — cooling flows1 Introduction
Little direct information is known about the dynamical state or microphysics of the intracluster medium (ICM). Simulations of galaxy clusters within a cosmological environment predict that as matter accretes along filaments, or as clusters merge, turbulent motions should be set up in the ICM. This energy should then cascade from large to small scales where it can be dissipated. Simulations have predicted that even in the most relaxed clusters there are substantial flows of ICM (e.g. Evrard 1990). In these simulations the fraction of pressure support in gas motions is typically 5 to 15 per cent. Most simulations, however, have not included physical processes which may be relevant, such as viscosity or magnetic fields.
In addition, it is observed that the active galactic nuclei (AGN) in cluster cores inject jets and bubbles of relativistic plasma into their surroundings. The feedback of energy into the cluster is thought to combat the high radiative losses of energy which would otherwise lead to substantial cooling rates (for reviews see Peterson & Fabian 2006 and McNamara & Nulsen 2007). It is predicted that feedback could induce gas motions in the core in the range (Brüggen et al., 2005). Some models also require turbulence in order to heat the ICM using the energy in inflated cavities (e.g. Scannapieco & Brüggen 2008). Strong turbulent motions would provide significant non-thermal pressure support. This would bias the determination of cluster mass profiles measured under the assumption of hydrostatic equilibrium. The measurement of turbulence is thus important for mass determination, as well as AGN feedback.
Evidence for resonance scattering has also been used to place upper limits on turbulence in elliptical galaxies. In NGC 4636, Xu et al. (2002) examined the strength of the resonantly scattered 15Å Fe xvii line relative to the line at 17.1Å, inferring scattering. As turbulence broadens emission lines and prevents scattering, they obtained an upper limit on the turbulent velocity dispersion of 10 per cent of the sound speed. For the same object, Werner et al. (2009) calculated a limit of 25 per cent of the sound speed, with an implied maximum of 5 per cent of energy in turbulent motions.
The Perseus cluster is an interesting test case. The tens of kpc long quasi-linear filaments (Fabian et al., 2003b) imply laminar flow, significant viscosity in the ICM and low levels of turbulence on the scale of the filaments. However, the lack of evidence for resonant scattering in the strongest 6.7 keV line of He-like iron in Perseus argues for velocity spread of at least half the sound velocity (Churazov et al., 2004). Rebusco et al. (2005) also require motions of on scales of to account for the overall metallicity profile in Perseus.
Comparing the gravitational mass profiles derived from optical and X-ray data in M87 and NGC 1399, Churazov et al. (2008) obtained combined nonthermal pressures of per cent of the thermal gas pressure. Reynolds et al. (2005) simulated the evolution of cavities in the ICM, requiring viscous processes in order for the cavities to retain the observed spherical cavity shapes and prevent them from being shredded by instabilities (Reynolds et al., 2005; Dong & Stone, 2009). A lower limit of 10 per cent of the total pressure in turbulence was found in the Coma cluster by Schuecker et al. (2004). The Coma cluster is unrelaxed with two central galaxies. It is unlikely that it can be directly compared to relaxed clusters or ellipticals. In summary, the evidence for turbulence in relaxed clusters is uncertain.
A1835 (at ) is the most luminous cluster in the BCS sample (Ebeling et al., 1998), with an inferred cooling rate of in the absence of heating (Allen et al., 1996). The optical-spectroscopic-derived rate of star formation in the central galaxy is 40–70(Crawford et al., 1999). The IR luminosity of the object is (Egami et al., 2006), implying a star formation rate of . In addition there is of molecular gas in the cluster (Edge, 2001).
Despite the evidence for star formation, cool gas and the high X-ray luminosity, little X-ray emitting gas was seen in this cluster below 1–2 keV when it was observed using the XMM-Newton RGS instruments (Peterson et al., 2001). Less than cools below 2.7 keV (90 per cent confidence). AGN feedback, at a level of , prevents most of the X-ray gas from cooling. Later observations confirmed the lack of X-ray cool gas is a common feature of clusters (e.g. Peterson et al. 2003).
In this paper we examine deep RGS observations of A1835 totalling 254 ks, placing limits on velocities in the gas and the amount of cool gas detectable in X-rays. We use a Hubble constant of and the relative Solar metallicities of Anders & Grevesse (1989). 1 arcsec corresponds to 3.94 kpc at . Errors quoted are unless stated otherwise.
2 RGS spectra
We examined three XMM-Newton RGS observations (0098010101, 0551830101 and 0551830201). We extracted the RGS spectrum from the datasets using the standard sas 9.0 rgsproc tool. We used a 90 per cent PSF width extraction region (corresponding to a half-width of approximately 30 arcsec), and a 90 per cent pulse-height distribution energy selection. To eliminate flares, we removed time periods with a count rate greater than on CCD 9, selecting events with FLAG set to 8 or 16 and a cross dispersion angle greater than .
Background spectra were generated from the observations, extracted from the region beyond a 98 per cent of PSF width. We tested that the backgrounds were essentially source free by comparison with template background spectra. The wavelength binning option was used so that we could combine the spectra from both RGS instruments using rgscombine. We combined the spectra, backgrounds and responses from all observations, treating the first and second order spectra separately.
| Parameter | Without rgsxsrc | With rgsxsrc |
|---|---|---|
| kT (keV) | ||
| O () | ||
| Ne () | ||
| Mg () | ||
| Si () | ||
| Fe () | ||
| normalization (cm-5) | ||
| C statistic | 3947.9 | 3956.4 |
2.1 Single temperature model
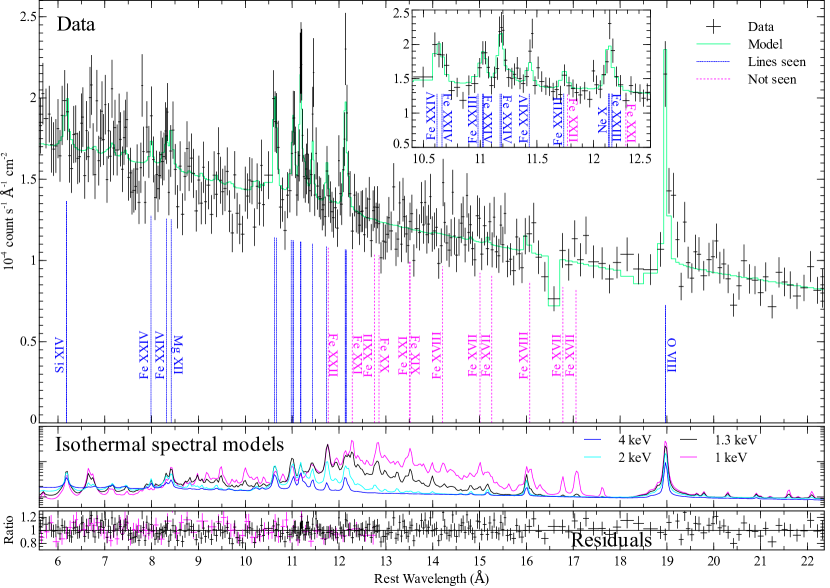
We show in Fig. 1 the first order combined spectra with the best fitting thermal model. We used the spex version 2.00.11 thermal model (Kaastra & Mewe, 2000), converted to an apec format table for xspec, with Galactic absorption fixed at (Kalberla et al., 2005). We fitted both spectral orders simultaneously, using a wavelength range of 7 to 28Å and 7 to 16Å for the 1st and 2nd orders, respectively. The O, Ne, Mg, Si and Fe metallicities were allowed to be free in the fit with the other elemental abundances tied to Fe, except He which was fixed to Solar. Ni and Ca lines in the fitted spectral region are too weak to fit separately. We allow a normalization offset between the two orders (the 2nd order gives a best fitting normalization 3 per cent greater than the 1st order spectrum). We fit the spectrum minimizing the C statistic on the ungrouped spectra in xspec 12.5.1 (Arnaud, 1996). The thermal broadening option was enabled when fitting the spectra.
The C statistic does not provide a goodness of fit, but the xspec goodness command calculated 50.9 per cent of Monte Carlo realisations of the best fitting model have a better fit statistic than the real data, indicating a good fit. If the spectra are fit with the same model but using statistics, the reduced is (grouping to have at least 20 counts per channel). Shown in the lower panel of Fig. 1 are the rebinned residuals of the single temperature model to the first and second order spectra. The best fitting model parameters are shown in Table 1 (under the column without rgsxsrc). The low Fe abundance is interesting. This could be significantly affected by how much continuum emission is from hotter plasma ( keV) outside the cluster core, which is not well constrained by lines in the RGS band. We note that the line complexes at 11.4 and 12.2Å are underpredicted by our model, which we could not match by adding additional temperature components.

Fig. 1 shows the positions of emission lines that are seen by eye in the spectrum and the positions of lines that are not seen. All ionization states of Fe seen are Fe xxiii and above. The detections of Fe xxiii are not definite as they are blended with other lines (Fe xxiv and Ne x). If we plot the total line emissivity of ionization states seen and not observed in the spectrum as a function of temperature (Fig. 2), there are no obvious lines that indicate gas at temperatures below keV. This is also seen by comparison with the isothermal spectral models in the middle panel of Fig. 1.
If we add a further component with the same metallicities as the first, it has a best fitting temperature of keV and an xspec normalization of cm-5, but is only significant at the 90 per cent confidence interval.
2.2 Smoothing model (rgsxsrc)
As the cluster is not a point source and the RGS instruments are slitless spectrometers, the observed spectra are broadened according to the spatial extent of the source. This broadening is approximately (Brinkman et al., 1998), where is the spectral order and is the half energy width of the source in arcmin. The effect is relatively small in A1835, relative to nearby clusters.
Broadening was modelled using the rgsxsrc model in xspec with an input Chandra image in the 0.8 to 1 keV band. The position angle of XMM was similar between the observations (). rgsxsrc assumes that the source has the same spectrum as a function of position, so is not completely correct if different emission lines come from different radii in the cluster.
The second column in Table 1 shows the small effect of this smoothing on the fit parameters. The fit quality is slightly poorer after accounting for smoothing, suggesting that the emission lines may be emitted on a smaller scale than the broader X-ray emission (Section 3). The goodness command gave 54.6 per cent of realisations of the best fitting model with a better fit than the data.
2.3 Limits on velocity broadening of the spectra
Since the lines are remarkably narrow, and the source extent is small, we can limit the velocity broadening. We fitted the spectra in Section 2.1 with the bvapec model in xspec assuming that the spectra were broadened by the thermal motion of the ions in the gas (version 12.5.0ah of xspec fixed an error in the line widths) and line-of-sight velocity broadening added in quadrature. The spex spectral lines were used in the bvapec model.
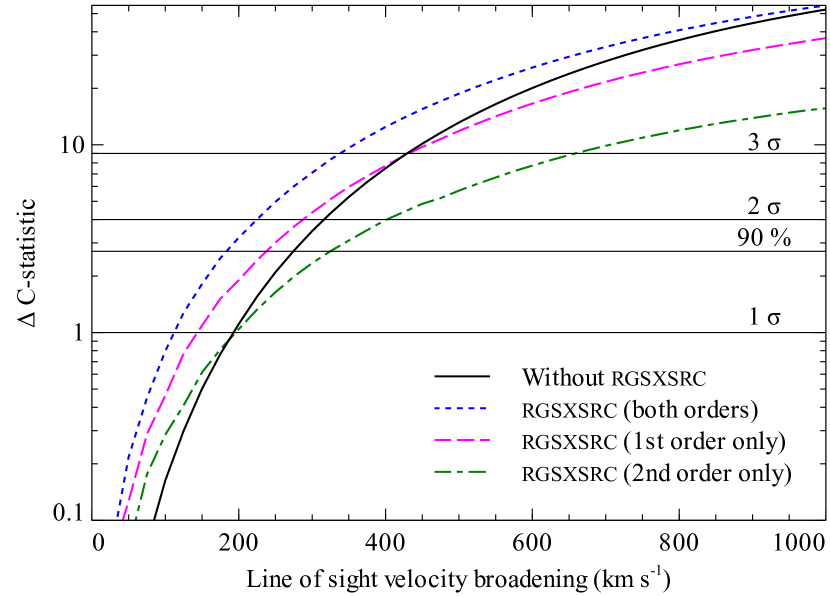
We show the change in fit statistic as a function of velocity in Fig. 3. If we conservatively treat the cluster as a point source and do not use the rgsxsrc model we obtain a 90 per cent upper limit of . This limit is improved to with the addition of the broadening model. Examining just the Fe-L spectral region between 9.6 and 12.8Å (rest), we obtain a limit of , and for the 1st order spectrum between 13.6 and 22.4Å, containing the strong O viii line, a limit of . We confirmed that such constraints are readily achievable with simulated spectra.
2.4 Limits on cooling gas
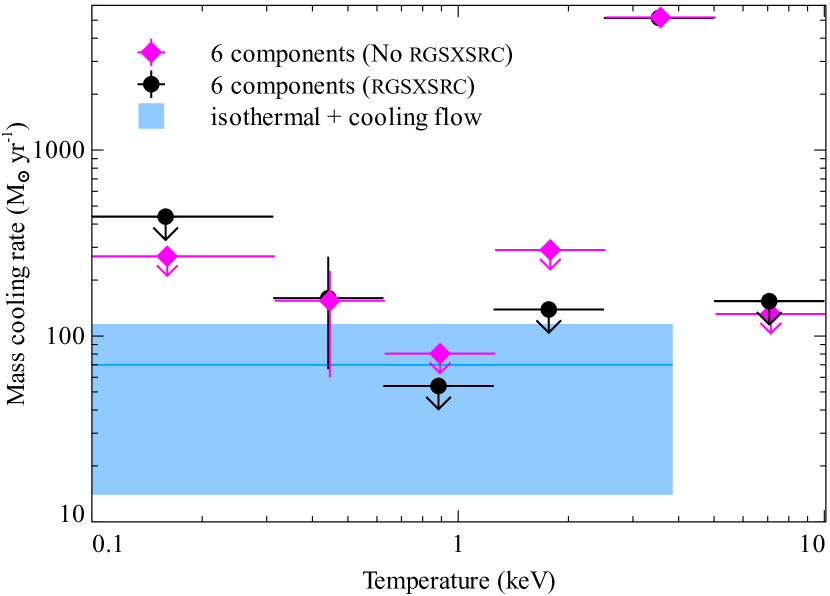
We can limit how much gas can be cooling within temperature bins. We constructed a model using six cooling flow model vmcflow components (constructed using spex models) with temperature ranges of keV. We fixed the components to have the same metallicities, allowing individual elements to vary as in Section 2.1. The maximum cooling rates in , assuming isobaric cooling, were free parameters in the fit. The results are shown in Fig. 4, with and without the rgsxsrc smoothing component.
For comparison, we also fitted a model made up of an isothermal component plus a model cooling from its temperature to zero. The best fitting temperature of the isothermal component was 3.85 keV (close to the single temperature fits). We obtain cooling rates from this temperature to zero of . This rate is shown by the shaded bar in Fig. 4. The 90 per cent upper limit is . A Markov Chain Monte Carlo analysis produces very similar values. Comparing an isothermal to isothermal plus cooling flow model with an F-test and statistics gives a chance improvement of the of 17 per cent.
3 Cluster property profiles
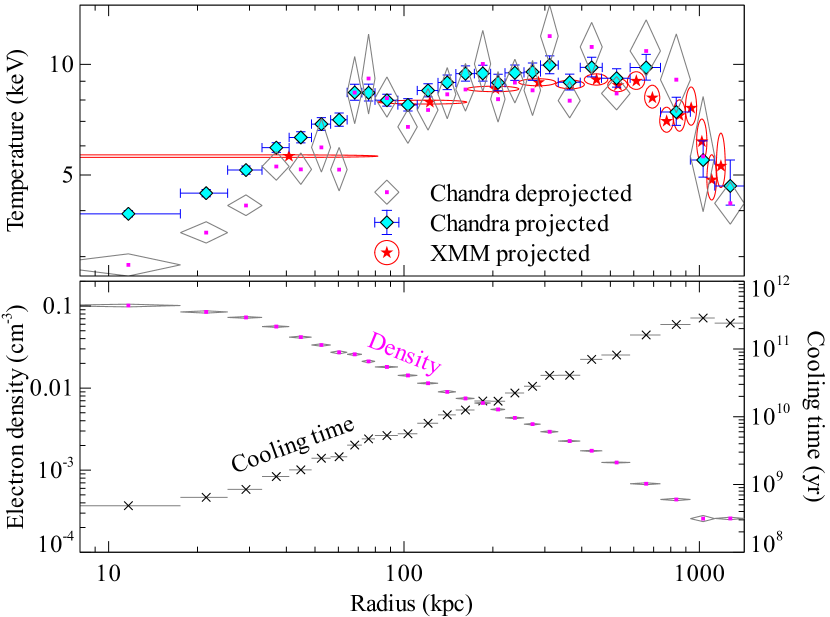
For comparison with the RGS results we show projected Chandra and XMM EPIC-MOS temperature profiles and deprojected Chandra temperature, density and cooling time profiles. (Fig. 5). We examined Chandra datasets 6680, 6881 and 7370 (total 170 ks, cleaned), reprocessed applying VFAINT filtering. Blank-sky background spectra were used, scaled to the observed 9–12 keV count rates, providing a good match to the data in the field outskirts. emchain was used to process each MOS dataset, removing bad time periods with a 10–15 keV rate . Scaled blank-sky spectra were used as backgrounds. There was a small mismatch between the background and data in the outskirts which we modelled as a uniform model component.
There is a good match between the XMM and Chandra projected profiles, except where the PSF of XMM is important in the centre. In the core of the cluster the temperature drops to less than 3 keV and the cooling time is around . The entropy of the gas in the central region drops to . The metallicity rises smoothly inwards from 0.2 to . The temperature from the RGS spectral fit, 3.7 keV, is emitted from within 30 kpc radius (8 arcsec), essentially a point source for the RGS.
4 Discussion
The limits we place on the broadening of the emission lines by non-thermal motions of the ICM are the first direct limits on turbulence in cool core clusters. As the cooler gas below 4 keV is located within 8 arcsec of the core (Fig. 5), the conservative point-source limit of a line-of-sight velocity of is more appropriate than the smaller rgsxsrc value. This velocity is 28 per cent of the sound speed at the measured temperature.
Using equation 11 in Werner et al. (2009) we can calculate the ratio of turbulent to thermal energy density, , where is our measured line-of-sight velocity, is the mean particle mass, is the proton mass and is the temperature. We obtain a 90 per cent confidence upper limit of 13 per cent on the energy density in turbulence.
Our upper limit is compatible with the values of 5 to 15 per cent of pressure in gas motions, calculated using high resolution Eulerian simulations (Lau et al., 2009; Vazza et al., 2009). If viscosity is significant in clusters, as indicated by the quasi-linear filaments in Perseus (Fabian et al., 2003b), the real value is likely to be lower than simulations predict. The low turbulent pressure limit we measure from the core of this cluster is encouraging for the measurement of cosmological parameters using cluster mass profiles (e.g. Allen et al. 2008). Low turbulence implies that viscosity is significant. Sound waves generated by the AGN are then damped, heating the inner ICM (Fabian et al., 2003a).
Our results also suggest that the feedback taking place in this cluster is not inducing large amounts of turbulence in the gas in the cluster core. The feedback must be gentle. The limit on turbulent velocities we obtain is much lower than the turbulence required in Perseus to prevent resonance scattering (Churazov et al., 2004). However, the region studied in Perseus was large and may contain differential laminar motions. Shearing motions, rather than turbulence, may limit resonant scattering. The velocity limit we find is consistent with the velocity shear of seen in H emission for the central 31 kpc diameter nebula around the central cluster galaxy (Wilman et al., 2006).
The RGS instruments have been used to measure line widths in extended Galactic objects (e.g. Rasmussen et al. 2001). We have shown here that the instruments are also capable of usefully constraining turbulent velocities for X-ray bright and peaked clusters, of which this is the first. Non-cool-core clusters and mergers are not so spatially compact, making limits more difficult to measure. ASTRO-H will measure the ICM velocity distribution in a wider range of objects and with much greater precision. IXO will map the velocity distribution over cluster cores and to higher redshifts.
We are able to confirm the extremely low rates of gas cooling to low temperatures first measured by Peterson et al. (2001). The distribution does not, however, appear to be a powerlaw as seen in other objects (Peterson et al., 2003), at least below 4 keV. There is weak evidence for an additional residual cooling component at around at 0.6 keV. This rate of cooling, and our other limits, are compatible with an optical-spectroscopic-derived star formation rate of 40–70(Crawford et al., 1999) and of from UV fluxes (Hicks & Mushotzky, 2005), if the star formation is fed by cooling ICM. McNamara et al. (2006) suggest that the central galaxy hosts an extremely radiatively inefficient black hole the jet power of which is large enough to offset a large fraction of the cooling in this object.
Feedback is not completely balanced in this cluster, as is evident by the high star formation rate, high IR luminosity and large amounts of molecular gas. A residual level of cooling of 10 per cent of the X-ray luminosity-inferred rate remains. Future detailed simulations and modelling may allow us to place detailed constraints on the temperature, velocity and spatial distribution using distant luminous clusters like A1835.
5 Conclusions
For the first time we measure meaningful constraints of the ICM turbulent velocity from the width of the X-ray emission lines. We place a limit of 13 per cent on the turbulent energy density as a fraction of the thermal energy density. We also constrain the cooling rate of X-ray emitting gas in A1835 to a value comparable to the star formation rate.
Acknowledgements
ACF thanks the Royal Society for support. JRP is supported by NASA grant #NNX08AX45G. We thank Helen Russell for providing the Chandra spectra of this cluster and an anonymous referee for helpful comments.
References
- Allen et al. (1996) Allen S. W., Fabian A. C., Edge A. C., Bautz M. W., Furuzawa A., Tawara Y., 1996, MNRAS, 283, 263
- Allen et al. (2008) Allen S. W., Rapetti D. A., Schmidt R. W., Ebeling H., Morris R. G., Fabian A. C., 2008, MNRAS, 383, 879
- Anders & Grevesse (1989) Anders E., Grevesse N., 1989, Geochim. Cosmochim. Acta, 53, 197
- Arnaud (1996) Arnaud K. A., 1996, in Jacoby G. H., Barnes J., ed, ASP Conf. Ser. 101: Astronomical Data Analysis Software and Systems V, p. 17
- Brinkman et al. (1998) Brinkman A. et al., 1998, in Proceedings of the First XMM Workshop on Science with XMM, http://xmm.esac.esa.int/
- Brüggen et al. (2005) Brüggen M., Hoeft M., Ruszkowski M., 2005, ApJ, 628, 153
- Churazov et al. (2004) Churazov E., Forman W., Jones C., Sunyaev R., Böhringer H., 2004, MNRAS, 347, 29
- Churazov et al. (2008) Churazov E., Forman W., Vikhlinin A., Tremaine S., Gerhard O., Jones C., 2008, MNRAS, 388, 1062
- Crawford et al. (1999) Crawford C. S., Allen S. W., Ebeling H., Edge A. C., Fabian A. C., 1999, MNRAS, 306, 857
- Dong & Stone (2009) Dong R., Stone J. M., 2009, ApJ, 704, 1309
- Ebeling et al. (1998) Ebeling H., Edge A. C., Bohringer H., Allen S. W., Crawford C. S., Fabian A. C., Voges W., Huchra J. P., 1998, MNRAS, 301, 881
- Edge (2001) Edge A. C., 2001, MNRAS, 328, 762
- Egami et al. (2006) Egami E. et al., 2006, ApJ, 647, 922
- Evrard (1990) Evrard A. E., 1990, ApJ, 363, 349
- Fabian et al. (2003a) Fabian A. C., Sanders J. S., Allen S. W., Crawford C. S., Iwasawa K., Johnstone R. M., Schmidt R. W., Taylor G. B., 2003a, MNRAS, 344, L43
- Fabian et al. (2003b) Fabian A. C., Sanders J. S., Crawford C. S., Conselice C. J., Gallagher J. S., Wyse R. F. G., 2003b, MNRAS, 344, L48
- Hicks & Mushotzky (2005) Hicks A. K., Mushotzky R., 2005, ApJ, 635, L9
- Kaastra & Mewe (2000) Kaastra J. S., Mewe R., 2000, in Bautista M. A., Kallman T. R., Pradhan A. K., ed, Atomic Data Needs for X-ray Astronomy, p. 161, p. 161
- Kalberla et al. (2005) Kalberla P. M. W., Burton W. B., Hartmann D., Arnal E. M., Bajaja E., Morras R., Pöppel W. G. L., 2005, A&A, 440, 775
- Lau et al. (2009) Lau E. T., Kravtsov A. V., Nagai D., 2009, ApJ, 705, 1129
- McNamara & Nulsen (2007) McNamara B. R., Nulsen P. E. J., 2007, ARA&A, 45, 117
- McNamara et al. (2006) McNamara B. R. et al., 2006, ApJ, 648, 164
- Peterson & Fabian (2006) Peterson J. R., Fabian A. C., 2006, Phys. Rep., 427, 1
- Peterson et al. (2003) Peterson J. R., Kahn S. M., Paerels F. B. S., Kaastra J. S., Tamura T., Bleeker J. A. M., Ferrigno C., Jernigan J. G., 2003, ApJ, 590, 207
- Peterson et al. (2001) Peterson J. R. et al., 2001, A&A, 365, L104
- Rasmussen et al. (2001) Rasmussen A. P., Behar E., Kahn S. M., den Herder J. W., van der Heyden K., 2001, A&A, 365, L231
- Rebusco et al. (2005) Rebusco P., Churazov E., Böhringer H., Forman W., 2005, MNRAS, 359, 1041
- Reynolds et al. (2005) Reynolds C. S., McKernan B., Fabian A. C., Stone J. M., Vernaleo J. C., 2005, MNRAS, 357, 242
- Russell et al. (2008) Russell H. R., Sanders J. S., Fabian A. C., 2008, MNRAS, 390, 1207
- Scannapieco & Brüggen (2008) Scannapieco E., Brüggen M., 2008, ApJ, 686, 927
- Schuecker et al. (2004) Schuecker P., Finoguenov A., Miniati F., Böhringer H., Briel U. G., 2004, A&A, 426, 387
- Vazza et al. (2009) Vazza F., Brunetti G., Kritsuk A., Wagner R., Gheller C., Norman M., 2009, A&A, 504, 33
- Werner et al. (2009) Werner N., Zhuravleva I., Churazov E., Simionescu A., Allen S. W., Forman W., Jones C., Kaastra J. S., 2009, MNRAS, 398, 23
- Wilman et al. (2006) Wilman R. J., Edge A. C., Swinbank A. M., 2006, MNRAS, 371, 93
- Xu et al. (2002) Xu H. et al., 2002, ApJ, 579, 600