Strangeness Excitation Functions and Transition from Baryonic to Mesonic Freeze-Out.
Abstract
The sharp peak in the ratio in relativistic heavy-ion collisions is discussed in the framework of the Statistical Model. In this model a rapid change is expected as the hadronic gas undergoes a transition from a baryon-dominated to a meson-dominated gas. The maximum in the ratio is well reproduced by the Statistical Model, but the change in the ratio is somewhat less pronounced than the one observed by the NA49 collaboration. The calculated smooth increase of the ratio and the shape of the and ratios exhibiting maxima at different incident energies is consistent with the presently available experimental data. We conclude that the measured particle ratios with deviations agree with a hadronic freeze-out scenario. These deviations seem to occur just in the transition from baryon-dominated to meson-dominated freeze-out.
12.40.Ee, 25.75.Dw
1 Introduction
The NA49 Collaboration has obtained yields of strange particles in central Pb-Pb collisions at 20, 30, 40, 80 and 158 GeV beam energies [1, 2, 3, 4, 5]. An interesting result from this energy scan is the pronounced maximum in the and ratios around 30 GeV beam energy. Such a behaviour, which is not observed in collisions, has lend support to speculations that a phase transition has been seen in heavy ion collisions [6, 7]. A more conventional interpretation has been presented within the hadron gas model [8] which describes the results qualitatively very well with the possible exception of the sharpness of the peak.

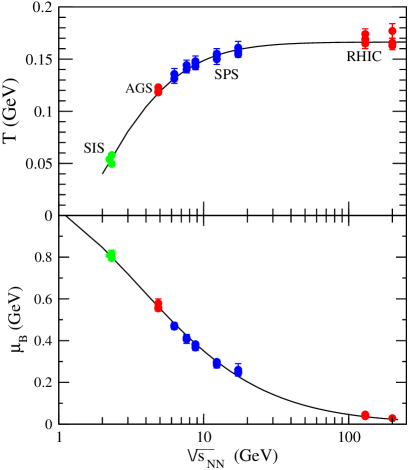
A summary of the Statistical Model results for the chemical freeze-out temperatures and baryon chemical potentials at various energies is presented in Fig. 1. The freeze-out line shows a smooth change in going from the low energies at SIS to the highest available energies at RHIC, some of the more recent entries were obtained in [9, 10, 11]. Fig. 2 shows these values as a function of exhibiting for a rising curve which saturates above top SPS energies at a value of about 170 MeV. Note, that the parameters and show a smooth change with incident beam energy. The values obtained can be parameterized as
| (1) |
where GeV, GeV-1 and GeV-3, and
| (2) |
with GeV and GeV-1 [13].
2 Maximum relative strangeness content.
It is important to note that only the ratio exhibits a sharp maximum while the ratio shows a continuous rise with . Contours of constant values of the and ratios in the plane as calculated in the Statistical Model are shown in Fig. 3. The ratio exhibits a clear maximum just beyond the chemical freeze-out curve. Note that the position of the maximum in the ratio is different from that obtained for the ratio. Again the maximum of the ratio is just beyond the line of chemical freeze-out.
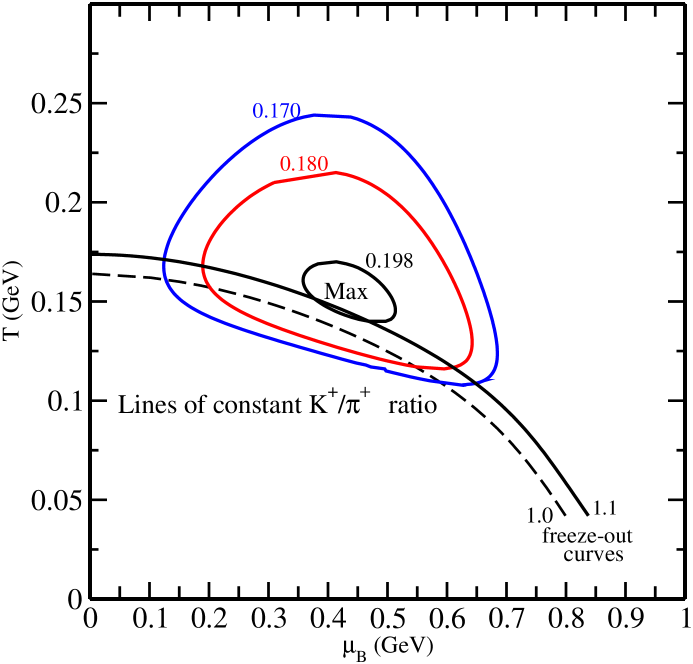
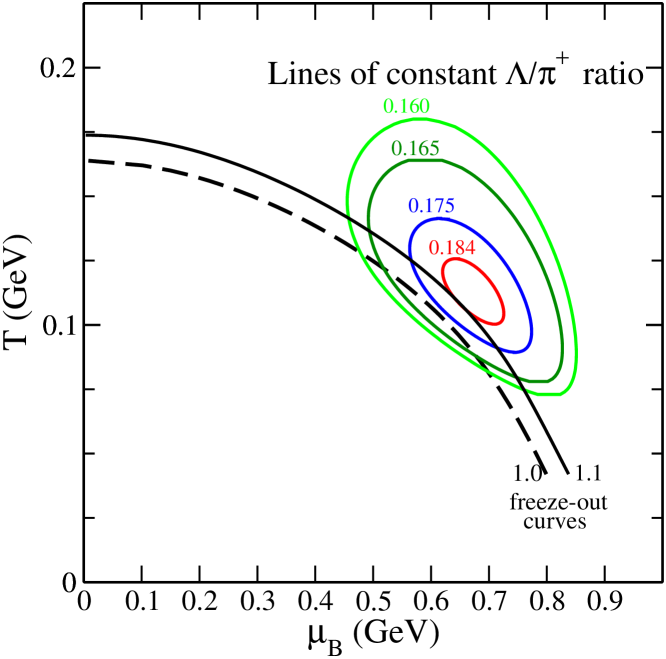
The Statistical Model describes the observed trends qualitatively, but not the sharp maximum in . Recently, the model has been extended to include higher resonances [15]. As these mostly decay into pions the strong drop of the ratio towards RHIC energies as observed in the data, is now better described. The appearance of the maxima can be traced to the specific dependence of and on the beam energy as also pointed out in Ref. [16]. The production of strange baryons dominates at low and loses importance at high incident energies when the yield of strange mesons increases. However, strange mesons also exhibit a maximum, albeit less pronounced. This is due to the fact that strangeness production at the lower energies occurs via the associated production, i.e. are created together with hyperons [17]. Therefore the mesons are affected by the properties of the baryons, but the are not.

3 Transition from Baryonic to mesonic freeze out
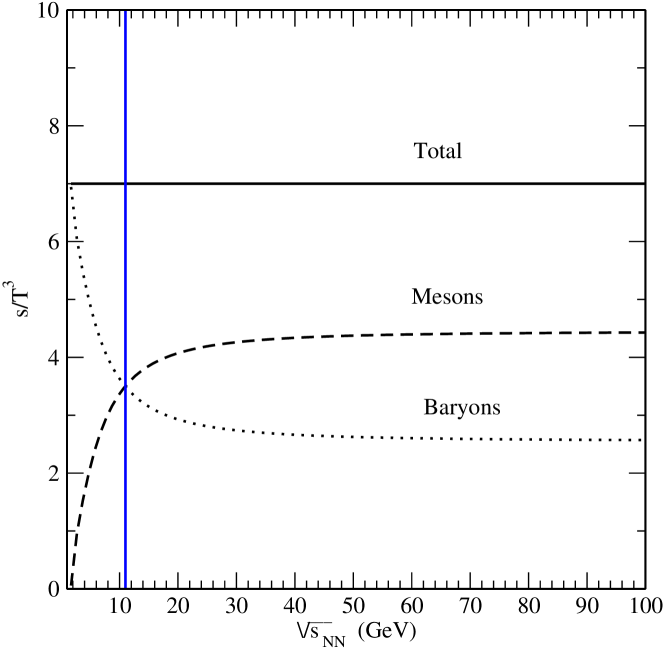
While the Statistical Model cannot fully explain the sharpness of the peak in the ratio, there are nevertheless several phenomena giving rise to the rapid change which warrant a closer look at the model. As shown in Fig. 4 a constant value for the ratio = 7 is a fairly good criterium to describe the freeze-out curve [13]. We use it here to describe the nature of the rapid change in the various ratios. Fig. 5-left shows the entropy density divided by as a function of beam energy as solid line. The separate contributions of mesons and of baryons to the total entropy are also shown by the dashed and dotted lines. There is a clear change of baryon to meson dominance, using the latest input of the Particle Data Group, including the heavy resonances, this is estimated to happen around = 11 GeV. Above this value the entropy is carried mainly by mesonic degrees of freedom. It is remarkable that the entropy density divided by is almost constant for all incident energies above the top AGS.
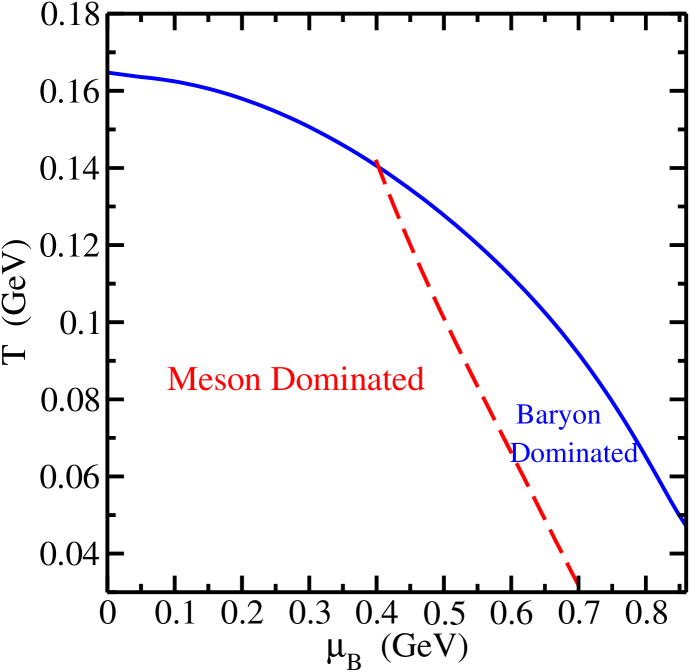
The separation line between meson dominated and baryon dominated areas in the plane is given in Fig. 5-right [18]. In this figure the separation line crosses the freeze-out line at the stated . This figure invites further speculations as e.g. an existence of a triple point.
4 Summary
It has been shown [8] that the Statistical Model yields a maximum in the relative strangeness content around 30 GeV. This is due to the saturation of the temperature while the chemical potential keeps decreasing with incident energy. Since the chemical potential plays a key role, it is clear that baryons are strongly affected. Indeed, all hyperon/ ratios yield maxima. In contrast, the ratio shows a continuously rising curve as expected. The ratio, however, exhibits a maximum at the lower incident energies as hyperon/. The model predicts that for different hyperon/ ratios the maxima occur at different energies. If experiments prove this, the case for a phase transition is weak.
The energy regime around 30 GeV seems to have specific properties. It has been shown that the entropy production occurs below this energy mainly via creation of baryons, while at the higher incident energies meson production dominates.
This work was supported by the German Ministerium für Bildung und Forschung (BMBF), the Polish Ministry of Science (MEN) and by the Alexander von Humboldt Foundation (AvH).
References
- [1] S.V. Afanasiev et al., (NA49 Collaboration), Phys. Rev. C66 (2002) 054902.
- [2] M. Gaździcki, (NA49 Collaboration), J. Phys. G: Nucl. Part. Phys. 30 (2004) S701.
- [3] T. Anticic et al., Phys. Rev. Lett. 93 (2004) 022302; C. Blume et al., J. Phys. G: Nucl. Part. Phys. 31 (2005) S685.
- [4] C. Alt et al. [NA49 Collaboration] Phys. Rev. C 77 (2008) 024903.
- [5] T. Anticic et al. [NA49 Collaboration] Phys. Rev. C 79 (2009) 044904.
- [6] M. Gaździcki and M.I. Gorenstein, Acta Phys. Polonica B 30 (1999) 2705.
- [7] R. Stock, J. Phys. G: Nucl. Part. Phys. 30 (2004) S633.
- [8] P. Braun-Munzinger, J. Cleymans, H. Oeschler, K. Redlich, Nucl. Phys. A 697 (2002) 902.
- [9] J. Takahashi (for the STAR collaboration) Journal of Physics G 35 (2008) 044007.
- [10] A. Schmah (for the HADES collaboration) presented at i SQM2009, Muzios, Brazil, Sept. 27 - Oct. 2, 2009.
- [11] P. Gasik (for the FOPI collaboration) presented at the 5th International Workshop on Critical Point and Onset of Deconfinement (CPOD) Brookhaven National Laboratory, June 8 - 12, 2009.
- [12] J. Cleymans and K. Redlich, Phys. Rev. Lett. 81 (1998) 5284; Phys. Rev. C 59 (1999) 1663.
- [13] J. Cleymans, H. Oeschler, K. Redlich and S. Wheaton, Phys. Rev. C 73 (2006) 034905.
- [14] S. Wheaton, J. Cleymans and M. Hauer, Computer Physics Communications, 180 (2009) 84-106.
- [15] A. Andronic, P. Braun-Munzinger and J. Stachel, Phys. Lett. B 673 (2009) 142.
- [16] S. Kabana, Eur. Phys. J. C21 (2001) 545.
- [17] J. Cleymans, A. Forster, H. Oeschler, K. Redlich and F. Uhlig, Phys. Lett. B 603 (2004) 146.
-
[18]
J. Cleymans, H. Oeschler, K. Redlich and S. Wheaton,
Phys. Lett. B 615 (2005) 50.