PULSATIONS AND LONG-TERM LIGHT VARIABILITY OF THREE
CANDIDATES TO PROTOPLANETARY NEBULAE
V. P. Arkhipova, N. P. Ikonnikova, G. V. Komissarova Sternberg Astronomical Institute, University Ave. 13, 119992 Moscow, Russia
Abstract
We present new photometric data and analysis of the long-duration photoelectric observations for three candidates to protoplanetary objects – F-supergiants with IR-excesses located at large galactic latitudes, IRAS , IRAS , and IRAS . All three stars have revealed quasiperiodic low-amplitude variabilities caused by pulsations observed against the long-term trends of brightnesses. For IRAS =V887 Her we have found a pulsation period of 109 days and a linear trend of brightness under the constant colours if being averaged over the year timescale. The light curve of IRAS =V1648 Aql over 2000–2008 can be approximated by a wave with a main period of 102 days which is modulated by close frequency, with a period of 98 days, that results in brightness oscillations with a variable amplitude. V1648 Aql has also shown synchronous reddening together with a persistent rise of brightness in the V-band. IRAS =V5112 Sgr experiences irregular pulsations with the periods of 39 and 47 days. The long-term component of the variability of V5112 Sgr may be related to the binary character of this star.
1 Introduction
After termination of the superwind stage at the tip of the asymptotic-giant branch (AGB), a star with the initial mass of 1 to 8 solar masses remains with a carbon-oxygen (CO) core, of , embedded into extended gaseous envelope which imitates such properties of supergiant stars as luminosity and gravitational acceleration. The star is also surrounded by the dust envelope which becomes more transparent during the expansion. The theoretical calculations by Blöcker (1995) indicates the following evolution of the star under the constant bolometric luminosity: while the star contracts gradually, its temperature rises. During the post-AGB stage of their evolution stars migrate to the left at the Herzsprung-Russell diagram suffering pulsational instabilities under certain temperatures (Gautschi 1993). Moreover, mass loss due to stellar wind persists at this evolutionary stage.
The aim of our photometric observations of post-AGB stars is the study of their variability origin: it may be pulsational activity, long-term evolution, evolution of their dust envelope, variable stellar wind, and/or binary status. In this work we present the results of almost 20 years observing three supergiants with IR-excesses – the candidates to protoplanetary objects which may represent the full illustration of various types of variability among this class objects.
2 Observations and Data Analysis
Table 1 contains the global data on the stars under studying. Besides the considerable IR-excess, their common properties are also high galactic latitude, the spectral class F, and rather low metallicity of their atmospheres.
Our photometric observations have been made in the Crimean observatory of the Sternberg Astronomical Institute, at the 60 cm Zeiss telescope, with photon-counting -photometer. During our observations we used the aperture of . The accuracy of individual estimates was 0.01 to 0.02 magnitudes, depending on weather conditions and star brightness. For two of three stars, V1648 Aql and V5112 Sgr, we involve also the data of the Automathic All-Sky Survey, ASAS (Pojmanski 2002). The analysis of the periodicity of light variations has been made with the software developed by V.M. Lyuty which is based on the Fourier-analysis approach proposed by Deeming.
| IRAS | HD | GCVS | sp | [Fe/H] | |||
|---|---|---|---|---|---|---|---|
| 18092+2704 | - | V887 Her | +20.2 | F3Ib1 | 66002 | 1.052 | -0.782 |
| 19386+0155 | - | V1648 Aql | -10.1 | F5I3 | 68004 | 1.44 | -1.14 |
| 19500–1709 | 187885 | V5112 Sgr | -21.0 | F0I3 | 80005 | 1.05 | -0.65 |
1 Hrivnak et al. (1988), 2 Klochkova (1995), 3 Suarez et al. (2006), 4Pereira et al. (2004), 5 Van Winckel & Reyniers (2000)
3 IRAS =V887 Her
3.1 The known properties
This supergiant with the IR-excess was discovered by Hrivnak et al. (1988) and classified by them as the most probable candidate to the protoplanetary objects. They obtained also the spectral type of the star – F3Ib, – and the first -estimates including the colour excess. Van der Veen et al. (1989) give the distance to the star of 2.4 kpc and the position above the plane of the Galaxy at pc. Later Klochkova (1995) have obtained an echelle spectrum of the star, have identified absorption lines in the spectral range of 5050–8700 Å, and have estimated the model atmosphere parameters: K, . [Fe/H] dex, and the CNO overabundance with respect to the solar ratio [X/Fe]. Tamura and Takeuti (1991) noted an inverse P Cyg-like profile of the H line. According to Klochkova (1995), the H contains the central absorption component and two emission component, blueshifted and redshifted ones. HST images of IRAS (Ueta et al. 2000) reveal bipolar reflective nebulosity of in diameter.
3.2 Our -observations
The starting point of the -observations of IRAS is September 3, 1987: Hrivnak et al. (1988) have obtained and .
We have started our observations of IRAS in 1990, and for the 19 years we have obtained more than 300 individual estimates of the star magnitudes in the -bands. As a comparison star, we used Tyc 2100-384-1 for which we had undertaken calibration procedure with the Johnson’s standard stars; the results of this calibration are: , , .
Early results have been published by us in the papers by Arkhipova et al. (1993) and Arkhipova et al. (2000). Also due to our efforts, the star has been inserted into the General Catalogues of Variable Stars as V887 Her with the variability type of SRD (Kazarovetz et al. 1993).
Fig. 1 presents light curves in the -band and colours and during the full period of our observations, 1990–2008. Against the total linear trend of the brightness, the star demonstrates low-amplitude quasi-periodic oscillations. After removing the trend, from the analysis of the 2000-2008 data we have found the period of the light variations for V887 Her, days. It is consistent with the result by Hrivnak and Lu (2000) who have found the variability of the radial velocity of IRAS with the period of 109 days.
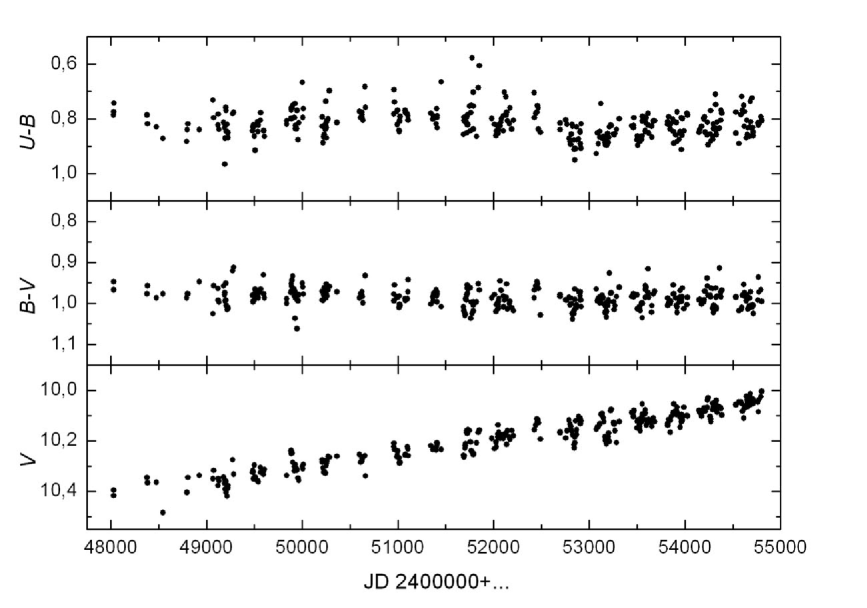
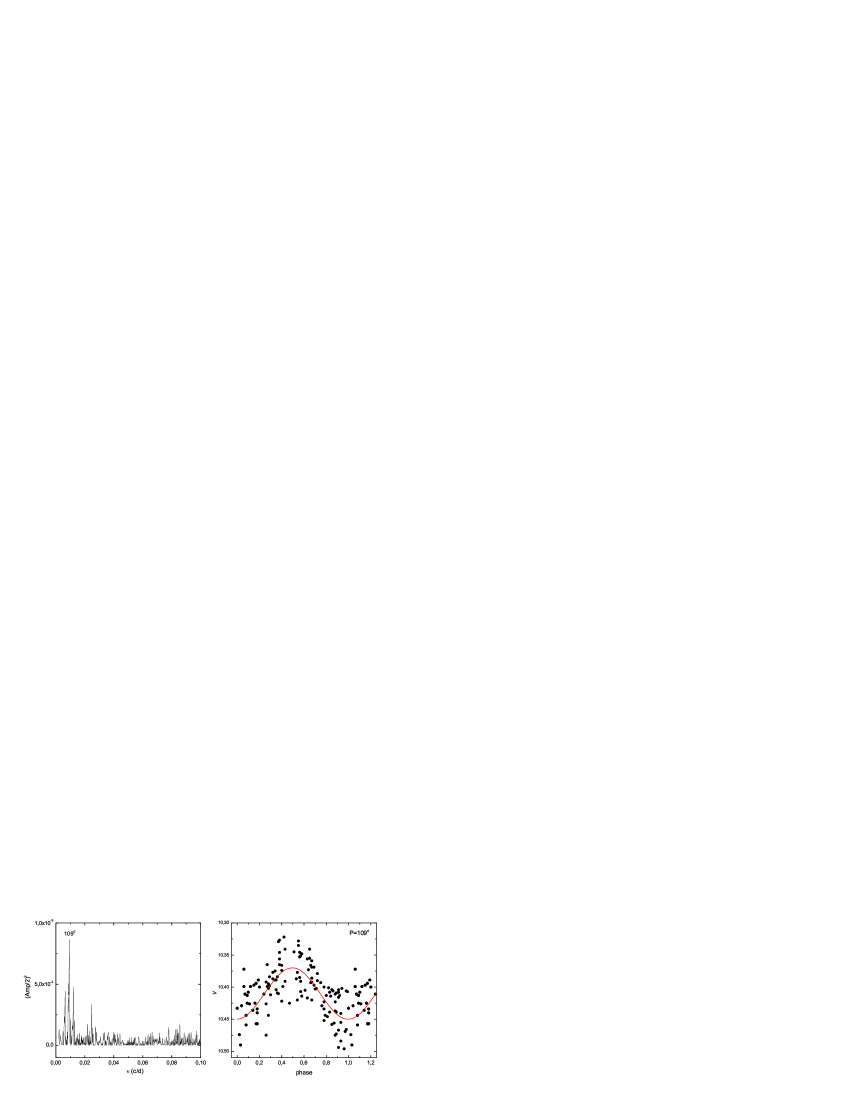
Figure 2 shows the periodogram and phase curve for the data in the -band. The frequency corresponding to the main period of 109 days and also the annually conjugated frequencies are clearly distinguished. The full amplitude of the wave with the period of 109 days is 0.06 mag. Though the double amplitude is always less than 0.15 mag, the scatter of measurements at the same phase reaches 0.1 mag. This scatter results from the fact the shape of the light curve changes from one cycle to another; besides quasiperiodic brightness oscillations caused by pulsations, there is also instability due to variable stellar wind which contributes significantly into the light variations. The variable emission line H (Tamura and Takeuti 1991, Klochkova 1995) gives also the evidence for the continuing mass loss through the stellar wind.
In general, the colour variations follow the light oscillations. During the epochs when the regular periodicity was prominent, for example in 2004, the star became bluer while becoming brighter, just as a typical Cepheid does. In other years, when the instability related to the varying power of stellar wind dominated in the total variability, correlation between the colours and the brightness is very weak.
These low-amplitude quasiperiodic light variations of V887 Her are observed against the systematic long-term brightness increase. For the 19 years of our observations, the mean brightness level has risen by 0.32 mag in the -band, by 0.35 mag in the -band, and by 0.37 mag in the -band, the mean colour being almost constant, and the colour oscillating within 0.1 mag. Our conclusion about the systematic brightness increase of V887 Her is supported by the NIR-photometry data. According to unpublished measurements by Yudin (1999), between 1992 and 1999 the -band brightness of V887 Her rose by 0.02 mag per year – with the same rate as in the -band.
We can hardly explain simultaneously the constant colours and rising total flux of V887 Her by changing parameters of the very star, so we choose to suggest that the rising brightness of the star is caused by changing the properties of the surrounding envelope.
The dust-gaseous nebulosity surrounding V887 Her has a complex structure: it looks like a disk or torus with bipolar jets (Ueta et al. 2000). The dusty disk provides a significant reddening of the star. By assuming spectral classification of F3I for V887 Her, we estimate the colour excess as . The contribution of the interstellar extinction into does not exceed , according to the maps by Schlegel et al. (1998). So the dominant part of the reddening, more than , is due to the circumstellar dust envelope. For the 19 years of observations the mean colours of V887 Her has not become bluer so we cannot explain the long-term brightening of the star by the growing transparency of the envelope. We can however suggest that there are some stratification of dust grains by sizes. Then the brightening without blueing may be explained by dissipation of the part of the envelope dominated by the large grains providing almost non-selective extinction law, .
Some hints on the evolution of the dust envelope come from the results of polarimetric observations. Trammell et al. (1994) found a significant intrinsic polarization in V887 Her, %. The comparison of the measurements by Trammell et al.(1994) in October 1991 and by Biging et al. (2006) in May 2000 shows that while the polarization degree changed insignificantly, by only 0.8%, the orientation of the polarizarion plane had turned strongly, from =131∘ to =16∘ (Bieging et al. 2006). We feel that further photometric, spectral and polarimetric observations are needed for V887 Her to clarify the origin of the long-term light variations.
4 IRAS =V1648 Aql
4.1 The known properties
The bright IR-source IRAS had been classified as a protoplanetary object by Van der Veen et al. (1989) from the properties of the star in the far-IR range, 12–100 m. Those authors were also first who observed the star in the optical and NIR spectral range and obtained the spectral energy distribution over the wide spectral range of 0.44–100 m. The shape of the spectrum and the location of the star at the two-colour diagram (, ) implied a considerable NIR excess. The conclusion was that the star is surrounded not only by a cold dust envelope formed during the AGB stage but also by warm dust which was ejected after the leaving asymptotic-giant branch. Van der Veen et al. estimate the rate of the mass loss as per year.
The full spectral analysis in the NIR and optical range has been made by Pereira et al. (2004). They have obtained the atmospheric parameters of the star, K and , as well as the chemical abundances. The star is rather metal-poor, [Fe/H], and the CNO-elements and also the elements of the –process are underabundant. Pereira et al. (2004) have fitted the spectral energy distribution of IRAS by three components: a stellar photosphere, a cold-dust spherically symmetric envelope (), and by a hot-dust disk with the temperature of 1000 K.
The presence of the dust disk is often thought to be a signature of the binarity. However up to now no traces of the second star have been revealed, either in the optical spectrum nor in the 2.4–5 m spectrum which has been obtained by the space telescope ISO equipped with the spectrograph SWS (Pereyra et al. 2004).
Suárez et al. (2006) have determined a spectral class of F5I in the spectral range of 3800–9300 Å by using a low-resolution spectrum. Gledhill (2005) have obtained direct and polarized images of IRAS in the -band. A nebulosity of in diameter is found which disperses the light of the star. The polarization degree of the star light is extremely low, %. Gledhill (2005) has made a preliminary conclusion about the bipolar geometry of the nebulosity.
4.2 Our -observations
The starting point of the -observations of IRAS is June 16, 1987: Van der Veen et al. (1989) have obtained and .
We began to observe IRAS in May 1990, and to the fall of 2008 had obtained more than 240 estimates of the star brightness in the -bands. The comparison star was Tyc 483-1122-1, which had , , and according to our data.
Just the first observations in 1990–1992 had revealed variability of the light of IRAS (Arkhipova et al. 1993), which was confirmed by the following observations (Arkhipova et al. 2000), and the star was included into the General Catalogue of Variable Stars as V1648 Aql.
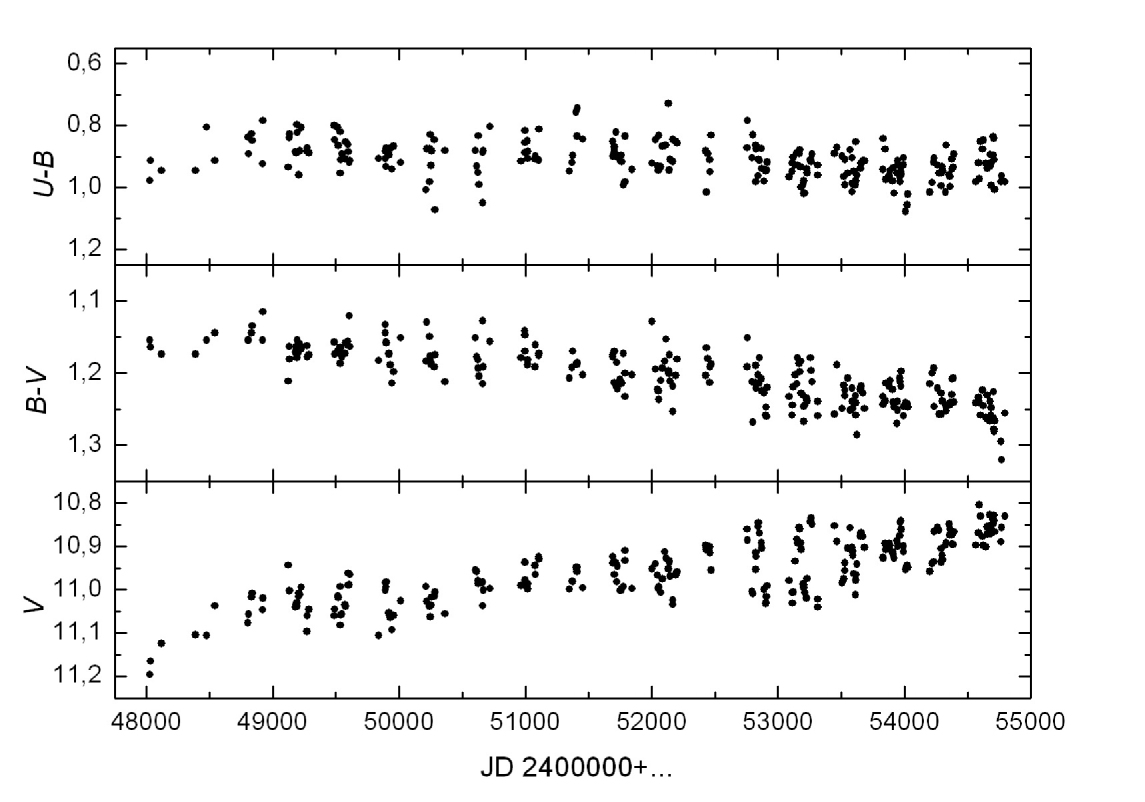
Fig. 3 presents time variations of the -brightness and of the colours and between 1990 and 2008. The star V1648 Aql demonstrates sine-like variations of the light with varying amplitude; in particular, the -band light curve reveals a clear amplitude modulation. The maximum amplitudes are in , in , and in . In course of the pulsations a correlation between the -brightness and the colour is observed: while the brightness increases, the star becomes bluer.
We searched for periodic oscillations over our -data of 2000–2008. Figure 4a presents the periodogram for the -data and the phase curve convolved with the period of . The periodogram is dominated by the peaks corresponding to and to its annually conjugated periods and . We have subtracted the wave with the period of , and in the residual light variations we have found periods of and . The phase curve for the more significant period of two, , and the periodogram for the residual light variations are presented in Fig. 4b. Analysis of the data in the and -bands has given the same values for the periods. The frequency ratio between the 98-days wave and the 102-days wave is 1.04. We conclude that both periods are real ones, and the light variations of V 1648 Aql at two close frequencies result in the amplitude modulation which is the most prominent in the - and -bands.
Interestingly, our observations of 1990-1999 implied the period of (Arkhipova et al. 2000), and Hrivnak & Lu (2000) from their observations of 1994–1995 have found . Meantime the analysis of the ASAS data for 2003–2004 which we have undertaken reveals a period of . We cannot say yet if the main period grows with time and what is the reason of simultaneous oscillations at two close frequencies.
Besides the quasiperiodic light oscillations, V1648 Aql experiences systematic increase of the annually averaged brightness and the reddening in : for the 19 years the star becomes brighter by and redder by ; the colour demonstrates only a weak tendency to rise. We have estimated the colour excess for V1648 Aql as , by assuming the spectral type of F3–F5I with the normal colour of . The maximum interstellar colour excess in this direction according to the maps by Schlegel et al. (1998) is . So a significant part of the colour excess, , is due to the circumstellar dust envelope.
When a star has a dusty disk around it, its systematic reddening may be caused either by changing its own properties or by changing the properties of the surrounding dust.
If the trends of the brightness and colour of V1648 Aql are due to temperature effect during the evolution of the star along the horizontal track at the H-R diagram, then the reddening which we observe together with the brightening of the star in the -band taking into account its spectral type of F3-F5I must signify the temperature decrease. According to the theoretical calculations by Blöcker (1995), a duration of the post-AGB stage may be 102–104 years, depending on the initial mass of a star and on the history of its mass loss. The post-AGB evolution of the most massive stars can be observationally traced over the man-life time intervals, during a few dozen years. According to the star evolution theory, photometric changes due to the evolution of a F-type AGB-supergiant must be blueing and brightness decrease; meanwhile we observe the -band brightening and the reddening of V1648 Aql which means that the star temperature decreases, and the star moves to the right at the H-R diagram. Reverse evolutionary tracks at the post-AGB stage are not excluded in the evolution theory but they may take place only for the stars at the latest stage of helium flash before becoming a planetary nebula central star. The only known stars at this evolutionary stage in our Galaxy are FG Sge, V605 Aql, and V4334 Sgr.

To check the hypothesis of possible eye-traced evolution of V1648 Aql under a constant bolometric luminosity toward the H-R diagram area of cold stars we have estimated the temperature-induced flux change corresponding to the normal-colour change of V1648 Aql by for 15 years. The bolometric-correction difference for a F5I-type star appears to be corresponding to the , that results in -band brightening by – significantly less than the observed -band brightening by .
We think that the brightnening of V1648 Aql accompanying by the reddening may be caused by an episode of intense mass loss which has increased an opacity of the stellar atmosphere; due to this we see now the higher and colder levels of the star. We know another star with the similar photometric behaviour, HD 179821 (Arkhipova et al. 2009), but the evolutionary status of HD 179821 is even more uncertain than that of V1638 Aql: equally well it may be a post-AGB star or a massive hypergiant. But it is evident that the only 19 years of photometric observations of V1648 Aql are insufficient to make certain conclusions about the nature of its long-term light and colour trends.
5 IRAS Sgr
5.1 The known properties
The bright (according to BD, ) star BD-17∘ 5779=HD 187885, with the spectral class of F8 (HD) and high latitude of , was detected by IRAS as having FIR-light excess (Parthasarathy and Pottasch 1986). In the IRAS catalogue the star is listed as IRAS . By using the IRAS data, Likkel et al. (1987) identified this star as a protoplanetary object, together with some other supergiants at high galactic latitudes. Pottasch and Parthasarathy (1988) had explained the IR-excess by the radiation of cold dust with the temperature of 100 K.
Later Van Winckel et al. (1996) analysed a high-resolution spectrum of HD 187885, determined its chemical abundance and calculated an atmosphere model. The low metallicity ([Fe/H]), the CNO-overabundance, and the overabundance of the s-process elements give evidence for the post-AGB evolutionary status of the star. In this paper Van Winckel et al. considered two atmosphere models for the star, one with K, and another with K, ; later Van Winckel & Reyniers (2000) chose the high-temperature model of two.
A prominent peculiarity of HD 187885 is inverse P Cyg-like profile of its spectral line H detected by Tamura & Takeuti (1991).
Spectral classification of HD 187885 is somewhat uncertain and depends on the method and criteria used. The HD catalogue gave the spectral type of F8 for the star, however all the later classifications were much earlier: F2-3I by Parthasarathy et al. (1988), F2-5I by Volk and Kwok (1989), F0Ie by Suárez et al. (2006). The estimate based on the Geneve photometric indices gives even earlier spectral classification: A2-3I (Van Winckel et al. 1996).
There are some indications of the binary status of the star. Likkel et al. (1987) refering to unpublished data by Sanduleak classified HD 187885 spectral class as a composite . Parthasarathy et al. (1988) noted that while the spectrum in the optical range, 3500–7400 Å, corresponds to the spectral class of F2-3, the UV-flux detected by the IUE indicates the presence of a hotter source, with the temperature of 8500 K.
5.2 Our -observations
The starting point of the -observations of IRAS is September 4, 1987: Hrivnak et al. (1989) have published , , and .
We are monitoring HD 187885 in the -bands starting from 1993. As a comparison star, we used BD–17∘5778 for which we had undertaken calibration procedure with the Johnson’s standard stars; the results of this calibration are: , , . For the 16 years we have obtained more than 220 individual photometric estimates. We have revealed the star variability by analysing the data of 1993-1999 (Arkhipova et al. 2000), and HD 187885 has been included into the General Catalogue of Variable Stars as V5112 Sgr (Kazarovets et al. 2003). Our observations after 1999 have allowed us to study in detail the character of low-amplitude quasiperiodic variability of the star and also to confirm long-term trends of its brightness.


Fig. 5 presents the light curve and colours variations traced by the star observations in 1993–2008. The variability within a single year can be characterized as low-amplitude () quasiperiodic oscillations with varying shape of the light curve. We searched for a variability period over every observational year separately, starting from 2001. To increase the statistics, we have also involved the data of the ASAS survey for 2001–2004. Table 2 presents a list of the periods obtained from the observational data of 2001-2008. Two periods of the V5112 Sgr light variations are visible in different epochs: and days. The ratio of these two periods is close to 0.8. Figure 6 shows the phase curves from the ASAS data of 2001–2004.
| Years | , d (ASAS) | , d (our |
|---|---|---|
| data) | ||
| 2001 | 47.6, 39.0 | 47.0 |
| 2002 | 46.1 | - |
| 2003 | 39.1 | 38.6 |
| 2004 | 39.1 | - |
| 2005 | - | 38.5 |
| 2006-2008 | - | 38.0 |
The light oscillations of V5112 Sgr demonstrate a strong correlation between the brightness and the colour: the star becomes bluer while it brightens.
We have estimated the colour excess of V5112 Sgr as under the assumption that the spectral class of the star is F0I. The maximum interstellar extinction in this direction is not more than according to the maps by Schlegel et al. (1998). It means that about the half of all reddening is provided by the circumstellar dust envelope.
The secular light trend of V5112 Sgr can be characterized as follows. Between 1993 and 1997 the mean brightness of the star stayed constant, in 1998 a decrease started, and in 1999 the star had reached the minimum which persisted over the whole annual visibility season. The depth of the minimum was in the -band. In 2000 the star had returned to the level of 1998, and starting from this year the brightness of the star increased monotonically. The brightening was accompanied by the blueing: the star had the reddest colour during the minimum of 1999.
Since there are some suspicions about the binarity of V5112 Sgr, we can suggest that the light minimum of 1999 has been in fact an occultation. To check this hypothesis, we need more time because during the 16 years of observations there are only one such event which may be treated as the occultation.
6 Discussion
What may be the reasons and manifestations of the variability of the stars which we study, taking into account their evolutionary status?
Theoretical calculations predict pulsational instability of the evolved stars of intermediate masses over a wide range of temperature (Gautschi 1993, Zalewski 1993). The F-supergiants with the IR-excesses of our sample demonstrate low-amplitude () quasiperiodic variability with a strong correlation between the brightness and the colour: while brightening, the stars become bluer. The stars V887 Her and V1648 Aql have similar effective temperatures, 6600 K and 6800 K correspondingly, and consequently close periods of the light oscillations, 109 days and 102 days, which is a signature of practically the same luminosities of these stars. The star V5112 Sgr has a higher effective temperature, K, so the timescale of its light oscillations is much shorter – 39 and 47 days, and the periodic component is less prominent.
After major mass loss events at the previous evolutionary stages, at the post-AGB stage the stars continue to lose their mass via unstable stellar wind. The manifestations of this stellar wind are the presence of the variable emission line H in the spectra of the most post-AGB supergiants and photometric peculiar behaviour – chaotic low-amplitude light variability superposing the regular pulsations. Among the stars considered in this paper, V887 Her suffers the variability caused by the unstable stellar wind most of all.
Post-AGB supergiants are surrounded by dust envelopes which may contribute significantly into their total light reddening. All three stars in our work demonstrate the dominant contribution of the circumstellar envelopes into their reddening. The long-term expansion of the envelopes and the subsequent drop of their optical depth result in the brightening of the stars. The long-term linear light trend of V887 Her under the constant colours can be explained by the optical depth drop in the part of the circumstellar dust envelope, just that part which consists of rather large grains providing practically non-selective extinction law. Therefore we have to suggest that the dust envelope of V887 Her contains a mixture of grains of various sizes, and the larger grains destroy with time.
One of our stars, V1648 Agl, has shown systematic changes of the light, colours, and perhaps the pulsational periods for the 19 years of monitoring. Our attempt to explain the long-term variability of the star by the temperature decrease due to star evolution along the constant-luminosity part of the post-AGB evolutionary track at the H-R diagram has been unsuccessful. We have concluded that the most probable cause of this variability may be intense mass loss which increases opacity of the star atmosphere and move the photosphere up to the higher and colder level to produce the redder and fainter continuum.
We know that a significant part of candidates to protoplanetary objects are binary stars. For example, in the catalogue by Szczerba et al. (2007) of the most probable post-AGB objects the stars mentioned as binaries contribute 14% of all stars (45 of 326). One of these suspected binaries is V5112 Sgr studied by us in this work; it has experienced an annual drop of the light which may be interpreted as an occultation in the binary system.
7 Conclusions
We can summarize our prolonged photometric observations of three candidates to protoplanetary nebulae as follows.
The F3-supergiant IRAS Her demonstrates quasiperiodic oscillations with the amplitudes up to , , . The pulsational light oscillations with the period of days are superposed with the chaotic light variations due to the stellar wind variability. The long-term linear trend of the light – the brightening of the star with the rate of per year under the constant mean colours – may be a result of the increasing transparency (or dissolution) of the dust envelope consisting of rather large grains providing non-selective extinction.
The 2000–2008 light curve of the F5-supergiant IRAS Aql which has significant NIR and FIR light excesses can be fitted by a sum of two waves with the periods of and and full amplitudes of and , respectively. The oscillations at two close frequencies results in the amplitude modulation. Besides these short-term variations, for the 19 years of observations V1648 Aql becomes persistently brighter by in the -band, the colour has increased by , and the colour has also shown a weak tendency to rise.
The hottest of our stars, IRAS Sgr, has demonstrated the shortest period of the pulsations and the unusual trend of annually averaged brightness. The star experiences semiregular light variations with the amplitudes up to in the -band and with the cycle durations of 39 and 47 days. The ratio of two quasiperiods is 0.8. During the 16 years we traced also long-term variations of the light and colours of the star. In 1999 the star has reached a minimum of its brightness. If it is an occultation in a binary system, the orbital period has to exceed 6000 days.
Acknowledgements
We thank V.P. Goranskij and N.N. Samus for their interest to our work and useful comments.
The work is partly supported by the grant of the President of Russian Federation for the state support of leading scientific schools NSch-433.2008.2.102.
References
Arkhipova V. P. , Ikonnikova N. P., and Noskova R. I., Pis ma Astron. Zh. 19, 436 (1993) [Astron. Lett. 19, 169 (1993)].
Arkhipova V. P., Ikonnikova N. P., Noskova R. I. and Sokol G.V., Pis ma Astron. Zh. 26, 705 (2000) [Astron. Lett. 26, 609 (2000)].
Arkhipova V. P., Esipov V. F., Ikonnikova N. P., Komissarova G. V., Tatarnikov A. M., and Yudin B. F., Pis ma Astron. Zh. (2009) 35, 846 [Astron. Lett. 35, 764 (2009)].
Bieging J.H., Schmidt G.D., Smith P.S. and Oppenheimer B.D. Astrophys. J., 639, 1053 (2006).
Blöcker T., Astron. Astrophys., 299, 755 (1995).
Gautschy A., Monthly Notice Royal Astron. S. 265, 340 (1993).
Gledhill T.M., Mon. Not. R. Astron. Soc., 356, 883 (2005).
Hrivnak B.J., Kwok S., Volk K.M., Astrophys. J., 331, 832 (1988).
Hrivnak B.J., Kwok S., Volk K.M., Astrophys. J., 346, 265 (1989).
Hrivnak B.J. & LU W.X. , 177th Symposium of the IAU, held in Antalya, Turkey, 27-31 May, 1996. Ed. by Robert F. Wing, ”The carbon star phenomenon”, 177, 293 (2000).
Kazarovets E.V., Samus N.N., Goranskij V.P., IBVS, No 3840, 1 (1993).
Kazarovets E.V., Kireeva N.N., Samus N.N. and Durlevich O.V., IBVS, No 5422, 1 (2003).
Klochkova V.G., Mon. Not. R. Astron. Soc., 272, 710 (1995).
Likkel L., Omont A., Morris M. and Forveille T., Astron. Astrophys., 173, L11-L14 (1987).
Parthasarathy M. & Pottasch S.R., Astron. Astrophys., 154, L16 (1986).
Parthasarathy M., Pottasch S.R. and Wamsteker W., Astron. Astrophys., 203, 117 (1988).
Pereira C.B., Lorenz-Martins S. and Machado M., Astron. Astrophys., 422, 637 (2004).
Pojmanski G., Acta Astronomica, 52, 397 (2002)
Pottasch S.R. & Parthasarathy M., Astron. Astrophys., 192, 182 (1988).
Schlegel D. J., Finkbeiner D. P., Davis M., Astrophys. J., 500, 525 (1998).
Suárez O., García-Lario P., Manchado A., Manteiga M., Ulla A., S. R. Pottasch, Astron. and Astrophys. 458, 173 (2006).
Szczerba R., Siodmiak N., Stasinska G. and Borkowski J., Astron. Astrophys., 469, 799 (2007).
Tamura S. & Takeuti M., IBVS, No 3561 (1991).
Trammell S.R. , Dinerstein H.L. and Goodrich R.W., Astron. J., 108, 984 (1994).
Ueta T., Meixner M. and Bobrowsky M., Astrophys. J., 528, 861 (2000).
Van der Veen W.E.C.J., Habing H.J. and Geballe T.R., Astron. Astrophys., 226, 108 (1989).
Volk K.M. & Kwok S., Astrophys. J., 342, 345 (1989).
Van Winckel H., Waelkens C. and Waters L.B.F.M., Astron. Astrophys., 306, L37 (1996).
Van Winckel H. & Reyniers M., Astron. Astrophys., 354, 135 (2000).
Yudin B.F., private communication (1999).
Zalewski J., Acta Astronomica, 43, 431 (1993).