Competing Phases, Strong Electron-Phonon Interaction and Superconductivity in Elemental Calcium under High Pressure
Abstract
The observed “simple cubic” (sc) phase of elemental Ca at room temperature in the 32-109 GPa range is, from linear response calculations, dynamically unstable. By comparing first principle calculations of the enthalpy for five sc-related (non-close-packed) structures, we find that all five structures compete energetically at room temperature in the 40-90 GPa range, and three do so in the 100-130 GPa range. Some competing structures below 90 GPa are dynamically stable, i.e., no imaginary frequency, suggesting that these sc-derived short-range-order local structures exist locally and can account for the observed (average) “sc” diffraction pattern. In the dynamically stable phases below 90 GPa, some low frequency phonon modes are present, contributing to strong electron-phonon (EP) coupling as well as arising from the strong coupling. Linear response calculations for two of the structures over 120 GPa lead to critical temperatures in the 20-25 K range as is observed, and do so without unusually soft modes.
I Introduction
One of the most unanticipated developments in superconducting critical temperatures (Tc) in the past few years has been achievement of much higher values of Tc in elemental superconductors by the application of high pressure, and that these impressive superconducting states evolve from simple metals (not transition metals) that are non-superconducting at ambient pressure. The first breakthrough arose in Li, with Tc approachingLi-exp1 ; Li-exp2 20 K, followed by yttriumY-exp ; Sc-exp at megabar pressure also superconducting up to 20 K and showing no sign of leveling off. Both of these metals have electron-phonon (EP) coupled pairing, according to several linear response calculationsLi-th1 ; Li-th2 ; Y-th1 ; Y-th2 of the phonon spectrum, electron-phonon coupling (EPC) strength, and application of Eliashberg theory. These impressive superconductors have been surpassed by Ca, with Tc as high as 25 K reportedCa-exp near 160 GPa. Perhaps more unusual is the report, from room temperature x-ray diffraction (XRD), of a simple cubic (hence far from close-packed) structure over a volume reduction of 4530% (32-109 GPa). Whether these two unique phenomena are connected, and in what way, raises fundamental new issues in an area long thought to be well understood.
Face-centered cubic (fcc, Ca-I) at ambient pressure, calcium transforms at room temperature to body-centered cubic (bcc, Ca-II) atolijnyk 20 GPa, is identified as simple cubic (sc, Ca-III) in the very wide 32-109 GPa range as mentioned above, and shows additional phases (Ca-IV, Ca-V) at even higher pressures. A sc structure for an element is rare, occurring at ambient pressure only in polonium and under pressure only in a handful of elemental metals.Po-exp1 ; Po-exp2 This identification of a sc structure for Ca is particularly problematic, since it has been shown by linear response calculations of the phonon spectrum by a few groupsref1 ; ref2 ; bonev that (at least at zero temperature) sc Ca is highly unstable dynamically at all volumes (pressures) in the region of interest. Since these calculations are reliable for such metals, there are basic questions about the “sc” structure itself.
II Comparison to related metals
Strontium, which is isovalent with Ca, like Ca superconducts under pressure and undergoes a series of structural transitions from close-packed structure to non-close-packed structure at high pressure. Sr transforms from a fcc phase to a bcc phase at 3.5 GPa and then transforms to Sr-III at 24 GPa, to Sr-IV at 35 GPa and to Sr-V at 46 GPa.Mizobata The Sr-III structure was first believed to be a distorted sc and later found to be an orthorhombic structure.Phusittrakool However, later experiments have found that there are two phases coexisting in the Sr-III phase, namely, a tetragonal phase with a distorted -tin structure and an unidentified additional phase.Phusittrakool The Sr-IV structure is very complex and was shown recently to be a monoclinic structure with the space group and 12 atoms per unit cell.Bovornratanaraks The structure is more complex in Sr-V, and was identified as an incommensurate structure similar to that of Ba-IV.McMahon Sr begins to superconduct at 20 GPa, its Tc is 8 K at 58 GPa, and is believed to be higher beyond 58 GPa.Mizobata
Scandium, with one more () electron than Ca, undergoes phase transitions from hcp to Sc-II at 20 GPa and to a Sc-III phase at 107 GPa.Zhao ; Debessai Although Sc is conventionally grouped together with Y and the lanthanide metals as the rare-earth metals, due to their similarities in their outer electron configurations, its structural transition sequence is rather different from the common sequence of lanthanide metals and Y, which follow the pattern hcp Sm-type dhcp fcc distorted fcc. The Sc-II structure is complex, and was recently found to be best fitted to a pseudo bcc structure with 24 atoms in the unit cell.Zhao The structure of Sc-III is not identified to date. Sc begins to superconduct at 20 GPa. Its Tc increases monotonically to 19.6 K with pressure to 107 GPa. Its Tc drops dramatically to 8 K at the phase transition from Sc-II to Sc-III around 107 GPa.Debessai
Considering the close relation of Sc and Sr to Ca in the periodic table and the similar superconducting properties under pressure, it could be expected that Ca under pressure should have more complex structures, rather than the observed sc structure. In fact, Olijnyk and Holzapfelolijnyk observed that their Ca sample transformed from sc to an unidentified complex structure at 42 GPa.
So far the higher pressure phases Ca-IV and Ca-V have attracted the most attention, and considerable progress has been made in identifying these phases through a combination of experimentalCa-exp ; Ca-exp2 ; fuji and theoreticalyao ; Ca-MD-Cmca ; Arapan work. However, satisfactory agreement between experimental and theoretical work is still lacking. Ca-IV is identified as a Pnma space group by Yao et al.yao but P43212 symmetry by Ishikawa et al.Ca-MD-Cmca and Fujihisa et al.fuji Ca-V seems clearly to have a Cmca space groupCa-MD-Cmca ; fuji ; yao , however, the calculated enthalpy in the Pnma structure is much lower than in other structures (including Cmca structure) at pressures over 140 GPa. Also in the experimental work of Fujihisa et al.fuji , the fitting of their XRD patterns to the anticipated P43212 and Cmca space groups were not satisfactory and other possibilities still exist. In the recent work of Arapan, Mao, and AhujaArapan , an incommensurate structure similar to Sr-V and Ba-IV structures was proposed for Ca-V phase. Therefore the nature of the Ca-IV and Ca-V phases is still not fully settled.
While helping to forge an understanding the structure of Ca-IV and Ca-V and its impressive superconducting Tc is one goal of the present work, our focus has been to understand the enigmatic “sc” Ca-III phase where relatively high Tc emerges and increases with pressure, a phase that XRD at room temperature (TR) identifies as primitive simple cubic.Ca-exp2 In this pressure range sc Ca becomes favored over the more closely packed fcc and bcc structures, but the dynamical (in)stability was not calculated by Ahuja et al.ahuja We report here first principles calculations of the enthalpy of five crystal structures (with space groups sc, I3m, P43212, Cmca, and Pnma), and linear response calculations of EPC, that helps to clarify both the structural and superconducting questions.
III Theoretical Approach
III.1 Competing Structures
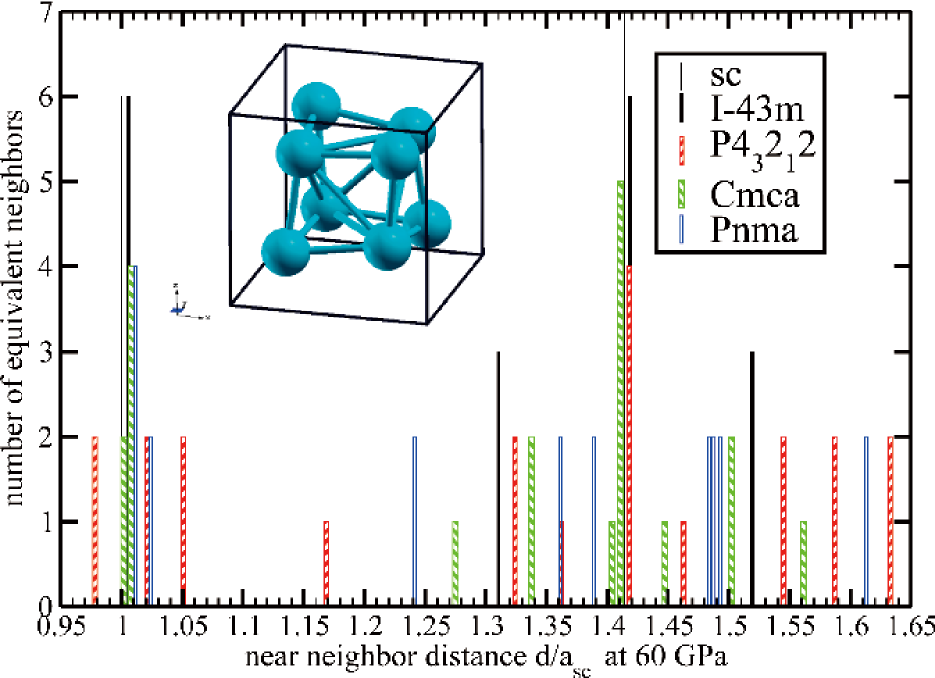
The most unstable modes of sc Ca are transverse [001]-polarized zone boundary modes along the (110) directions. A linear combination of the eigenvectors of this mode at different zone boundary points leads to a body-centered four-atom cell in the space group I3m, whose local coordination is shown in the cubic cell in the inset of Fig 1, and has a clear interpretation as a buckled sc lattice. This structure, when relaxed, has no dynamical instabilities.
The I3m structure is just one kind of distortion from the sc structure. There are many kinds of other possible distortions. Actually several other structures including Pnma, Cmca and P43212 were proposed for the high pressure Ca-IV and Ca-V phases.fuji ; yao ; Ca-MD-Cmca ; Arapan Their structural details are listed in Table 1 and their structures are pictured in reference [fuji, ; yao, ; Ca-MD-Cmca, ]. I3m is a body-centered cubic structure, Pnma and Cmca Ca are orthorhombic, and P43212 has a tetragonal symmetry. All are closely related to sc structure. For example, I3m turns to simple cubic if =0.25, and the Cmca structure becomes a sc structure if and .
| SG | No. | WP | AC | |||
|---|---|---|---|---|---|---|
| I3m | 217 | 8c | (, , ) | 0.2 | ||
| 62 | 4c | (, 1/4, ) | 0.3 | 0.6 | ||
| 64 | 8f | (0, , ) | 0.3 | 0.2 | ||
| 96 | 8b | (, , ) | 0 | 0.3 | 0.3 |
III.2 Calculational Methods
We have used the full potential local-orbital (FPLO) code,fplo the full-potential linearized augmented plane-wave (FPLAPW) + local orbitals (lo) method as implemented in WIEN2K,wien2k , the Qbox codeqbox and the PWscf code pwscf to do various structural optimizations and electronic structure calculations, and check for consistency among the results. For the enthalpy calculations we used the PWscf code.pwscf Both Qbox and PWscf use norm-conserving pseudopotentials, while the FPLO and WIEN2K codes are all-electron and full potential codes. The linear-response calculations of phonon spectra and electron-phonon spectral function were done using the all-electron, full potential LMTART code.lmtart ; lmtart1
The parameters used in PWscf for the structural optimizations and enthalpy calculations were: wavefunction planewave cutoff energy of 60 Ry, density planewave cutoff energy of 360 Ry, mesh samplings (respectively, number of irreducible points) 24*24*24 (455), 32*32*32 (897), 24*24*8 (455), 24*24*24 (3614), 24*32*32 (6562) for sc, I3m, P43212, Cmca, and Pnma structure, respectively. Increasing the number of points lowers the enthalpy by only 1-2 meV/ Ca almost uniformly for all structures, resulting in negligible change in volume, lattice constants, and internal coordinates. In these calculations, we used a Vanderbilt ultrasoft pseudopotentialUSPP with Perdew-Burke-ErnzerhofPBE (PBE) exchange correlation functional and nonlinear core-correction, which included semicore states as well as states in valence states.
IV The enthalpies
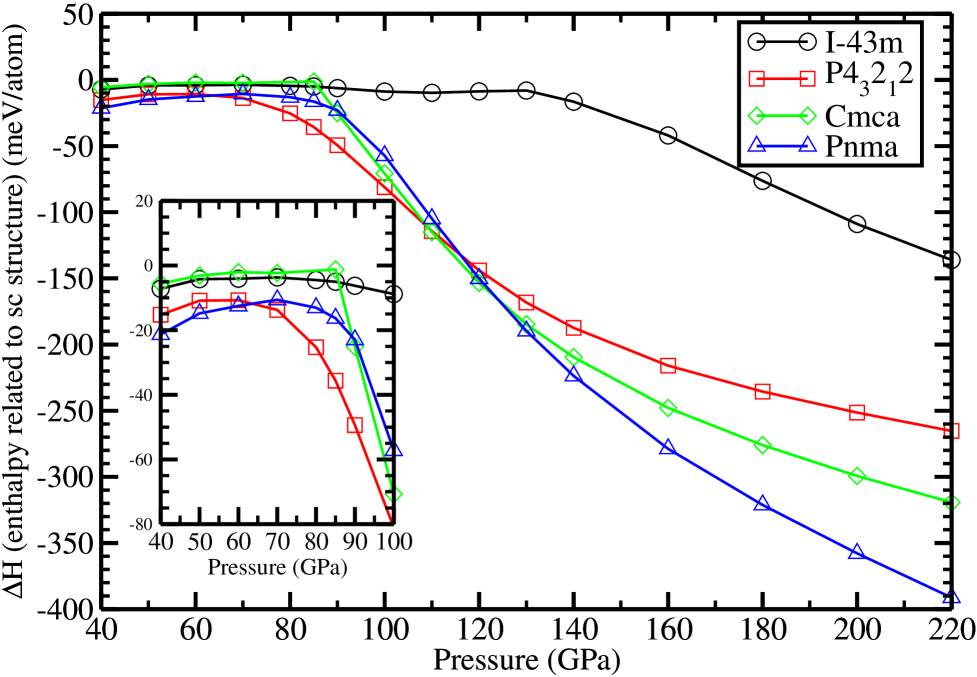
We have calculated enthalpy H(P) curves for each structure in the pressure range 40-220 GPa based on density functional methodsHK ; KS using the PWscf code.pwscf Several energy differences and relaxations were checked with the Qbox,qbox FPLO,fplo and WIEN2Kwien2k codes. In the 40-70 GPa range, all five of the structures we have studied have enthalpies that differ by less than 20 meV/Ca (230 K/Ca), as shown in Fig. 2. In the 80-100 GPa range, the P43212 phase is marginally the more stable phase. Three phases are degenerate, again within 20 meV/Ca, in the 100-130 GPa region and are almost exactly degenerate around 110-115 GPa. Thus at room temperature all five phases, including the sc one, are thermodynamically accessible up to 80-90 GPa, above which the sc and I3m structures become inaccessible. The other three phases remain thermally accessible to 130 GPa. Above 140 GPa, the Pnma phase becomes increasingly more stable than the others.
Our results agrees well with the results reported recently by Yao et al.yao and Ishikawa et al.Ca-MD-Cmca in their corresponding pressure range. At low pressure, our result is apparently different from the result by Arapan, Mao, and Ahuja.Arapan In their results, sc Ca has the lowest enthalpy from 40 GPa to 77 GPa, lower than the P43212 and Cmca structures. A possible reason is that the authors might not have taken into account the change in shape and internal coordinates of the Cmca structure in the 70-80 GPa pressure range. In our calculation, b/a=1.0003 and internal coordinates y=0.254, z=0.225 at 70 GPa (and similarly below) change dramatically to b/a=1.0594, y=0.349 and z=0.199 at 80 GPa (and similarly above).
Although equally dense, quasi-degenerate, and related to the sc structure, these structures differ in important ways from the sc structure and each other. In Fig. 1 the distribution of (first and second) neighbor distances , relative to the sc lattice constant , are pictured. The collection of distances cluster around and, more broadly, around . In an ensemble of nanocrystallites of these phases, the radial distribution function in the simplest picture should look like a broadened version of the sc one. For Ca the actual microscopic configuration at room temperature, where fluctuations (spacial and temporal) can occur among these phases (whose enthalpies differ by less than TR per atom), will no doubt be much more complex. However, this simplistic radial distribution plot makes it plausible that the resulting thermal and spatial distribution of Ca atoms will produce an XRD pattern more like simple cubic than any other simple possibility. Teweldeberhan and Bonev have noted the near degeneracy of some of these phases in the 40-80 GPa region, and suggest that the T=0 structure is Pnma in the 45-90 GPa rangebonev , which is consistent with our results if the P43212 structure is not included.
V Stability and lattice dynamics
The structural stability of the (quasi-degenerate) structures we have studied provide insight into behavior of Ca under pressure. Linear response calculations were performed using the LMTART codelmtart ; lmtart1 to evaluate EPC.
60-100 GPa. The I3m and Pnma structures are mostly dynamically stable from 60-100 GPa according to our linear response calculations, but there are very soft zone boundary modes that verge on instability (small imaginary frequencies) at some pressures. The Cmca and P43212 structures are unstable over this entire pressure range; note that their structures are close to the sc structure. However, they are close to stable with very soft phonons at 100 GPa, where they were distorted far enough from the sc structure.
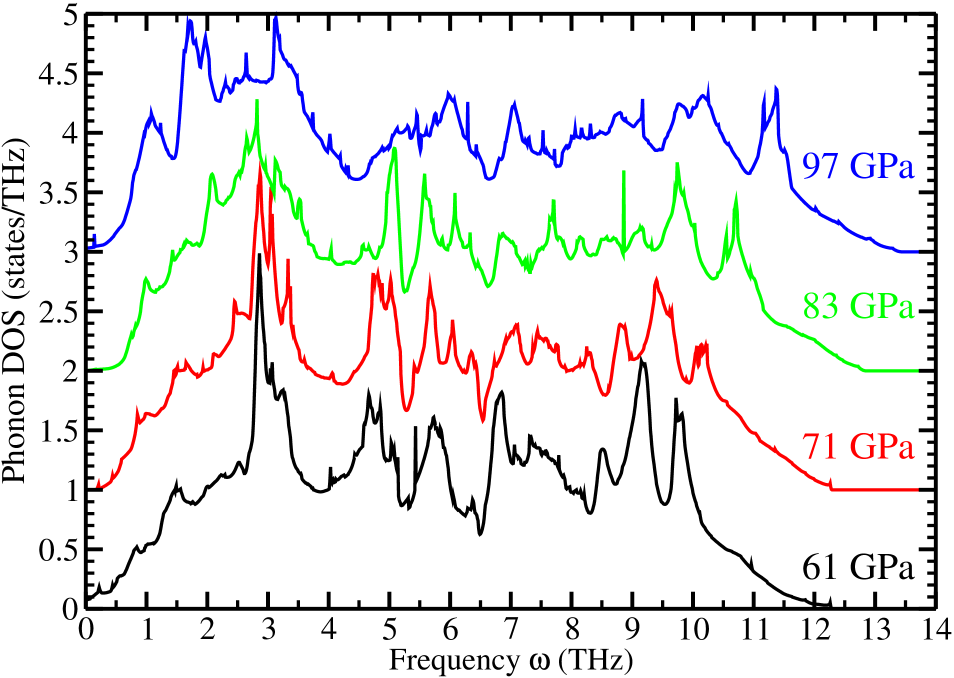
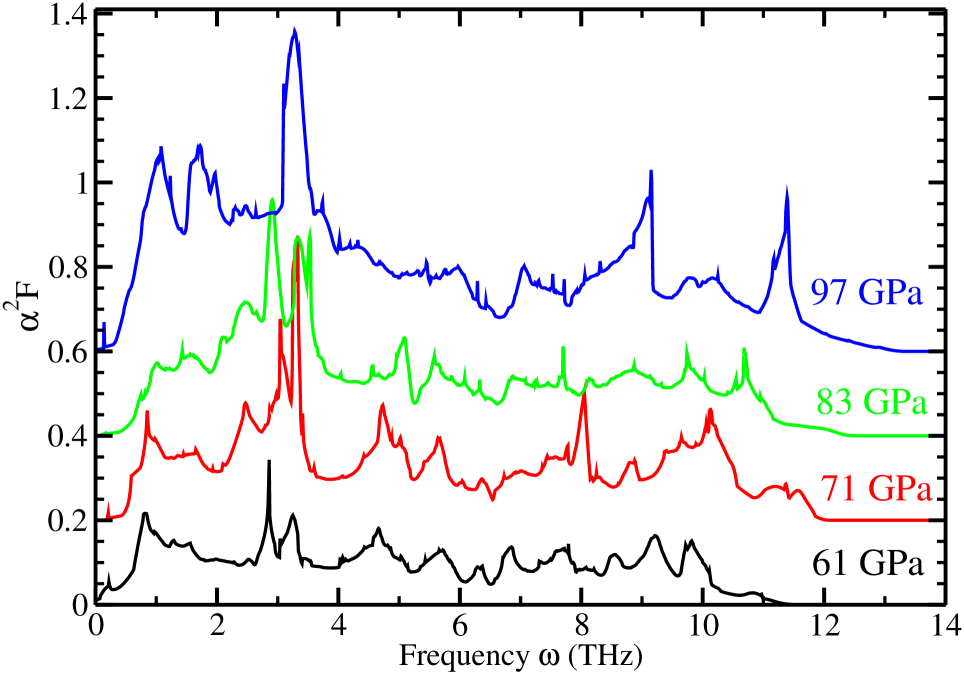
A rather common feature among these structures in this pressure range is softening of modes at the zone boundary, with associated low frequency weight in the spectral function 2() that can be seen in Fig. 3 and Fig. 4. Such low frequency weight contributes strongly to , though the contribution to Tc is better judgedY-th1 by or even . With increase of pressure, the peaks move towards lower frequency, increases, and the structures approach instability. These results are consistent with the changes of structure parameters we obtain in the process of calculating the enthalpies, where all four structures evolve further from the sc structure with increase of pressure.
Above 100 GPa. At the highest pressures studied (by us, and experimentally), the crystal structures deviate more strongly from the sc structure. Of the structures we have considered, the P43212 one becomes favored and also is structurally stable around 110 GPa. This stability is consistent with the observed transition from the sc structure to the Ca-IV structure at room temperature. The dramatic drop in the electrical resistance at around 109 GPa is also consistent with a transition from a locally disordered phase to a crystalline material.Ca-exp
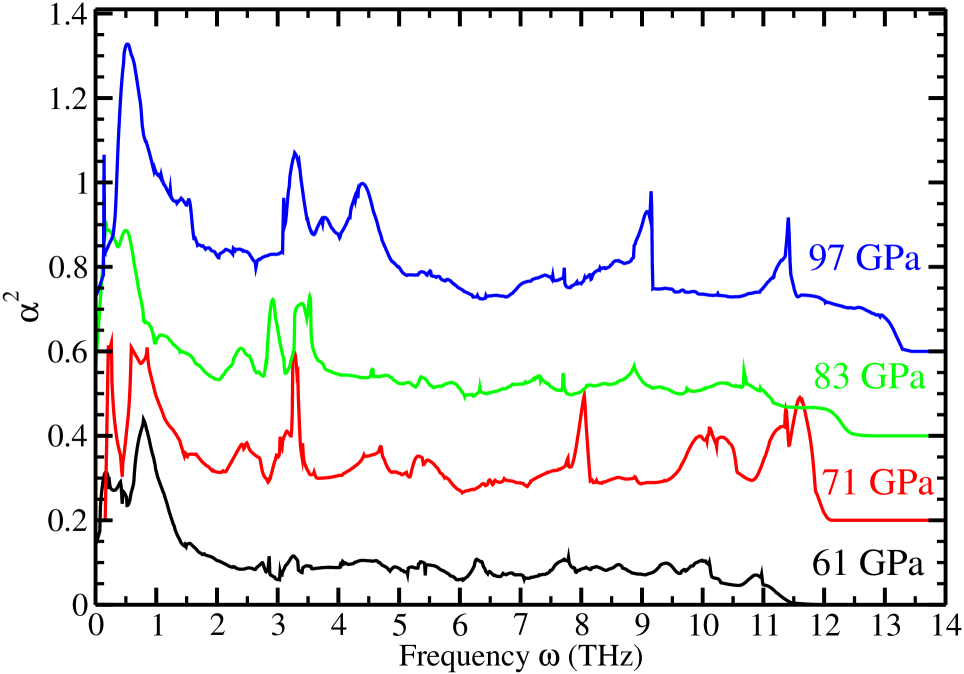
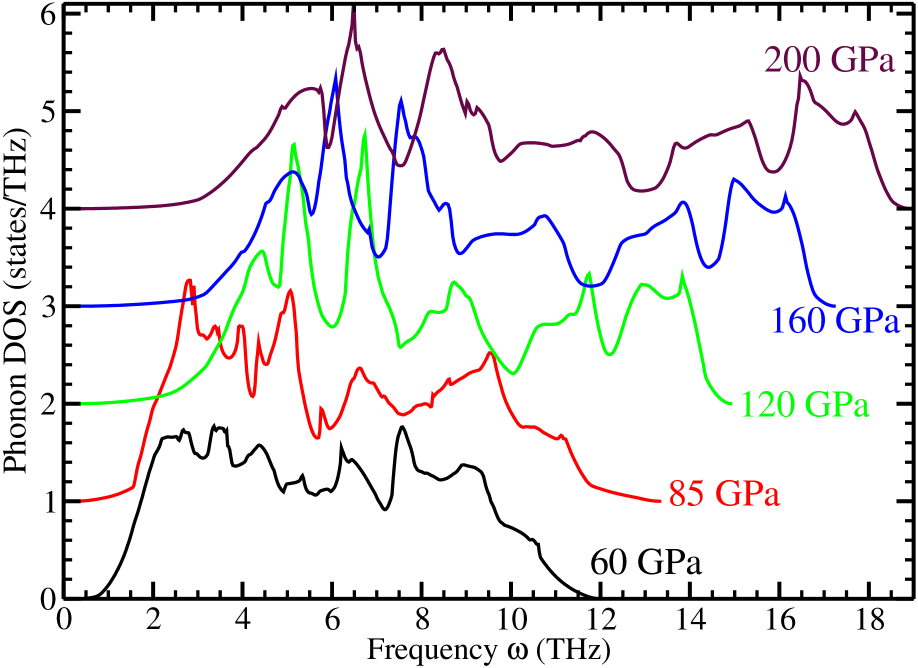
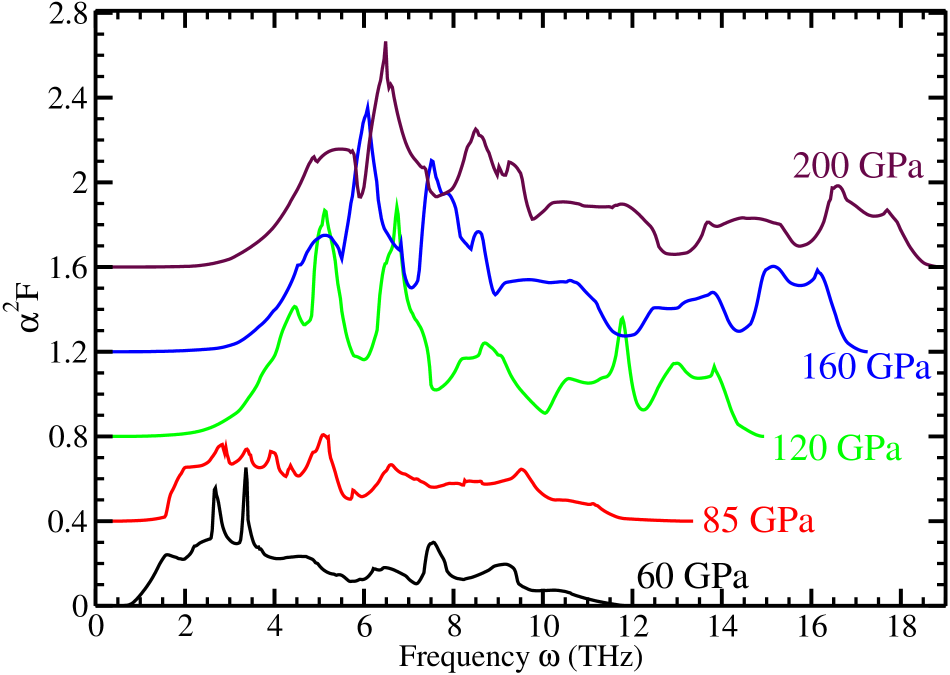
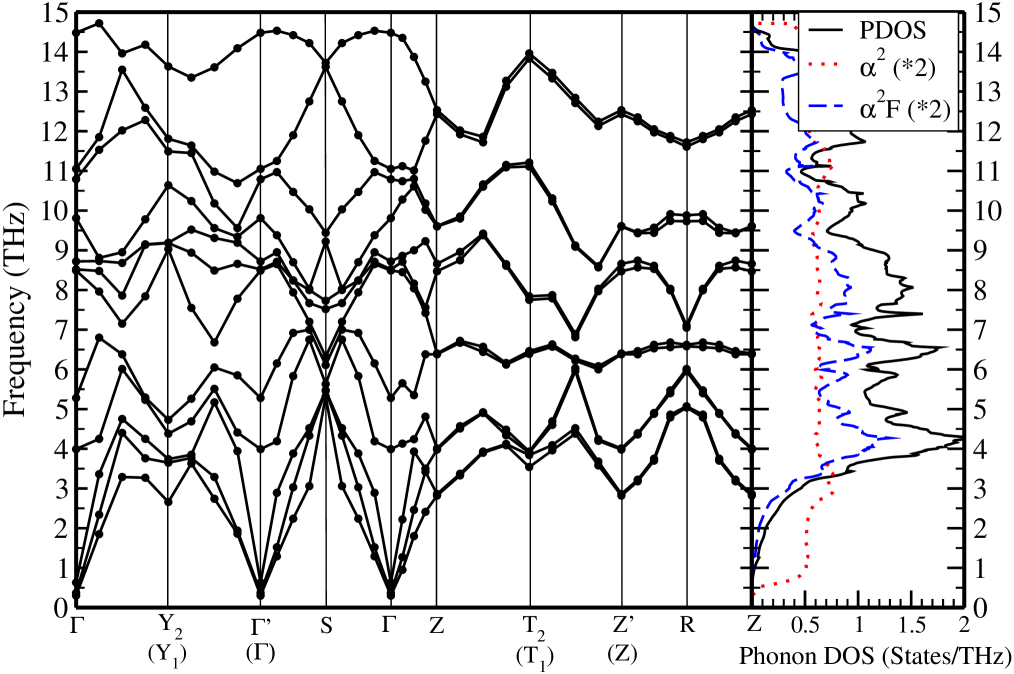
In the pressure range of 110-140 GPa, the P43212, Cmca, and Pnma structures become quasi-degenerate again. Linear response calculations of the Pnma structure at 120 GPa and above, and of the Cmca structure at around 130 GPa indeed show strong coupling with 1.0 in all the cases. Unlike what was found below 100 GPa, there are no longer very low frequency phonons (see Fig. 4 and Fig. 5). The coupling strength is spread over frequency, peaking for mid-range frequency phonons.
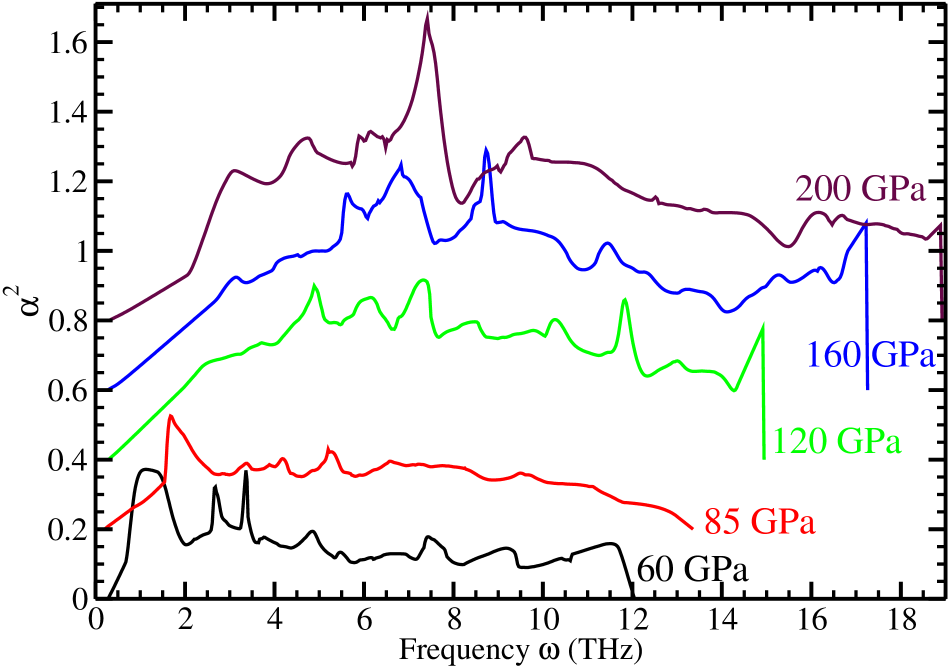
Another interesting feature arises in the 2() curves, which reveal that the coupling matrix elements become relatively uniform across most of the frequency range (except the uninteresting acoustic modes below 2 THz) at pressures over 120 GPa in Pnma structure and at 130 GPa in Cmca structure; this behavior is evident in Fig. 4 and especially in Fig. 5 where the results for the Cmca structure at 130 GPa are pictured. This characteristic is fundamentally different from that below 100 GPa, discussed above.
At pressures over 140 GPa, the Pnma structure is clearly favored in our calculation, and linear response calculations indicate the structure is dynamically stable. The overall results are evident in Fig. 4, which shows that the structures remain stable (no imaginary frequencies) and the lattice stiffens smoothly with increasing pressure, and in Fig. 6 that shows that strong electron-phonon coupling persists and Tc remains high. In this high pressure range, the incommensurate structure proposed by Arapan, Mao, and AhujaArapan at pressure over 130 GPa is also a possibility.
VI Coupling Strength and Tc
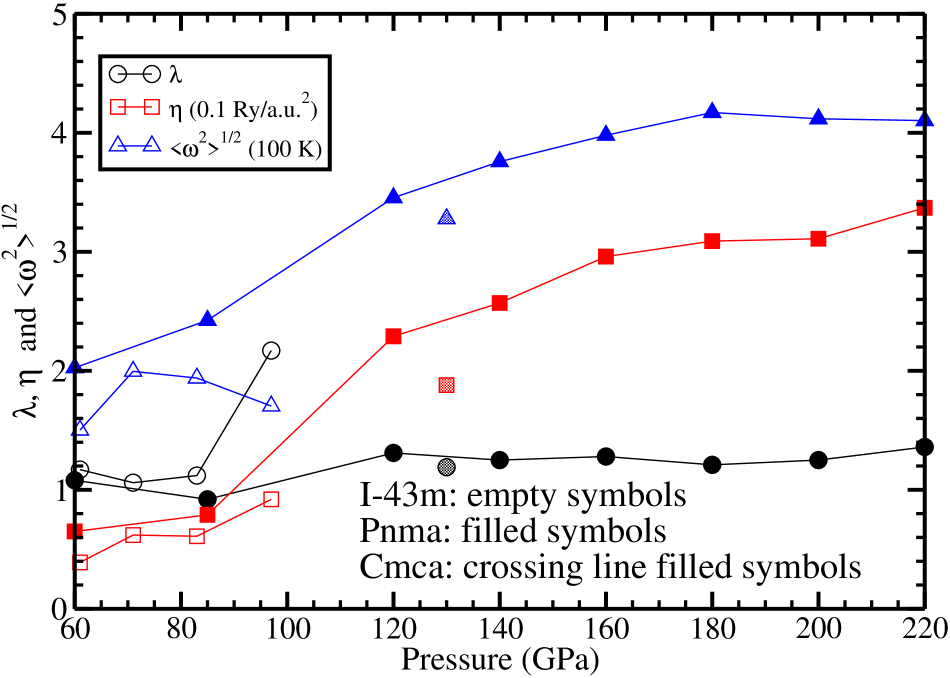
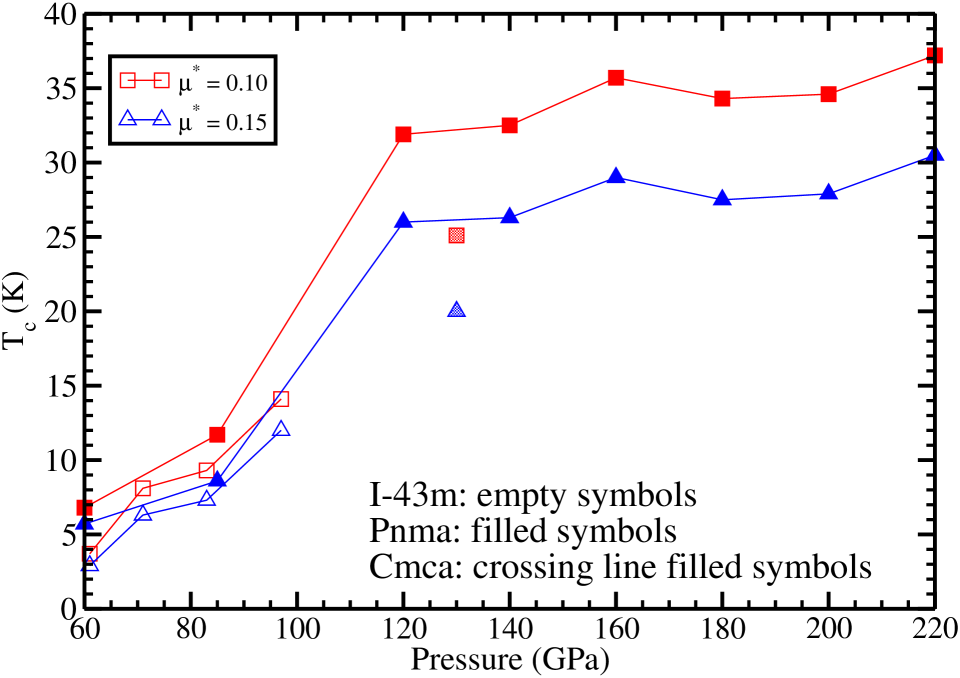
Figure 6 shows the calculated , , and rms frequency versus pressure for a few structures and pressures. The calculated values of Tc are shown in the lower panel, using two values of Coulomb pseudopotential =0.10 and 0.15 that bracket the commonly used values and therefore give an indication of the uncertainty due to the lack of knowledge of the value of and its pressure dependence. Results are provided for Ca in I3m, Pnma and Cmca structures at a few pressures up to 220 GPa. In elemental metals and in compounds where coupling is dominated by one atom type, has often been useful in characterizing contributions to Tc.wep1982 increases with pressure monotonically by a factor of more than 5 from 60 GPa to 220 GPa. The coupling constant increases modestly up to 120 GPa then remains nearly constant at = 1.2-1.4. As pointed out elsewhere,Li2 a dense zone sampling is needed to calculate accurately, so any small variation is probably not significant. The increase in beyond 120 GPa correlates well with the lattice stiffening (increase in ) in this pressure range.
The trend of the resulting Tc generally follows, but seems to overestimate somewhat, the experimental valuesCa-exp . For Cmca structure at about 130 GPa, the calculated EPC strength is and Tc = 20-25K (for the two values of ) in very satisfactory agreement with the observed values of Tc in this pressure range. For Pnma structure, Tc increases rapidly in the 80-120 GPa region. At pressures above 120 GPa up to the maximum 220 GPa that we considered, the EPC constant is 1.2-1.4 and the calculated Tc increases modestly from 25-30K at 120 GPa to 30-35K at 220 GPa. Neither the structure dependence nor the pressure dependence seems very important: the strong coupling and high Tc is more the rule than the exception. Ca at high pressure may be an excellent superconductor regardless of its structure.
VII Summary
Calculations of enthalpy versus pressure for five crystalline phases of Ca (simple cubic and four distortions from it) indicate quasi-degeneracy, with enthalpy differences small enough that one might expect a locally disordered, highly anharmonic, fluctuating structure at room temperature. Over most of the 30-150 GPa range, we find at least three crystal phases whose enthalpies indicate they will compete strongly at room temperature. The sc phase itself is badly unstable dynamically (at T=0), but the observed “sc” diffraction pattern can be understood as a locally noncrystalline, highly anharmonic phase derived from a spatially inhomogeneous and dynamically fluctuating combination of these structures, with most of them being straightforward distortions from the sc structure. Such a scenario seems to account qualitatively for the XRD observations of a “sc” structure.
At pressures below 100 GPa, the quasi-degenerate structures tend to have soft branches or occasionally lattice instabilities, which are associated with strong electron-phonon coupling. In the pressure range of 110 to 130 GPa three phases (P43212, Cmca and Pnma) again become quasi-degenerate, and again it seems likely there will be spacial and temporal fluctuations between the structures. Of course other structures may come into play as well; Arapan, Mao, and AhujaArapan have proposed that the Pnma structure competes with an incommensurate structure at high pressure.
As our other main result, we find that linear response calculation of the EPC strength and superconducting Tc accounts for its impressive superconductivity in the high pressure regime and accounts in a broad sense for the strong increase of Tc in the “sc” phase. At higher pressure beyond the current experimental limit (i.e., 161 GPa), Tc still lies in the 20-30 K range for some phases that we have studied. In fact strong electron-phonon coupling seems to be present in several phases across a substantial high pressure range, although we have no simple picture why such strong coupling should arise. (The strong coupling in Li and Y likewise has no simply physical explanation.Li-th2 ; Y-th1 ) These results may resolve some of the perplexing questions on the structure and record high Tc for an element, and should help in obtaining a more complete understanding of the rich phenomena that arise in simple metals at high pressure.
After submission of our manuscript, we became aware of a study by Yao et al.Yao-PRL . They performed structural studies of calcium in the range 34-78 GPa using metadynamics and genetic algorithm methods. Their methods and results are complementary to ours, with each approach providing its own insights. Connections of their work to ours is evident; for example, the I41/amd structure they focused on is slightly distorted from simple cubic, as are the structures that we study. Since its enthalpy is within 20 meV/Ca of the Pnma structure across this pressure range, their result is consistent with our explanation of the observation of the simple cubic diffraction pattern at room temperature. Their linear response calculations of electron-phonon coupling and the resulting Tc are also consistent with the more extensive results that we present.
VIII Acknowledgments
This work was supported by DOE through the Scientific Discovery through Advanced Computing program (SciDAC grant DE-FC02-06ER25794), and by DOE grant DE-FG02-04ER46111 with important interaction from the Computational Materials Science Network. One of us (F.G.) acknowledges support from NSF through grant OCI PetaApps 0749217.
References
- (1) K. Shimizu, H. Ishikawa, D. Takao, T. Yagi and K. Amaya, Nature (London) 419, 597 (2002).
- (2) V. V. Struzhkin, M. I. Eremets, W. Gan, H.-K. Mao and R. J. Mao, Science 298, 1213 (2002).
- (3) J. J. Hamlin, V. G. Tissen and J. S. Schilling, Phys. Rev. B 73, 094522 (2006).
- (4) M. Debessai, J. J. Hamlin and J. S. Schilling, Phys. Rev. B 78, 064519 (2008).
- (5) G. Profeta, C. Franchini, N. N. Lathiotakis, A. Floris, A. Sanna, M. A. L. Marques, M. Lüders, S. Massidda, E. K. U. Gross and A. Continenza, Phys. Rev. Lett. 96, 047003 (2006).
- (6) D. Kasinathan, J. Kunes, A. Lazicki, H. Rosner, C. S. Yoo, R. T. Scalettar and W. E. Pickett, Phys. Rev. Lett. 96, 047004 (2006).
- (7) Z. P. Yin, S. Y. Savrasov and W. E. Pickett, Phys. Rev. B 74, 094519 (2006).
- (8) P. P. Singh, Phys. Rev. B 75, 125101 (2007).
- (9) T. Yabuuchi, T. Matsuoka, Y. Nakamoto and K. Shimizu, J. Phys. Soc. Jpn., 75, 083703 (2006).
- (10) H. Olijnyk and W. B. Holzapfel, Phys. Lett. 100A, 191 (1984).
- (11) A. V. Hippel, J. Chem. Phys., Vol. 16, No. 4, pp. 372 (1948).
- (12) W. H. Beamer and C. R. Maxwell, J. Chem. Phys., Vol. 17, No. 12, pp. 1293 (1949).
- (13) Z. P. Yin and W. E. Pickett, (2007, unpublished).
- (14) A. Bergara, (2007, unpublished).
- (15) A. M. Teweldeberhan and S. A. Bonev, Phys. Rev. B 78, 140101(R) (2008).
- (16) S. Mizobata, T. Matsuoka and K. Shimizu, J. Phys. Soc. Jpn. 76, 23 (2007).
- (17) A. Phusittrakool, T. Bovornratanaraks, R. Ahuja, and U. Pinsook, Phys. Rev. B 77, 174118 (2008).
- (18) T. Bovornratanaraks, D. R. Allan, S. A. Belmonte, M. I. McMahon, and R. J. Nelmes, Phys. Rev. B 73, 144112 (2006).
- (19) M. I. McMahon, T. Bovornratanaraks, D. R. Allan, S. A. Belmonte, and R. J. Nelmes, Phys. Rev. B 61, 3135 (2000).
- (20) Y. C. Zhao, F. Porsch, and W. B. Holzapfel, Phys. Rev. B 54, 9715 (1996).
- (21) M. Debessai, J. J. Hamlin, and J. S. Schilling, Phys. Rev. B 78, 064519 (2008).
- (22) T. Yabuuchi, Y. Nakamoto, K. Shimizu and T. Kikegawa, J. Phys. Soc. Jpn., 74, 2391 (2005).
- (23) H. Fujihisa, Y. Nakamoto, K. Shimizu, T. Yabuuchi and Y. Gotoh, Phys. Rev. Lett. 101, 095503 (2008).
- (24) Y. Yao, J. S. Tse, Z. Song, D. D. Klug, J. Sun and Y. LePage, Phys. Rev. B 78, 054506 (2008).
- (25) T. Ishikawa, A. Ichikawa, H. Nagara, M. Geshi, K. Kusakabe and N. Suzuki, Phys. Rev. B 77, 020101(R) (2008).
- (26) S. Arapan, H.-K. Mao, and R. Ahuja, PNAS 105, 20627 (2008).
- (27) R. Ahuja, O. Eriksson, J. M. Wills and B. Johansson, Phys. Rev. Lett. 75, 3473 (1995).
- (28) K. Koepernik and H. Eschrig Phys. Rev. B 59, 1743 (1999).
- (29) P. Blaha, K. Schwarz, G. K. H. Madsen, D. Kvasnicka and J. Luitz, WIEN2k (K. Schwarz, Techn. Univ. Wien, Austria), 2001. ISBN 3-9501031-1-2.
- (30) F. Gygi, http://eslab.ucdavis.edu/.
- (31) P. Giannozzi et al., http://www.quantum-espresso.org.
- (32) S. Y. Savrasov, Phys. Rev. B 54, 16470 (1996).
- (33) S. Y. Savrasov and D. Y. Savrasov, Phys. Rev. B 54, 16487 (1996).
- (34) D. Vanderbilt, Phys. Rev. B 41, 7892 (1990).
- (35) J. P. Perdew, K. Burke, and M. Ernzerhof, Phys. Rev. Lett. 77, 3865 (1996).
- (36) P. Hohenberg and W. Kohn, Phys. Rev. 136, B864 (1964).
- (37) W. Kohn and L. J. Sham, Phys. Rev. 140: A1133 (1965).
- (38) D. Kasinathan, K. Koepernik, J. Kunes, H. Rosner, and W. E. Pickett, Physics C 460-462, 133 (2007).
- (39) W. E. Pickett, Phys. Rev. B 25, 745 (1982).
- (40) Y. Yao, D. D. Klug, J. Sun, and R. Martǒńak, Phys. Rev. Lett. 103, 055503 (2009).