V819 Tau: A Rare Weak-Lined T Tauri Star with a Weak Infrared Excess
Abstract
We use Spitzer data to infer that the small infrared excess of V819 Tau, a weak-lined T Tauri star in Taurus, is real and not attributable to a “companion” 10″ to the south. We do not confirm the mid-infrared excess in HBC 427 and V410 X-ray 3, which are also non-accreting T Tauri stars in the same region; instead, for the former object, the excess arises from a red companion 9″ to the east. A single-temperature blackbody fit to the continuum excess of V819 Tau implies a dust temperature of 143 K; however, a better fit is achieved when the weak 10 and 20 m silicate emission features are also included. We infer a disk of sub-m silicate grains between about 1 AU and several 100 AU with a constant surface density distribution. The mid-infrared excess of V819 Tau can be successfully modeled with dust composed mostly of small amorphous olivine grains at a temperature of 85 K, and most of the excess emission is optically thin. The disk could still be primordial, but gas-poor and therefore short-lived, or already at the debris disk stage, which would make it one of the youngest debris disk systems known.
Subject headings:
circumstellar matter — stars: formation — stars: individual (V819 Tau, HBC 427, V410 X-ray 3) — stars: pre-main sequence — infrared: stars1. Introduction
The evolution and dissipation of protoplanetary disks has been an active area of research for the last few decades; especially the advent of sensitive near- and mid-infrared observations has allowed us to explore inner disk regions (out to a few AU), encompassing the radii where planets are thought to form. The role of planet formation in disk dissipation has been all but proven; while disks likely evolve from a flared, optically thick configuration to a flat, settled disk via grain growth and settling, it is not clear to what extent the eventual dissipation of the remaining dust and gas and the formation of planets are linked.
A key evolutionary stage in disk dissipation is the transition from the classical T Tauri stage, when a pre-main-sequence star is surrounded by an accreting disk, to the weak-lined T Tauri phase, when accretion ends and the disk disappears. This transitional stage is believed to be short ( 105 years), since only few stars with vanishing infrared excesses have been observed (e.g., Skrutskie et al., 1990; Simon & Prato, 1995). The Infrared Spectrograph111The IRS was a collaborative venture between Cornell University and Ball Aerospace Corporation funded by NASA through the Jet Propulsion Laboratory and the Ames Research Center. (IRS; Houck et al., 2004) on board the Spitzer Space Telescope (Werner et al., 2004) has provided new insights into the study of transitional disks. For example, in the nearby and well-studied Taurus star-forming region (Kenyon & Hartmann, 1995), out of a total of 111 T Tauri stars, five objects were identified whose inner disk regions are cleared to different degrees, but outer, optically thick disks remain, delimited by a well-defined inner disk rim (D’Alessio et al., 2005; Calvet et al., 2005; Furlan et al., 2006; Espaillat et al., 2007). Planet formation, photoevaporation, or inner disk draining induced by the magneto-rotational instability may play a role in removing the inner disk (Clarke, Gendrin, & Sotomayor, 2001; Quillen et al., 2004; Alexander & Armitage, 2007; Chiang & Murray-Clay, 2007), but also close binary companions can clear inner regions due to orbital resonances (Artymowicz & Lubow, 1994; Ireland & Kraus, 2008).
V819 Tau is a weak-lined T Tauri star with a spectral type of K7 in the Taurus star-forming region (Herbig & Bell, 1988). We presented its Spitzer IRS spectrum in Furlan et al. (2006) as part of the sample of Class III objects in Taurus, noting that it showed an infrared excess beyond about 12 m (see Figure 1). However, we could not confirm whether this excess was real due to the presence of a “companion” 10″ to the south that is detected in 2MASS images (Skrutskie et al., 2006). Two other weak-lined T Tauri stars in Taurus, HBC 427 and V410 X-ray 3, with spectral types of K5 and M6, respectively (Steffen et al., 2001; Strom & Strom, 1994), were also introduced in Furlan et al. (2006) as objects with uncertain infrared excesses. While HBC 427 has a “companion” star about 15″ to the southeast that is seen in 2MASS images, V410 X-ray 3 appears to be single. In the meantime, we obtained IRS peak-up images of V819 Tau and HBC 427, and we re-reduced the IRS spectra of all three objects. We do not confirm the mid-infrared excess in HBC 427 and V410 X-ray 3, but, together with Multiband Imaging Photometer for Spitzer (MIPS; Rieke et al., 2004) 24 m images from the Spitzer archive, we establish that the infrared excess is intrinsic to V819 Tau, and we apply simple models to derive the distribution of dust around this T Tauri star.

2. Observations
2.1. V819 Tau
The IRS data of V819 Tau were taken on 2004 March 5 with the two low-resolution IRS modules (Short-Low [SL] and Long-Low [LL], 5.2–14 m and 14–38 m, respectively, / 90) in staring mode, and the spectrum was extracted and calibrated as described in Furlan et al. (2006). The narrower SL slit (3.6″ wide) was oriented roughly along the north-south direction, with the LL slit (10.5″ wide) perpendicular to the SL slit (see a sketch of the slit positions in Figure 2). Since we extracted the object with a variable-width column that varies from a width of about 3 pixels to about 5 pixels from shortest to longest wavelengths in each module, the largest extraction radius in SL amounts to 4.5″, while in LL this value is 13″. These beams are just slightly larger than the diffraction-limited sizes of a point-source at 14 and 38 m, respectively, observed with Spitzer. The companion star 10″ to the south of V819 Tau is very faint at near-infrared wavelengths, with flux ratios relative to V819 Tau of 0.04-0.03 from to ; if it were a very red object, it could have contaminated some of the emission in LL, but not in SL.
To determine the mid-infrared flux of the “companion”, we obtained IRS red (16 m) and blue (22 m) peak-up images on 2006 March 7 (Spitzer AORID 16269312). We dithered the target in two positions displaced by 9″ from the center of the peak-up field of view; at each position we integrated for 6 seconds. For the red peak-up images, we performed this sequence twice. By subtracting two such nod pairs from each other, we removed any background emission; aperture photometry with a radius of 3 pixels and a sky annulus between 18 and 20 pixels yielded 16 and 22 m fluxes of 18.4 0.2 and 24.6 0.2 mJy, respectively, for V819 Tau. These flux values include aperture correction factors of 1.418 and 1.561 for the blue and red peak-up, respectively, and they were derived assuming a spectral shape of =constant for the source spectrum (see the document pu_fluxcal.txt found on the IRS page of the Spitzer Science Center’s website).
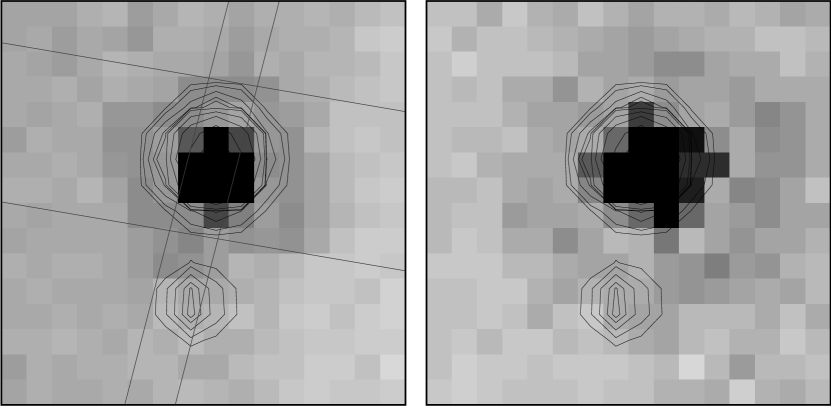
Figure 2 shows the 16 and 22 m peak-up images of V819 Tau; each represents the sum of two peak-up exposures and was rotated such that north is up and east is to the left. Superposed on Figure 2 are the contours of the 2MASS image. While the southern “companion” is clearly present in 2MASS, it is not detected at 16 or 22 m. We derived upper limits for its flux from the rms in 33 (for the blue peak-up) and 55 (for the red peak-up) pixel boxes centered at its position in the co-added image pairs. We thus obtained 16 and 22 m 5- upper limits of 0.8 and 2.0 mJy, respectively.
We also retrieved the MIPS 24 and 70 m post-bcd, mosaicked images from the Spitzer archive (program 3584, PI D. Padgett; Spitzer AORID 11229696). By using a circular aperture with a radius of 14 pixels and a sky annulus between 16 and 20 pixels, and by applying an aperture correction factor of 1.082, we measured a flux of 22.3 1.3 mJy at 24 m for V819 Tau. At 70 m, we used the filtered bcd image from the Spitzer archive and derived a 5- upper limit of 30 mJy from the rms in a 1313 pixel box centered at the position of V819 Tau. These fluxes assume a spectral shape of ; corrections for different spectral shapes are minor, e.g., 4% at 24 m and 9% at 70 m for =constant (see MIPS Data Handbook).
Thus, the imaging data confirms that the IRS spectrum of V819 Tau is not contaminated at any significant level by the source that is seen to its south at near-IR wavelengths. We will therefore consider the long-wavelength emission as coming only from the disk around V819 Tau.
2.2. HBC 427
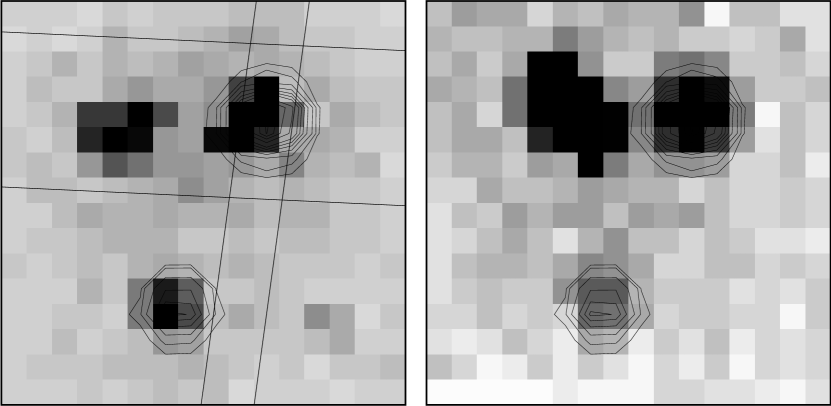
Similar to V819 Tau, the IRS data of HBC 427 were taken on 2004 February 27 with the SL and LL modules in staring mode and reduced in the same manner. The slits were oriented similarly to V819 Tau (see Figure 3). In 2MASS, only two sources are detected; the southern “companion” is about half as bright as HBC 427 at , but 15″ from it ( 8 ″ from the nearest edge of the LL slit), making it unlikely to contribute substantially to the LL flux. However, after we obtained IRS red and blue peak-up images of HBC 427 on 2006 March 8 (Spitzer AORID 16270336), we discovered an infrared-bright companion of HBC 427 that does not show up in 2MASS images. It lies 9″ to the east of HBC 427 and is the brightest object of the three at 22 m. This object, HBC 427/1, was actually already identified by Massarotti et al. (2005), who imaged it at 1.025 m and retrieved it from the USNO-B1.0 catalog. Our LL observation represents the combined flux of HBC 427 and HBC 427/1; in particular starting at about 20 m, the latter source dominates the emission.
In order to measure the peak-up fluxes of HBC 427 and HBC 427/1, we performed aperture photometry. Even though our observing sequence was the same as for the peak-up observations of V819 Tau, we could not subtract the background by subtracting the nod pairs, since the field was too crowded. Thus, the only sky subtraction was performed during aperture photometry, where we used an aperture radius of 2 pixels and a sky annulus between 11-12 and 13-14 pixels. By applying aperture correction factors of 1.661 and 1.885 for the blue and red peak-up, respectively, and assuming a spectral shape of =constant, we derived 16 m fluxes of 11.0 0.2 mJy and 7.2 0.2 mJy for HBC 427 and HBC 427/1, respectively, and 22 m fluxes of 7.0 0.2 mJy and 14.4 0.3 mJy for HBC 427 and HBC 427/1, respectively.
We also measured the fluxes of these two objects in the MIPS 24 m post-bcd, mosaicked image from the Spitzer archive (program 173, PI N. Evans; Spitzer AORID 5683200). Applying a PSF fit using the star HD 31305, which appears in the same image, as PSF calibrator, yielded 24 m fluxes of 5.0 1.3 mJy and 17.8 1.2 mJy for HBC 427 and HBC 427/1, respectively.
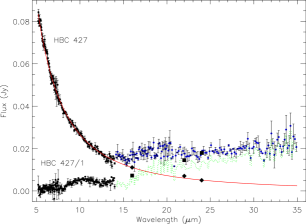
We obtained an IRS spectrum of HBC 427/1 on 2006 March 15 (Spitzer AORID 16262400) using SL and LL in staring mode. While we were able to extract and calibrate the SL spectrum for HBC 427/1, the LL spectrum is again a combination of the flux of HBC 427/1 and HBC 427. Since this LL spectrum has better signal-to-noise than the one obtained earlier due to longer integration times, we use this spectrum in the following plot. Figure 4 shows the IRS spectra of both HBC 427 and HBC 427/1, as well as the photometry we obtained from the peak-up and MIPS images. A blackbody fit to the SL spectrum demonstrates that the 16, 22, and 24 m fluxes of HBC 427 are essentially photospheric; the infrared excess is solely attributable to HBC 427/1.
2.3. V410 X-ray 3
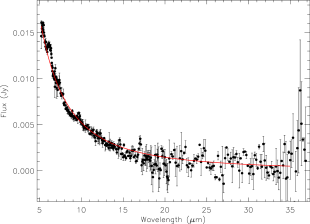
The IRS data of V410 X-ray 3 were taken on 2004 Feb 7, also using SL and LL in starting mode. Since this object is very faint in the first order of LL (20-36 m), we first subtracted sky emission by using the off-order observation, then extracted its 20-36 m spectrum while also fitting a first order polynomial to the background emission in the slit. This procedure allowed for more accurate background subtraction. We compared reductions done with basic calibrated data products from the Spitzer Science Center’s S11, S13.2, and S18.7 pipeline versions, and the differences were minimal. As a result of the improved background subtraction, we do not confirm the tentative excess seen in Furlan et al. (2006); the IRS spectrum seems consistent with photospheric emission alone (see Figure 5).
3. Spectral Energy Distributions
Skrutskie et al. (1990) stated that V819 Tau has a spectral energy distribution (SED) that identifies it as a “transitional” disk, i.e., a disk with an optically thin inner region and an optically thick outer disk. Beckwith et al. (1990) detected millimeter-continuum emission from V819 Tau and inferred a disk mass of 0.032 , implying that its outer disk is fairly massive. However, the far-IR SED of Skrutskie et al. (1990) had to rely on IRAS data, which are not reliable for such a faint source: according to Weaver & Jones (1992), the IRAS 25 and 60 m fluxes of V819 Tau are both 100 mJy, while our data shows that the flux at 30 m amounts to 20 mJy. In addition, later measurements by Osterloh & Beckwith (1995) and Duvert et al. (2000) only determined an upper limit to the 1.3 mm flux of 9 and 2.5 mJy, respectively, and Andrews & Williams (2005) could also only give upper limits to the 450 and 850 m fluxes (317 and 9 mJy, respectively); the latter authors determined a disk mass of less than 0.0004 . Thus, it seems that the outer disk is not very massive.
Since the more recent measurements are much more precise, they should be favored when interpreting V819 Tau. Given that the excess emission from this T Tauri star is weak, earlier data with less sensitive instruments are more uncertain. The object 10″ to the south of V819 Tau is even fainter; its low infrared flux values support the suggestion of Woitas et al. (2001) that it is likely a background star due to its low luminosity and its inferred age that places it well below the main sequence when plotted with evolutionary tracks.
Opposite to what we found for V819 Tau, the new Spitzer data of HBC 427 show that the infrared excess seen in the long-wavelength part of the IRS spectrum is attributable to a nearby companion, HBC 427/1. Even though Massarotti et al. (2005) suggest it could be a hot background star based on its optical to near-IR colors, the infrared excess indicates that it is an object surrounded by dust. We estimated the emission of HBC 427/1 beyond 14 m by subtracting a blackbody fit to the SL spectrum of HBC 427 from the LL spectrum (see Figure 4); the 16, 22, and 24 m photometry of HBC 427/1 agrees reasonably well with this estimated spectrum. The infrared excess consists of continuum emission, as well as optically thin radiation from silicate dust grains, whose signatures are broad 10 and 20 m emission features, similar to what is seen in protoplanetary disks (e.g., Furlan et al., 2006). However, without any additional data, we cannot conclusively determine the nature of this object.
The very low-mass star V410 X-ray 3 is fainter than V819 Tau or HBC 427; only a careful new reduction of its IRS spectrum showed that it does not have an infrared excess. A blackbody fit to the 5-14 m spectrum also matches the 15-35 m fluxes (see Figure 5). However, the spectrum beyond 20 m is quite noisy; we can therefore not exclude excesses smaller than about 1 mJy in this wavelength range. Luhman et al. (2009) find that a very small excess of 0.4 mag may be present in MIPS 24 m data, which is smaller than our upper limit of 1 mag for an excess at this wavelength. More sensitive observations at longer wavelengths are necessary to confirm this small excess; given the current data, we consider V410 X-ray 3 as diskless.
4. The IRS Spectrum and Model Fits of V819 Tau
Our IRS spectrum confirms the transitional disk nature of V819 Tau, but it reveals that the mid-infrared excess is much smaller than previously thought (see Figure 1); it sets in at about 8 m, and is roughly constant with wavelength between 23 and 33 m. The very small infrared excess ( 10-3) makes V819 Tau the most advanced transitional disk in the Taurus sample observed to date. Also, as opposed to the other transitional disks, whose inner holes are delimited by a disk wall that gives rise to a steep continuum slope beyond 13 m, the spectral index between 13 and 25 m for V819 Tau is more negative, in a range typical for settled disks (Furlan et al., 2006).
V819 Tau is a K7 star (Walter & Kuhi, 1981), which suggests =4060 K (Kenyon & Hartmann, 1995); combined with a luminosity of 0.81 (KH95), we derive a stellar radius of 1.8 . Using evolutionary tracks computed by Baraffe et al. (1998), we infer a stellar mass of 0.8 (as well as an age of 2 Myr), which indicates that the surface gravity is of the order 3.5-4.0. Thus, for the photosphere we adopt one of the NextGen photospheric models (Allard, Hauschildt, & Schweitzer, 2000) with =4000 K, =3.5, scaled by assuming a stellar radius of 2 and a distance of 140 pc (Bertout et al., 1999).
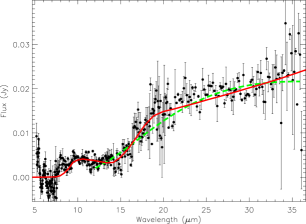
The photosphere-subtracted IRS spectrum is shown in Figure 6. A single-temperature blackbody fit from 12 to 36 m yields a blackbody temperature of 143 K. If the excess emission were optically thick, generated by a solid blackbody surface, this temperature would imply an inner disk radius of 6.8 AU. However, the low excess flux at longer wavelengths is not typical for optically thick emission. Assuming optically thin emission from gray grains in radiative equilibrium whose absorption cross section equals their geometric cross section (i.e, large, blackbody grains), the inner disk radius would lie at 3.4 AU. More realistically, the absorption efficiency varies with wavelength, as is the case for smaller grains (e.g., Dorschner et al., 1995). We actually detect the signatures of small, amorphous grains of silicate composition (“amorphous silicates”) in an optically thin medium as weak, broad features centered at 10 and 20 m (e.g., Jäger et al., 1994) in the photosphere-subtracted spectrum. If the dust grains are small (sub-m), their absorption efficiency in the infrared is less than at shorter wavelengths, leading to so-called superheating, which would result in a grain being at a somewhat larger distance from the star than a blackbody at the same temperature.
The lack of substantial excess emission below about 8 m suggests that the inner disk regions are cleared of small dust grains. In order to derive the disk structure of V819 Tau, we applied an optically thin model fit to the infrared excess emission (8-34 m). We adopted the optical constants of “astronomical” silicates from Draine & Lee (1984) and chose different grain sizes with various surface density distributions (which act as a scaling factor for the emission) to match the observed excess. The grain size distribution was assumed to vary as a power law with an index of -3.5. At each distance from the star, we calculated the equilibrium temperature for the average grain size, and then integrated the optically thin emission from all grains over a certain radius range to achieve a good fit.
A range of model parameters results in fits that reproduce the weak 10 and 20 m silicate emission features and rising continuum seen in the photosphere-subtracted spectrum: minimum grain sizes from 0.1 to 0.5 m, maximum grain sizes of 0.5 or 1 m, an inner disk radius of 1 AU, and outer disk radii from 300 to 800 AU. Several models lie within reduced () values of 0.3 from the best-fit model (=19.1), which is shown in Figure 6. These models are basically indistinguishable except for slight differences beyond 30 m, where the flux is most sensitive to the outer disk radius; at 70 m, they all lie at or below the upper limit derived from MIPS data. A surface density constant in radius is necessary to reproduce the slowly rising 20-35 m excess, as is an outer radius of several 100 AU; if the disk were smaller than 100 AU, the model would still fit the excess out to 20 m, but increasingly underpredict the flux at longer wavelengths. An inner radius of 0.5 AU instead of 1 AU results in an increase in by about 1. Summarizing, we require sub-m grains distributed uniformly between 1 AU and at least 100 AU to reproduce the infrared excess of V819 Tau. The mass of optically thin dust from our models amounts to up to 2.4 1026 g, or 3.2 lunar masses, for the largest disk sizes, and about 4.6 1025 g, or 0.6 lunar masses, for a disk of 400 AU radius. The optical depth of the emission by all grains is only 10-4-10-3 over the infrared spectral range.
| Dust component | T [K] | Mass [lunar masses] |
|---|---|---|
| small amorphous olivinea | 345 | (2.0 1.4) 10-6 |
| small amorphous olivinea | 85 | (9.9 0.8) 10-3 |
| large amorphous pyroxeneb | 85 | (3.1 0.8) 10-3 |
| forsteritec | 85 | (1.2 0.5) 10-3 |
| blackbodyd | 345 K | (4.5 0.7) 10-18 sr |
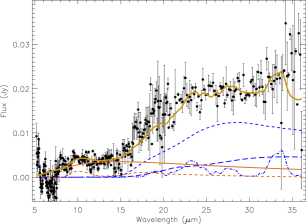
In order to gauge the dust composition of the V819 Tau disk, we applied a model to the photosphere-subtracted spectrum beyond 7.7 m following the methods of Sargent et al. (2006, 2009a, 2009b). The best value of 14.7 is achieved by using a warm dust component at 345 K and a cold one at 85 K. The warm component includes a blackbody, which represents continuum emission from an optically thick medium or featureless emission from grains in an optically thin medium, and small amorphous silicates of olivine composition (“amorphous olivine”). The cold component is dominated by small amorphous olivine, with contributions of large amorphous silicates of pyroxene composition (“amorphous pyroxene”) and forsterite (see Table 1 and Figure 7). These model components represent a best fit to the data and were narrowed down from a larger sample of dust components that included small and large amorphous silicates, enstatite, forsterite, and silica, which are typically found in protoplanetary disks (see Sargent et al. (2009b) for details). The uncertainties listed in Table 1 actually amount to a few standard deviations (see Sargent et al., 2009b); combined with the fact that a blackbody cannot fit the data well (see Figure 6), the identification of amorphous silicates in our data is quite robust. However, the detection of forsterite is rather tentative, since the spectrum is more noisy beyond 20 m.
The dust mass is dominated by cold, sub-m amorphous olivine grains, which are typical for the interstellar medium. The presence of some large (5 m radius, 60% vacuum porous) amorphous pyroxene grains, and possibly also forsterite, suggests that some dust processing has taken place. Assuming a distribution of dust between 1 AU and several tens of AU, the optical depth amounts to 10-3. Thus, the dust we observe in V819 Tau is dominated by silicates in an optically thin medium.
5. Discussion and Conclusions
Of the three Class III objects in Taurus that showed tentative mid-infrared excess emission in Furlan et al. (2006), we could confirm an infrared excess only in V819 Tau. While V819 Tau is a single star, HBC 427 and V410 X-ray 3 are close binaries: HBC 427 is a spectroscopic binary with a semi-major axis of about 0.03″, comprised of a K5 and an M2 star (Steffen et al., 2001); V410 X-ray 3 consists of an M6 and an M7.7 star separated by 0.05″ (Kraus et al., 2006). Neither object shows signs of accretion (Strom & Strom, 1994; Kenyon et al., 1998; Mohanty et al., 2005), and therefore both dust and gas have already dissipated in their inner disks. HBC 427 is also not detected at sub-millimeter wavelengths, implying an upper limit for the disk mass of 0.0007 (Andrews & Williams, 2005). It is likely that interaction between the binary and the disk in these systems is the cause for the absence of disk material (Jensen et al., 1994).
V819 Tau is also not accreting any more; its H 10% width amounts to 166 km s-1 (Nguyen et al., 2009), which is considerably less than the lower limit of 270 km s-1 that characterizes accretors (White & Basri, 2003). Also the low H equivalent width of 1.7-3.2 Å (Strom & Strom, 1994; Kenyon et al., 1998) confirms its nature as a weak-lined T Tauri star. White & Ghez (2001) determined an upper limit of yr-1 for the mass accretion rate based on the lack of -band excess. No H2 emission from warm inner disk regions was detected (Bary, Weintraub, & Kastner, 2003), implying that both the gas and dust have been removed there. Our data indicate that there are no small, warm dust grains within approximately 1 AU from the star.
One process that can generate cleared inner disk regions is photoevaporation (Clarke, Gendrin, & Sotomayor, 2001); it sets in once the mass accretion rate has dropped to levels below a few 10-10 yr-1, and it acts by eroding the disk in a photoevaporative flow beyond a certain radius, which, for V819 Tau, amounts to 7.1 AU. This value is larger than the inner radius of our best-fit optically thin disk models, but it is remarkably close to the value of 6.8 AU we estimated by assuming the excess emission to arise from an optically thick, blackbody surface. However, it seems that the dust emission is optically thin, given the presence of 10 and 20 m silicate emission features and the low infrared excess luminosity ( 10-3). Moreover, our models require small dust grains at distances of at least 1 AU from the star. Thus, photoevaporation cannot explain the inner disk clearing of V819 Tau; a change in grain opacity caused by grain growth to sizes well beyond 1 m in this region, or the gravitational influence of another body, such as a planet, are possible explanations for the inner disk clearing.
The question also arises whether the material we detect around V819 Tau is primordial or already second-generation dust. Detection of gas emission from the inner disk would support the primordial nature of the disk; so far, the absence of accretion signatures and H2 emission from the inner disk suggest that the gas has already dissipated. Without the gas, dust particles would be subject to collisions, Poynting-Robertson (PR) drag, radiation pressure, and corpuscular stellar wind pressure (e.g., Wyatt et al., 1999; Chen et al., 2006), which, in the region from 1 to 100 AU from V819 Tau, would limit the lifetime of sub-m grains to 105 years.
Therefore, in the absence of gas, dust would have to be continuously replenished, since the age of V819 Tau is about 2 Myr. V819 Tau would be one of the youngest debris disk systems; its infrared excess would lie on the higher side of what is usually measured in debris disks (e.g., Chen et al., 2006), but still within the observed range. Collisions among planetesimals, as are thought to occur in debris disks, typically produce larger grains ( 10 m), since the mid-infrared spectra of the majority of debris disks are featureless (Chen et al., 2006; Carpenter et al., 2009). The fact that small, amorphous silicate grains dominate the optically thin emission of V819 Tau, with just a minor possible presence of crystalline silicates, suggests that the dust we observe consists of mostly pristine material. Colliding or evaporating comet nuclei, which likely form in the outer disk regions and therefore incorporate more unprocessed silicates into ice, could be the source of this pristine dust.
It is also possible that we are just observing “true” primordial, unprocessed dust from large disk radii; this would imply that we are witnessing a rare stage in the life of a protoplanetary disk, when the gas has already been mostly removed from the inner disk, and the remaining dust is dissipated on a timescale of 105 years or less. Then, not only could the disk structure of V819 Tau be described as transitional due to the lack of infrared excess below 8 m and the clear presence of such an excess beyond 12 m, but also the evolutionary stage of this object could be considered transitional, i.e., having just transitioned from a primordial, optically thick disk to an optically thin one. Even though a few percent of the T Tauri population in Taurus can be considered as transitional (defined as disks with substantial inner disk clearings and thus low near-infrared excesses; Furlan et al. 2009), V819 Tau would stand out by its very low infrared excess. It would be the only object in Taurus observed so far at an advanced transitional stage, when the disk material is already optically thin. Given the small amount of dust left in the disk, planet formation would have to be already completed in this disk; this conclusion would also apply if the dust were second-generation and therefore the result of dynamically perturbed, remnant planetary building blocks.
References
- Alexander & Armitage (2007) Alexander, R. D., & Armitage, P. J. 2007, MNRAS, 375, 500
- Allard, Hauschildt, & Schweitzer (2000) Allard, F., Hauschildt, P. H., & Schweitzer, A. 2000, ApJ, 539, 366
- Andrews & Williams (2005) Andrews, S. M., & Williams, J. P. 2005, ApJ, 631, 1134
- Artymowicz & Lubow (1994) Artymowicz, P., & Lubow, S. H. 1994, ApJ, 421, 651
- Baraffe et al. (1998) Baraffe, I., Chabrier, G., Allard, F., & Hauschildt, P. H. 1998, A&A, 337, 403
- Bary, Weintraub, & Kastner (2003) Bary, J. S., Weintraub, D. A., & Kastner, J. H. 2003, ApJ, 586, 1136
- Beckwith et al. (1990) Beckwith, S. V. W., Sargent, A. I., Chini, R. S., & Güsten, R. 1990, AJ, 99, 924
- Bertout et al. (1999) Bertout, C., Robichon, N., & Arenou, F. 1999, A&A, 352, 574
- Calvet et al. (2005) Calvet, N., et al. 2005, ApJ, 630, L185
- Carpenter et al. (2009) Carpenter, J. M., Bouwman, J., Mamajek, E. E., Meyer, M. R., Hillenbrand, L. A., Backman, D. E., Henning, Th., Hines, D. C., et al. 2009, ApJS, 181, 197
- Chen et al. (2006) Chen, C. H., Sargent, B. A., Bohac, C., Kim, K. H., Leibensperger, E., Jura, M., Najita, J., Forrest, W. J., et al. 2006, ApJS, 166, 351
- Chiang & Murray-Clay (2007) Chiang, E., & Murray-Clay, R. 2007, Nature Physics, 3, 604
- Clarke, Gendrin, & Sotomayor (2001) Clarke, C. J., Gendrin, A., & Sotomayor, M. 2001, MNRAS, 328, 485
- D’Alessio et al. (2005) D’Alessio, P., et al. 2005, ApJ, 621, 461
- Dorschner et al. (1995) Dorschner, J., Begemann, B., Henning, Th., Jäger, C., & Mutschke, H. 1995, A&A, 300, 503
- Draine & Lee (1984) Draine, B. T., & Lee, H. M. 1984, ApJ, 285, 89
- Duvert et al. (2000) Duvert, G., Guilloteau, S., Ménard, F., Simon, M., & Dutrey, A. 2000, A&A, 355, 165
- Espaillat et al. (2007) Espaillat, C., Calvet, N., D’Alessio, P., Hernández, J., Qi, C., Hartmann, L., Furlan, E., & Watson, D. M. 2007, ApJ, 670, L135
- Furlan et al. (2006) Furlan, E., Hartmann, L., Calvet, N., D’Alessio, P., Franco-Hernández, R., Forrest, W. J., Watson, D. M., Uchida, K. I., et al. 2006, ApJS, 165, 568
- Furlan et al. (2009) Furlan, E., Watson, D. M., McClure, M. K., Manoj, P., Espaillat, C., D’Alessio, P., Calvet, N., Kim, K. H., et al. 2009, ApJ, 703, 1964
- Herbig & Bell (1988) Herbig, G. H., & Bell, K. R. 1988, Lick Observatory Bulletin, Santa Cruz: Lick Observatory, 1988
- Houck et al. (2004) Houck, J. R., et al. 2004, ApJS, 154, 18
- Ireland & Kraus (2008) Ireland, M. J., & Kraus, A. L. 2008, ApJ, 678, L59
- Jäger et al. (1994) Jäger, C., Mutschke, H., Begemann, B., Dorschner, J., & Henning, Th. 1994, A&A, 292, 641
- Jensen et al. (1994) Jensen, E. L. N., Mathieu, R. D., & Fuller, G. A. 1994, ApJ, 429, L29
- Kenyon & Hartmann (1995) Kenyon, S. J., & Hartmann, L. 1995, ApJS, 101, 117 (KH95)
- Kenyon et al. (1998) Kenyon, S. J., Brown, D. I., Tout, Ch. A., & Berlind, P. 1998, AJ, 115, 2491
- Kraus et al. (2006) Kraus, A. L., White, R. J., & Hillenbrand, L. A. ApJ, 649, 306
- Luhman et al. (2006) Luhman, K. L., Whitney, B. A., Meade, M. R., Babler, B. L., Indebetouw, R., Bracker, S., & Churchwell, E. B. 2006, ApJ, 647, 1180
- Luhman et al. (2009) Luhman, K. L., Allen, P. R., Espaillat, C., Hartmann, L., & Calvet, N. 2009, ApJ, submitted
- Massarotti et al. (2005) Massarotti, A., Latham, D. W., Torres, G., Brown, R. A., & Oppenheimer, B. D. 2005, AJ, 129, 2294
- Mathis (1990) Mathis, J. S. 1990, ARA&A, 28, 37
- Mohanty et al. (2005) Mohanty, S., Jayawardhana, R., & Basri, G. 2005, ApJ, 626, 498
- Nguyen et al. (2009) Nguyen, D. C., Jayawardhana, R., van Kerkwijk, M. H., Brandeker, A., Scholz, A., & Damjanov, I. 2009, ApJ, 695, 1648
- Osterloh & Beckwith (1995) Osterloh, M., & Beckwith, S. V. W. 1995, ApJ, 439, 288
- Quillen et al. (2004) Quillen, A. C., Blackman, E. G., Frank, A., & Varnière, P. 2004, ApJ, 612, L137
- Rieke et al. (2004) Rieke, G. H., et al. 2004, ApJS, 154, 25
- Sargent et al. (2006) Sargent, B., Forrest, W. J., D’Alessio, P., Li, A., Najita, J., Watson, D. M., Calvet, N., Furlan, E., et al. 2006, ApJ, 645, 395
- Sargent et al. (2009a) Sargent, B. A., Forrest, W. J., Tayrien, C., McClure, M. K., Li, A., Basu, A. R., Manoj, P., Watson, D. M., et al. 2009, ApJ, 690, 1193
- Sargent et al. (2009b) Sargent, B. A., Forrest, W. J., Tayrien, C., McClure, M. K., Watson, D. M., Sloan, G. C., Li, A., Manoj, P., et al. 2009, ApJS, 182, 477
- Simon & Prato (1995) Simon, M., & Prato, L. 1995, ApJ, 450, 824
- Skrutskie et al. (1990) Skrutskie, M. F., Dutkevitch, D., Strom, S. E., Edwards, S., Strom, K. M., & Shure, M. A. 1990, AJ, 99, 1187
- Skrutskie et al. (2006) Skrutskie, M. F., et al. 2006, AJ, 131, 1163
- Sogawa et al. (2006) Sogawa, H., Koike, C., Chihara, H., Suto, H., Tachibana, S., Tsuchiyama, A., & Kozasa, T. 2006, A&A, 451, 357
- Steffen et al. (2001) Steffen, A. T., Mathieu, R. D., Lattanzi, M. G., Latham, D. W., Mazeh, T., Prato, L., Simon, M., Zinnecker, H., & Loreggia, D. 2001, AJ, 122, 997
- Strom & Strom (1994) Strom, K. M., & Strom, S. E. 1994, ApJ, 424, 237
- Walter & Kuhi (1981) Walter, F. M., & Kuhi, L. V. 1981, ApJ, 250, 254
- Weaver & Jones (1992) Weaver, W. B., & Jones, G. 1992, ApJS, 78, 239
- Werner et al. (2004) Werner, M. W. et al. 2004, ApJS, 154, 1
- White & Basri (2003) White, R. J., & Basri, G. 2003, ApJ, 582, 1109
- White & Ghez (2001) White, R. J., & Ghez, A. M. 2001, ApJ, 556, 265
- Woitas et al. (2001) Woitas, J., Leinert, Ch., & Köhler, R. 2001, A&A, 376, 982
- Wyatt et al. (1999) Wyatt, M. C., Dermott, S. F., Telesco, C. M., Fisher, R. S., Grogan, K., Holmes, E. K., & Piña, R. K. 1999, ApJ, 527, 918