2 Dipartimento di Fisica, Universitá Tor Vergata, via della Ricerca Scientifica 1,I-00133 Roma, Italy
3 Consorzio Interuniversitario Fisica Spaziale (CIFS), villa Gualino - v.le Settimio Severo 63, I-10133 Torino, Italy
4 Dip. Fisica, Università di Trieste, via A. Valerio 2, I-34127 Trieste, Italy
5 INFN Trieste, Padriciano 99, I-34012 Trieste, Italy
6 INAF-IASF Milano, via E. Bassini 15, I-20133 Milano, Italy
7 INFN Roma Tor Vergata, via della Ricerca Scientifica 1, I-00133 Roma, Italy
8 INAF-IASF Bologna, via Gobetti 101, I-40129 Bologna, Italy
9 ENEA Bologna, via don Fiammelli 2, I-40128 Bologna, Italy
10 INFN Roma 1, p.le Aldo Moro 2, I-00185 Roma, Italy
11 Dip. Fisica, Università La Sapienza,p.le Aldo Moro 2, I-00185 Roma, Italy
12 ENEA Frascati, via Enrico Fermi 45, I-00044 Frascati(RM), Italy
13 INFN Pavia, via Bassi 6, I-27100 Pavia, Italy
14 ASI Science Data Center, ESRIN, I-00044 Frascati(RM), Italy
15 IKI, Moscow, Russia
16 Dipartimento di Fisica, Universitad́i Torino, Torino, Italy
17 Agenzia Spaziale Italiana, viale Liegi 26 , 00198 Roma, Italy
18 Osservatorio Astronomico di Roma, Via di Frascati 33, I-00040 Monte Porzio Catone, Italy
19 Osservatorio Astronomico di Cagliari, loc. Poggio dei Pini, strada 54, I-09012, Capoterra (CA)
20 INAF-IASF Palermo, Via Ugo La Malfa 153, 90146 Palermo, Italy
† Deceased
Monitoring the hard X-ray sky with SuperAGILE
Abstract
Context. SuperAGILE is the hard X-ray monitor of the AGILE gamma ray mission, in orbit since 23rd April 2007. It is an imaging experiment based on a set of four independent silicon strip detectors, equipped with one-dimensional coded masks, operating in the nominal energy range 18-60 keV.
Aims. The main goal of SuperAGILE is the observation of cosmic sources simultaneously with the main gamma-ray AGILE experiment, the Gamma Ray Imaging Detector (GRID). Given its steradian-wide field of view and its 15 mCrab day-sensitivity, SuperAGILE is also well suited for the long-term monitoring of Galactic compact objects and the detection of bright transients.
Methods. The SuperAGILE detector properties and design allow for a 6 arcmin angular resolution in each of the two independent orthogonal projections of the celestial coordinates. Photon by photon data are continuously available by the experiment telemetry, and are used to derive images and fluxes of individual sources, with integration times depending on the source intensity and position in the field of view.
Results. In this paper we report on the main scientific results achieved by SuperAGILE over its first two years in orbit, until April 2009. The scientific observations started on mid-July 2007, with the Science Verification Phase, continuing during the complete AGILE Cycle 1 and the first half of Cycle 2. Despite of the largely non-uniform sky coverage, due to the pointing strategy of the AGILE mission, a few tens of Galactic sources were monitored, sometimes for unprecedently long continuous periods, detecting also several bursts and outbursts. Approximately one gamma ray burst per month was detected and localized, allowing for prompt multi-wavelength observations. Few extragalactic sources in bright states were occasionally detected as well. The light curves of sources measured by SuperAGILE are made publicly available on the web in nearly realtime. For a proper scientific use of these we provide the reader with the relevant scientific and technical background.
Key Words.:
Instrumentation: detectors; X-rays: binaries1 Introduction
The SuperAGILE experiment (Feroci et al. 2007) is the hard X-ray imager of the Italian gamma-ray astronomy mission AGILE (Tavani et al. 2009). The primary instrument of the AGILE payload is the GRID (Gamma Ray Imaging Detector, Barbiellini et al. 2002, composed of a Silicon Tracker (ST, Prest et al. 2003) and a small CsI(Tl) ”mini”-calorimeter (MCAL, Labanti et al. 2009), surrounded by a plastic anticoincidence system (ACS, Perotti et al. 2006).
The main scientific goal of AGILE is the observation of the gamma-ray sky in the energy range from 50 MeV to a few GeV, over a field of view in excess of 2 steradian, ten years after the demise of the EGRET experiment onboard the Compton Gamma Ray Observatory. Several classes of celestial sources are known to emit gamma-rays in this energy band, most notably rotation powered pulsars, active galactic nuclei (especially blazars), supernova remnants and, occasionally, gamma-ray bursts. Other types of sources, such as galactic microquasars, low and high mass X-ray binaries or magnetars were expected to possibly emit gamma-rays in some special conditions (e.g., from shocks in the jet or in the accretion flow), but none of them had been unambiguously classified as a gamma ray source prior to the recent observations by AGILE or Fermi-GLAST (with the exception of the debated cases of LS 5039 and LSI +61 303).
The SuperAGILE experiment was designed to guarantee the hard X-ray (18-60 keV) monitoring in the tens of mCrab sensitivity range of the central steradian of the GRID field of view, aiming at identifying in the hard X-rays sources and/or conditions of special interest to the GRID, providing accurate (arcmin) localizations and allowing for multi-band observations. In addition to that, SuperAGILE independently acts as a wide field monitor for bright galactic sources, with photon by photon transmission and 5-s time accuracy.
A detailed description of the SuperAGILE experiment (pre-flight) may be found in Feroci et al. (2007), while information about the early in-flight operation and technical performance may be found in Feroci et al. (2008). Here we summarize the main instrument properties relevant to the aim of the present paper, that is providing an overview of the main scientific results achieved by the experiment during the first 20 months of observations from space, as well as guidelines and limits for a proper scientific use of the SuperAGILE data.
SuperAGILE is a coded-mask experiment devoted to image the transient hard X-ray sky by means of a set of four one-dimensional Silicon microstrip detectors, encoding the sky in two orthogonal directions. The field of view (FOV) of each pair of detectors is rectangular, 107∘ x 68∘ at zero response (Fig. 1). Thus, the central 68∘ x 68∘ region is encoded in both directions (2 x 1D), while the peripheral 20∘ of the FOV are coded in one dimension only. Due to severe limitations at design and operation level (see Feroci et al. 2007, 2008a), SuperAGILE operates in the non-optimal (for a Silicon detector) energy range from 18 to 60 keV, being noise-limited at the low energy bound and efficiency limited at the upper bound, and behind a 5 mm thick shield of plastic scintillator (part of the AGILE ACS). The energy resolution is 8 keV Full Width at Half Maximum, energy-independent. The one-dimensional point spread function (PSF) is 6 arcmin on-axis and the point source location accuracy reaches 1-2 arcmin for detections above 10, including a 1 arcmin systematics contribution from the AGILE satellite attitude reconstruction. The SuperAGILE on axis 5- sensitivity is 20 mCrab for a 50 ks net exposure (independently in each direction, that is half of the area of the experiment). Due to the triangular response of the collimator, the FOV at half sensitivity with 2 x 1D imaging is approximately 30∘ x 30∘. Instead, in each direction the sensitivity is better than 100 mCrab (5, 50 ks, two detectors only) within the central 40∘ x 80∘ region (see Fig.1). The on-axis effective area is 250 cm2 (total of 4 detectors, at 20 keV). The experiment background is dominated by the diffuse X-rays. Particle induced background is largely discriminated in amplitude and by the anticoincidence logic with the ACS, that actually causes a large dead-time effect when crossing the south atlantic anomaly, preventing in practice scientific observations in this orbital phase (see, e.g., Feroci et al. 2008a).

The SuperAGILE experiment entered its nominal observing phase on mid-July 2007, after the successful completion of its Commissioning Phase. Due to the inaccessibility of the Crab Nebula in June, caused by the Sun constraints of the spacecraft, the first light of the experiment was taken on the Vela region, with the detection of the galactic binary system GX 301-2. Between July and October 2007 the experiment was calibrated in flight, using the Crab Nebula to scan several positions in the FOV, as a part of its Science Verification Phase. The latter was completed by the end of November 2007 with the observation of the Vela field, the Galactic Center and the Cygnus region. On December 2007 the AGILE Observing Cycle 1 started, with typical continuous exposures of 4 weeks to the same field. Contrary to those of the GRID, the SuperAGILE data of Cycle 1 are not open to Guest Observers. However, light curves of the sources detected by SuperAGILE are in public distribution in nearly realtime through a web page (see ).
In the following sections we will describe the scientific data products of SuperAGILE ( 2), review the status of experiment calibration and pointing strategy ( 3 and 4), and overview the main scientific observations carried out over the first 20 months of nominal operations in orbit ( 5), including a preliminary list of the detected sources.
2 The SuperAGILE data analysis and scientific products
The SuperAGILE experiment (hereafter SA) transmits photon-by-photon data to the AGILE telemetry and then to ground. For each detected event information is available about its time of arrival (with 2s resolution and 5s absolute accuracy), energy (64 channels, formally between 0 and 90 keV) and position on the detectors (strip address between 1 and 6144, including the detector information).
The SA telemetry is downloaded from the spacecraft to the ground station in Malindi (Kenya) once per orbit (approximately 100 minutes long). It is then transmitted to the Telespazio Fucino Space Center and to the ASI Science Data Center in Frascati, where it is both locally processed and transmitted to the SuperAGILE Team in Rome (see Trifoglio et al. 2008 for a detailed description of the AGILE data flow and processing). An automatic data processing pipeline, SASOA (Lazzarotto et al. 2008, 2009), extracts high-level products and scientific information from the SA data. One dimensional images of the sky in each of the two SA coordinates are created using the data of the entire orbit. This is aimed to derive an unbiased ”picture” of the hard X-ray sky in the experiment field of view, during that orbit. The results of this analysis are automatically stored in a database, from where orbital light curves of the sources positively detected can be retrieved over the entire mission lifetime. The same procedure runs automatically on a daily timescale, with the same approach.
Refined analysis can be performed by the user on sources of interest. It consists in running the same procedures mentioned above, but applying specific time and/or coordinates and/or energy selections. For individual sources optimized results are obtained, for example, by selecting the SA data on the time periods when the source of interest was properly exposed. To these, further time and energy selections can be applied, resulting in energy-selected light curves of the source. Energy spectra can also be obtained by running the imaging procedure iteratively on pre-determined energy bins, and extracting for each of them the source intensity from the combined images in the X and Z detectors. The results are then stored in a standard fits pha file, to be used in the XSPEC spectral analysis package, together with the proper instrument response matrix. The latter is accumulated for each pair of detectors (X and Z). The response matrix is dependent on the source position in the FOV and it is then computed for every specific spectrum.
A crucial step in the SA scientific analysis is the attitude correction. In fact, the one-dimensional SuperAGILE images are severely affected by the satellite attitude variations, as large as 0.1∘/s, meaning that the satellite pointing direction varies by an amount equal to the SA angular resolution every second. This is not similarly critical for the GRID, that has full 2D imaging capability and an angular resolution in the range of 4∘. The detected position of every SA event needs to be corrected to its expected location using the attitude information from the AGILE star sensors, available in telemetry with a 10 Hz frequency and a 1 arcmin accuracy, on each of the three satellite axes.
In a coded mask experiment, the attitude correction of an individual photon must make an assumption on its incoming direction. Unlike one would intuitively expect for a one-dimensional imager like SA, the one-dimensional shift compensating an attitude variation depends not only on the projection of the source position along the coding direction, but also along its non-coding direction. In practice, the attitude variation provides an additional encoding to the photons, also in the direction where the detector has no imaging capabilities. This implies that the a-priori assumptions on the incoming direction of the photon (and the attitude correction thereof) and the search for point sources in the FOV must be done in a two-dimensional space, instead of the more ”natural” one-dimension. One of the two directions (”coding”) has a resolution of 3 arcminutes, as determined by the size of the sky pixel of the experiment. The second one (”non-coding”) has a resolution (hereafter ”zone”) determined by a trade-off between the sensitivity of the SA point spread function to the attitude variation and the processing time. In the current version of the SA scientific software, the angular size of a non-coding zone is set to 4∘ (2∘). A positive consequence is that each SA detector becomes a two-dimensional imager, but at the expenses of the signal-to-noise ratio. We show this effect in Fig. 2, where a mask-deconvolved image (”sky image”) is presented for a field including three sources. In the coding direction the source position shows up as a sharp peak (PSF-wide), while in the non-coding direction the true position corresponds to a broad but still identifiable peak (as a function of the ”zone”, in the attitude correction algorithm). In the SA data processing, a catalogued source identification is then done by requesting that the SA measured position lies within 3 arcmin in the coding direction, and within 1 zone (i.e., 4∘) in the non coding direction.

The software package implementing this imaging procedure, named EMI (Enhanced Multi sky Imaging), is applied to the one-dimensional sky images obtained by co-adding data from homologous detectors (i.e, the two pairs of detectors encoding the X and Z directions) to detect, localize and identify the significant sources in the field, independently in both coordinates. The source flux is derived by integrating the peak counts over a PSF width and then normalizing them to the net source exposure (that is, excluding the times when the source was occulted by the Earth or the satellite was passing through the South Atlantic Anomaly) and to the effective area at the relevant FOV position. The resulting normalized intensity, in units of counts cm-2 s-1, is a measurement of the source flux and it is then independent of the source position in the FOV.
The EMI procedure is able to detect and iteratively subtract the source peaks, in order to identify weaker sources, but in doing this it does not simulate the instrument response to the source and it is then not suited for the subtraction of the coding noise due to the partial coding of the detected sources (the whole SuperAGILE field of view is indeed only partially coded, except for the on-axis direction). To this purpose a dedicated IROS-like (Iterative Removal Of Sources) procedure was developed, fitting the complete imaging response to a detected source, in order to iteratively subtract it from the image and search for the subsequent, dimmer source. Compared to similar packages for past experiments, the IROS procedure for SA must be able to account for its several departures from ideality, that make its operation far more complex than usual. The attitude variations of the AGILE spacecraft amount to one SuperAGILE PSF every second (0.1∘/s), within a range of 1∘ (40 times the 1.5 arcminutes SA point source location accuracy, see next section). The electronic noise in the front-end electronics is large due to the high operative temperature (always in the range 25-30∘C) and it is variable due to the large temperature variations (3-5∘C) along the orbit. The electronic noise critically affects the imaging capabilities for signal amplitudes near the low energy threshold (see Pacciani et al. 2008a for an extensive discussion). All these effects, also combined with the one-dimensional imaging capability of the experiment, cause significant instabilities to the simulation of the observed sky by the IROS procedure. Due to these intrinsic difficulties, all the above experiment characteristics had to be studied and understood from the flight data, and modelled in the software. This data analysis package, named EMIROS, is now near completion and it will be used to improve the current imaging sensitivity of the experiment.
The analysis presented in this paper is based on the EMI data processing only, and this implies that it has a limiting sensitivity worse than the intrinsic experiment potential. The coding noise of strong sources in the image in some cases affects the flux estimate of the weaker sources, and this is taken into account by adding a systematic uncertainty. This issue is discussed in the next section.
3 Status of Experiment Calibration
The SuperAGILE experiment was calibrated on ground at different stages of its integration, from the ”naked” silicon detectors up to the full experiment inside the spacecraft in flight configuration. Having a very good angular resolution (6 arcmin) over a large field of view (1 steradian), but a poor energy resolution (8 keV, full width at half maximum) over a narrow bandpass (18-60 keV), SuperAGILE acts mostly as an X-ray imager. For this reason, most of the calibration and software efforts were devoted to its imaging properties and to the calibration of the integrated effective area.
The wide field of view of the experiment was scanned with radioactive sources of different energies during the ground calibrations. Similarly, in orbit a series of 25 1-day pointings at the beginning of the mission were devoted to observe the Crab Nebula in different positions of the FOV. They were used to verify and refine the results of the on-ground calibrations, in terms of point source location accuracy and effective area, as a function of the source position in the FOV. An onboard electronic circuit allows to monitor and verify periodically the stability of the gain and linearity of the experiment. A detailed description of the on-ground and in-flight calibrations, their analysis, results and estimation of the systematic effects may be found in Donnarumma et al. (2006), Evangelista et al. (2006), and Feroci et al. (2008). Here we summarize those results most relevant to the data interpretation.
Due to the mentioned time/temperature-dependent threshold effects combined with the poor energy resolution (see Pacciani et al. 2008a for details), the energy range between 17 and 20 keV is very difficult to calibrate accurately, yet it is an important one, due to the effects of the Silicon quantum efficiency and the energy spectra of cosmic sources, both favored by a low energy response. This energy range is then used only when the short-term signal-to-noise ratio is high enough to permit to neglect the threshold effects, on timescales shorter than the typical temperature variations. This is usually achieved on short-timescale transients, like gamma ray bursts or type I X-ray bursts, while for longer integrations on the persistent emission of steady sources we chose to limit our analysis to energies above 20 keV.
The point source location accuracy (PSLA) was verified in flight with the detection of tens of known sources (see 5.1 and 5.5)). By using hundreds of detections in different positions of the field of view, the PSLA was determined as 1.5 arcmin (90% containment radius) for detections with statistical significance higher than 10 . A large systematic contribution (1 arcmin) derives from the knowledge of the true satellite attitude. In principle, one could expect a contribution to the PSLA also by the angular extension of the Crab Nebula, observed as 1-2 arcminutes below 10 keV. The contribution of such an extension can be quantitatively neglected when the 6-arcmin point spread function of SA is considered. We verified that also the determination of the PSLA provides consistent results both using the localizations of the Crab Nebula only, and the localization of the other known sources (see 5.1), thus suggesting a low surface brightness of the outer regions of the Crab Nebula with the SA bandpass.
The source flux reconstruction is still significantly affected by the systematics induced by a non perfect calibration of the threshold and thermal-noise effects of the individual channels, as well as by coding noise effects when a strong source (in terms of detected counts) is in the field. Based on the mask design, the amplitude of the coding noise induced by a source in other positions of the FOV is expected to be at most 8% of its peak flux.
Using the raster scan of the experiment field of view with the Crab Nebula we were also able to study the systematics of the source flux determination in the different positions of the FOV, for the case of one only or dominant source in the field. We selected positions in the SA field of view where the exposed area is at least 20% of the on-axis value on at least one of the two directions (X or Z). Through the automatic orbital analysis, we then used the Crab observations to estimate the systematic uncertainty in the source flux determination. A set of 500 orbital detections of Crab were found to satisfy the above criterium, and they provide a (statistically) constant Crab value in the 20-60 keV energy range of 0.1511 counts cm-2 s-1, provided that a systematic uncertainty equal to 8% of the source counts is added in quadrature to the statistical uncertainty of the individual measurement. In Fig. 3 we show, as examples, three 1-week stretches of orbital Crab detections, in three different positions in the field of view, demonstrating the source flux stability to within the quoted uncertainties.
The calibration of the orbital determination of the source flux was also successfully tested by comparing the simultaneous observations of variable sources with SA and Swift/BAT, using the publicly available BAT lightcurves111http://swift.gsfc.nasa.gov/docs/swift/results/transients/ in nearly the same energy range (BAT reports the 15-50 keV energy range). The calibration of this type of data is particularly relevant to the use of the SA orbital light curves of sources in public distribution (see 6).

4 The AGILE Pointing Strategy and the SuperAGILE sky coverage
The AGILE satellite has fixed solar panels and the spacecraft attitude control system requires the solar panels oriented to the Sun direction to within 1∘ at any time. Therefore, the allowed range of pointing directions satisfying the Sun constraint is included in a 2∘ wide circle, centered at 90∘ from the Sun, and it drifts by 1∘ per day in order to keep the constraint always satisfied. This odd condition is less critical for the AGILE scientific payload than it would be in other cases, thanks to very large field of view of the GRID and SA experiments.
From the scientific point of view, the primary experiment onboard the AGILE mission is the GRID and the optimization of its observing program is the driver for the pointing strategy of the AGILE mission (e.g., Pittori et al. 2009). The effective field of view of the GRID is significantly wider (by almost a factor of 2) than that of SuperAGILE, posing looser pointing constraints to reach a reasonably uniform coverage of the sky. As a result, the integrated SuperAGILE exposure map after the period July 2007 - April 2009 is largely non-uniform, and it mostly tracks the average AGILE boresight position history. In Table 1 we list the sky regions at which the AGILE mission pointed during the first 2 years. Updated AGILE pointing information for both past and future observations may be obtained at the web site of the AGILE Data Center (), part of the ASI Science Data Center (ASDC).
| Sky Region | Date Start | Date Stop | RA | Dec |
|---|---|---|---|---|
| Vela Field | 2007-07-13 | 2007-07-24 | 158.0 | -60.2 |
| 2007-07-30 | 2007-08-01 | 150.8 | -70.2 | |
| 2007-08-02 | 2007-08-12 | 176.0 | -66.1 | |
| 2007-08-13 | 2007-08-22 | 195.6 | -66.6 | |
| 2007-08-23 | 2007-08-27 | 217.0 | -64.4 | |
| 2008-01-08 | 2008-02-01 | 147.0 | -62.5 | |
| Galactic Anti-center | 2007-08-01 | 2007-08-02 | 37.1 | 12.7 |
| 2007-08-12 | 2007-08-13 | 47.4 | 16.1 | |
| 2007-08-22 | 2007-08-23 | 57.1 | 18.6 | |
| 2007-09-01 | 2007-09-04 | 68.1 | 20.6 (*) | |
| 2007-09-12 | 2007-09-13 | 78.5 | 21.7 | |
| 2007-09-15 | 2007-10-13 | 92.3 | 21.9 (*) | |
| 2007-10-22 | 2007-10-23 | 120.5 | 18.9 | |
| 2007-11-01 | 2007-11-02 | 130.6 | 16.3 | |
| 2008-03-30 | 2007-04-10 | 107.8 | 26.7 (*) | |
| 2009-03-31 | 2009-04-07 | 102.7 | 31.7 | |
| Galactic Center | 2007-08-27 | 2007-08-27 | 236.6 | -41.9 |
| 2007-10-13 | 2007-10-22 | 290.9 | -18.9 | |
| 2007-10-23 | 2007-10-24 | 301.2 | -17.1 | |
| 2008-03-01 | 2008-03-30 | 254.7 | -39.8 | |
| 2008-09-10 | 2008-10-10 | 256.5 | -28.5 | |
| 2009-02-28 | 2009-03-25 | 247.0 | -29.0 | |
| 2009-03-25 | 2009-03-31 | 275.7 | -30.5 | |
| Cygnus Field | 2007-11-02 | 2007-12-01 | 296.9 | 34.5 |
| 2007-12-01 | 2007-12-16 | 315.0 | 45.0 | |
| 2008-05-10 | 2008-06-09 | 304.3 | 36.0 | |
| 2008-06-15 | 2008-06-30 | 323.2 | 50.1 | |
| 2008-10-31 | 2008-11-30 | 295.5 | 35.6 | |
| 2008-11-30 | 2009-01-12 | 327.7 | 49.0 | |
| 2009-01-19 | 2009-02-28 | 325.7 | 68.1 | |
| Musca Field | 2008-02-14 | 2008-03-01 | 191.9 | -71.9 |
| 2008-08-15 | 2008-08-31 | 175.3 | -74.1 | |
| Aquila Field | 2008-10-17 | 2008-10-31 | 291.0 | 10.1 |
| 2009-04-07 | 2009-04-30 | 289.9 | -1.6 | |
| Antlia Field | 2008-06-30 | 2008-07-25 | 161.8 | -47.7 |
| Vulpecula Field | 2008-04-10 | 2008-04-30 | 286.3 | 20.8 |
| Virgo Region | 2007-12-16 | 2008-01-08 | 173.4 | -0.4 |
| ”Field 8” | 2007-09-04 | 2007-09-12 | 51.4 | 71.0 |
| 2007-09-13 | 2007-09-15 | 74.9 | 58.3 | |
| North Galactic Pole | 2008-04-30 | 2008-05-10 | 250.1 | 72.5 |
| South Galactic Pole | 2008-02-01 | 2008-02-09 | 58.3 | -37.8 |
| 2008-02-12 | 2008-02-14 | 65.7 | -35.7 | |
| ToO W Comae | 2008-06-09 | 2008-06-15 | 182.3 | 29.6 |
| ToO S50716+714 | 2007-10-24 | 2007-11-01 | 155.5 | 67.4 (*) |
| ToO Mkn 421 | 2008-02-09 | 2008-02-12 | 251.0 | 50.3 |
| ToO 3C454.3 | 2007-07-24 | 2007-07-30 | 17.8 | 36.7 |
| 2008-07-25 | 2008-08-15 | 22.3 | 39.1 | |
| ToO SGR0501+4516 | 2008-08-31 | 2008-09-10 | 61.9 | 44.1 |
| ToO PKS0537-441 | 2008-10-10 | 2008-10-17 | 98.8 | -46.8 |
| ToO Carina Field | 2009-01-12 | 2009-01-19 | 161.7 | -59.9 |
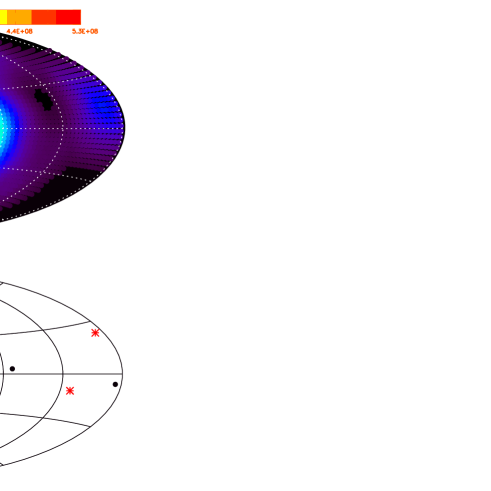
Taking into account the SA effective area as a function of the off-axis angle, we can then derive the exposure map, that is the cumulative distribution of the product of the net exposure time and the effective area, in units of cm2 s, as shown in Figure 4 (top panel). The false-color exposure map in Galactic coordinates clearly shows the effect of the AGILE long exposures to the Vela and Cygnus regions, that are favored not only by the presence of several scientific and calibration targets for the GRID experiment, but also by the Sun constraints. Relatively deep exposures were also obtained to the Galactic Center and anti-Center regions (the latter due to the presence of the Crab Nebula), and to the Virgo region, where a coordinated multi-frequency campaign was spent (see Pacciani et al., 2009).
5 Science with SuperAGILE
The characteristics of the SuperAGILE experiment make it suited for the detection of bright transients and the extended monitoring of bright Galactic sources. The one-dimensional imaging, the spacecraft attitude control system and constraints make it not well suited for very long integrations (i.e., longer than 1 week). However, thanks to its large field of view, SuperAGILE is able to provide month-long continuous light curves for several sources at the same time, with bin sizes from minutes to days, depending on the source intensity and position in the field of view. For bright sources timing and spectral analysis can also be carried out using the photon-by-photon data. In addition to the persistent sources, SA typically detects and localizes one gamma ray burst per month, as well as other Galactic or extragalactic transients.
In the following sections we report about the sources for which flux measurements with SA are available so far and provide some details about specific noticeable regions in the sky, as case-studies useful to illustrate the results of both automated and manual analysis of the SA data. Deeper analysis and interpretation for a few specific sources is the subject of separate papers, as in the case of Mkn 421 (Donnarumma et al. 2009a) or 3C 273 (Pacciani et al. 2009), as well as the gamma-ray bursts (Del Monte et al. 2008a).
5.1 Detected sources
During its first 20 months of observations, obtained between mid-July 2007 and end-April 2009 with the satellite 94% of time in nominal pointing and the experiment in nominal configuration, SuperAGILE observed the sky with significantly different exposure to various regions. The typical pointing strategy of the AGILE mission is to have month-long observations of the same field, with the Sun constraints imposing a drift of the observed field by approximately 1∘ per day. During this period SuperAGILE was able to monitor a few tens of sources, typically brighter than 30-40 mCrab.
Table 2 summarizes the current status of the SA source detections. The results reported in the table derive mostly from the automated daily integrations (i.e., 40ks net exposure each). In some other cases, specified in the ”Timescale” column, the reported source was detected through its transient emission, measured by means of a dedicated analysis (e.g., Galactic transients). For each source it is specified whether it was also detected by the automated analysis on the orbital timescale, implying that flux measurements for it are publicly available at the ASDC website. We note that the Table 2 is not intended as a catalog. In fact, the analysis that provided such results was not carried out homogeneously and systematically over the full data archive, and it was not optimized for the source detection (see Sect. 2). In addition, shorter and longer integration times were not systematically explored. A complete re-analysis of the full SA data archive is planned with the final EMIROS software package. A complete SA source catalog will be then subject of a future publication, where a more homogeneous and complete analysis of the SA data archive will be reported.
The columns in the table report, for each source, after the name: the celestial coordinates, the average flux measured by SA in the 20-60 keV, the total exposure time, the maximum significance of the individual SA measurements (typically on daily timescale), the source type, the availability of orbital measurement data, and a column for any notes required by that specific source. It is important to note that the Average Flux column in the table provides the source flux measurements obtained by positive detections only (i.e., above 4 within a region of the SA field of view exposing no less than 20% of the on-axis effective area, even if in only one of the two SA coordinates). As such, these numbers are biased upward. Therefore, these flux measurements are not to be taken as an average flux level of individual sources over the 2007-2009 time interval. Similarly, we note that the results of the automated orbital analysis (see 6), also reporting positive detections only, are even more biased upward, due to the lower sensitivity of the experiment on such a shorter time scale. Thus, the average flux measurement in the orbital analysis is expected to be systematically higher than in the daily integrations (except for bright sources), because it selects the times when the source shows a flux higher than the SA orbital sensitivity. The exposure time column is meant to provide the reader with a general information on how long a specific source has been at a flux level detectable by SuperAGILE during its visibility periods. It is computed by adding up the integrations when the source was positively detected, filtering out the time when the source was occulted by the Earth and when the satellite was passing through the South Atlantic Anomaly.
| Name11footnotemark: 1 | RA | Dec | Average Detected Flux | Total Exposure | Max. Sign. | Type | Orbital | Note |
|---|---|---|---|---|---|---|---|---|
| (deg) | (deg) | (mCrab) | (ks) | () | Data | |||
| SMC X-1 | 19.271 | -73.443 | 87 | 140 | 4.4 | HMXB | N | |
| 1A 0114+650 | 19.511 | 65.292 | 13 | 380 | 5.9 | HMXB | N | 5-h flare |
| X Per | 58.846 | 31.045 | 55 | 45 | 4.5 | HMXB | Y | |
| SGR 0501+4516 | 75.278 | 45.276 | - | - | - | SGR | N | Short bursts |
| LMC X-4 | 83.207 | -66.370 | 50 | 400 | 10.1 | HMXB | N | |
| Crab | 83.628 | 22.020 | 1000 | 2477 | 76.4 | PWN | Y | |
| Vela X-1 | 135.512 | -40.557 | 603 | 1523 | 47.6 | HMXB | Y | |
| GRO J1008-57 | 152.441 | -58.291 | 56 | 220 | 6.0 | HMXB | N | |
| Mkn 421 | 166.114 | 38.209 | 40 | 140 | 9.4 | BL | N | |
| 1A 1118-61 | 170.238 | -61.917 | 475 | 447 | 47.6 | HMXB | Y | |
| Cen X-3 | 170.300 | -60.638 | 173 | 1859 | 21.3 | HMXB | Y | |
| 1E 1145.1-6141 | 176.869 | -61.953 | 44 | 1010 | 9.4 | HMXB | Y | |
| NGC 4151 | 182.636 | 39.405 | 17 | 115 | 6.9 | Sy | N | |
| GX 301-2 | 186.657 | -62.770 | 390 | 3315 | 129.9 | HMXB | Y | |
| 3C 273 | 187.278 | 2.052 | 24 | 740 | 21.3 | QSO | N | |
| Cen A | 201.365 | -43.019 | 60 | 200 | 6.6 | RG | Y | |
| 1E1547.0-5408 | 237.725 | -54.307 | - | - | - | AXP | N | Short bursts |
| 4U 1608-522 | 243.179 | -52.423 | 126 | 130 | 8.22 | LMXB | Y | |
| Sco X-1 | 244.979 | -15.640 | 1666 | 3594 | 103.0 | LMXB | Y | |
| 4U 1624-490 | 247.011 | -49.198 | 139 | 8 | 4.6 | LMXB | N | |
| IGR J16318-4848 | 247.966 | -48.808 | 165 | 360 | 22.6 | HMXB | Y | |
| 4U 1626-67 | 248.070 | -67.461 | 53 | 2600 | 11.7 | LMXB | Y | |
| 4U 1636-536 | 250.231 | -53.751 | 68 | 380 | 8.5 | LMXB | Y | |
| GX 340+0 | 251.448 | -45.611 | 85 | 908 | 18.5 | LMXB | Y | |
| Her X-1 | 254.458 | 35.342 | 200 | 122 | 5.3 | HMXB | N | |
| OAO 1657-415 | 255.199 | -41.673 | 96 | 530 | 27.1 | HMXB | Y | |
| GX 339-4 | 255.706 | -48.789 | 105 | 868 | 11.3 | LMXB | Y | |
| 4U 1700-377 | 255.986 | -37.844 | 357 | 1179 | 35.8 | HMXB | Y | |
| GX 349+2 | 256.435 | -36.423 | 117 | 3110 | 21.4 | LMXB | Y | |
| 4U 1702-429 | 256.563 | -43.035 | 63 | 561 | 10.8 | LMXB | Y | |
| 4U 1705-440 | 257.226 | -44.102 | 78 | 805 | 14.5 | LMXB | Y | |
| GX 354-0 | 262.989 | -33.834 | 61 | 1977 | 18.6 | LMXB | Y | |
| GX 1+4 | 263.009 | -24.745 | 64 | 805 | 7.8 | LMXB | Y | |
| 4U 1735-444 | 264.742 | -44.450 | 47 | 272 | 11.8 | LMXB | N | |
| 1E1740.7-2942 | 265.978 | -29.745 | 47 | 1251 | 11.2 | LMXB | Y | |
| IGR J17464-3213 | 266.565 | -32.233 | 134 | 536 | 23.1 | LMXB | Y | |
| IGR J17473-2721 | 266.825 | -27.344 | 37 | 129 | 5.3 | LMXB | N | X-ray burst |
| GX 3+1 | 266.983 | -26.563 | 40 | 276 | 10.0 | LMXB | Y | |
| AX J1749.1-2639 | 267.300 | -26.647 | 196 | 1097 | 37.2 | HMXB | Y | |
| SAX J1750.8-2900 | 267.600 | -29.038 | 67 | 137 | 21.8 | LMXB | N | X-ray burst |
| SWIFTJ1753.5-0127 | 268.368 | -1.453 | 116 | 158 | 6.0 | LMXB | N | |
| GX 5-1 | 270.284 | -25.079 | 137 | 2621 | 33.4 | LMXB | Y | |
| GRS 1758-258 | 270.301 | -25.743 | 100 | 791 | 28.2 | LMXB | N | |
| GX 9+1 | 270.385 | -20.529 | 50 | 1260 | 8.4 | LMXB | N | |
| SAX J1808.4-3658 | 272.115 | -36.979 | - | - | - | LMXB | N | X-ray burst |
| SGR 1806-20 | 272.164 | -20.411 | - | - | - | SGR | N | Short bursts |
| SAX J1810.8-2609 | 272.685 | -26.150 | 35 | 376 | 8.4 | LMXB | Y | |
| GX 13+1 | 273.631 | -17.157 | 46 | 371 | 5.5 | LMXB | Y | |
| 1M 1812-121 | 273.800 | -12.083 | 45 | 708 | 7.8 | LMXB | Y | |
| GX 17+2 | 274.006 | -14.036 | 122 | 2705 | 22.4 | LMXB | Y | |
| 4U 1820-303 | 275.919 | -30.361 | 80 | 3099 | 26.6 | LMXB | Y | |
| 3A 1822-371 | 276.445 | -37.105 | 53 | 1016 | 7.9 | LMXB | Y | |
| Ginga 1826-24 | 277.367 | -23.796 | 84 | 3316 | 17.3 | LMXB | Y | |
| Ginga 1843+009 | 281.412 | 0.891 | 95 | 125 | 5.2 | HMXB | N | |
| HETE J1900.1-2455 | 285.036 | -24.920 | 60 | 210 | 7.6 | LMXB | Y | |
| GRS 1915+105 | 288.798 | 10.946 | 347 | 4361 | 66.8 | LMXB | Y | |
| 4U 1954+31 | 298.926 | 32.097 | 64 | 279 | 13.8 | LMXB | Y | |
| Cyg X-1 | 299.590 | 35.202 | 714 | 7923 | 161.4 | HMXB | Y | |
| EXO 2030+375 | 308.063 | 37.638 | 92 | 1976 | 28.7 | HMXB | Y | |
| Cyg X-3 | 308.107 | 40.958 | 165 | 6290 | 32.8 | HMXB | Y | |
| Cyg X-2 | 326.172 | 38.322 | 59 | 3793 | 16.1 | LMXB | Y |
5.2 The Vela region
In this and in the next section we show analysis of two significant fields observed by SuperAGILE, representing conditions with a few and many sources, the Vela region and the Galactic Center. We use them as case studies to describe and explain the typical results of the scientific analysis of the SuperAGILE data in two different conditions.
In Fig. 5 we provide the set of two one dimensional sky images obtained by a one-day integration centered at RA=149.31, Dec=-62.95 (J2000, corresponding to galactic coordinates l=284.55, b=-6.48) on 10th January 2008. The abscissae report the angular off-set with respect to the center of the SA field of view, in the X and Z coordinates of the SA reference frame (+Z aims at the Sun, +Y is the pointing direction). The bin size is the SA pixel, corresponding to 3 arcminutes at the center of the field of view. The ordinates show the counts per bin for the sum of the two detectors encoding the same direction (X or Z), after a deconvolution with the mask code. With reference to the ”two dimensional encoding” caused by the spacecraft attitude variations (see 2), the most appropriate representation of a SA sky image, for each of the X and Z coordinates, would be two-dimensional, similar to Fig. 2, where the proper attitude correction is applied to every region in the field of view. However, for the sake of clarity we chose to have one dimensional images, displaying the on-axis non-coding zone for every sky bin (i.e., X=0 for the Z image, and vice versa), except for those where a source is detected, for which the relevant non-coding zone correction is shown, in order to image the detected source properly. Thus, these one-dimensional images of the sky are a sort of mosaic of different non-coding zones.

The ordinates of these images report the integrated counts, for each bin. According to the shape of the SA PSF, in most of the cases the source peak in the counts image corresponds to a fraction varying between 70% and 100% of the total source counts (see Evangelista et al. 2006 for details). The estimation of the total source counts needs then to be done by proper integration over the PSF shape at the position of the source.
It is useful to notice how the amplitude of the fluctuations in Fig. 5 decreases as the off-axis angle increases. This is due to the fact that the coded imaging subtracts the background counts, but not their fluctuations. They depend on the total counts (background plus sources) in the fraction of the detector exposed to each specific off-axis angle. In other words, the on axis direction is seen by the full area of the detectors, while increasing off-axis directions are seen with decreasing fractions of it. This implies a smaller number of counts in the involved detector region, and then smaller values of their fluctuations. Consequently, in order to infer the statistical significance of any peak in the image, the counts in the peak must be compared to the value of the background fluctuations (e.g., ) at that specific position in the field of view.
The one-day integration on the Vela field taken on MJD 54475 shows the detection of a few sources in both X and Z SA coordinates, noticeably Vela X-1, Cen X-3 and GX 301-2, here with an estimated average flux of about 380, 130 and 195 mCrab, respectively. The detection significance is 14, 22 and 21 on the X coordinate image, and 27, 17 and 19 on the Z coordinate, respectively. The net exposure to each of the sources in this image is 46, 56 and 59 ks, respectively. It is worth noticing the wide angular separation between the sources, up to 40∘ .
When looking at the SA images of the sky it is important to remind how the angular response of the experiment works (see Feroci et al. 2007 for details). The SA FOV is defined by a collimator that causes a linear decrease of the effective area from the center of the field to the edge. The shape of the FOV is rectangular (see Fig.1) and it is narrower in the non-coding direction, implying that the effective area decreases more rapidly if a source ”moves” from the center to the edge of the FOV along the non-coding direction than along the coding one. Since the peaks in the SA images are in counts, the shape of the collimator response makes the peak value for a given source strongly dependent on its position in the FOV. This effect explains why the same two sources, observed simultaneously, may show peaks of very different relative heights in the X and Z images, being dependent on their relative positions in the X and Z SuperAGILE coordinates. An example of this effect is given by Cen X-3 and Vela X-1 in Fig. 5: the peak of Vela X-1 is higher in the Z image than in the X because in the latter it lies at a position with smaller effective area. The reverse applies to Cen X-3. This SA property also clarifies why the source LMC X-4 is significantly detected only in the X image. The source is at an expected position in the SA reference frame of (X,Z)=(-27.14, -0.87) degrees. At this position the exposed area in the Z detectors (for which the non-coding position is 27∘ off-axis) is insufficient for a source detection, while in the X detectors it is detected at 10 , with a flux of 70 mCrab.
Given the high detection significance of the sources in the daily image integration, light curves can be obtained with finer time resolution. In Fig. 6 we show the light curve of the same sources, obtained by the automated orbital analysis, over a time span including MJD 54475, with a bin size corresponding to the SA orbital time scale (6 ks elapsed time). The plot shows the average flux measurement obtained by SuperAGILE at each AGILE orbit, with a net exposure to each of the sources of about 3-4000 s. We note that, at variance with the images, in the light curves the source counts are normalized and directly represent flux values (under the assumption of a Crab-like energy spectrum). When the source is not detected the 3- upper limit at the position of the source is provided. It is interesting to note, for example, how the half-day binary eclipse is nicely detected in the light curve of Cen X-3, every 2.1 days.

Thanks to the photon-by-photon data always transmitted to the ground (see 2), a more detailed analysis can be carried out on individual sources, provided the data have good enough statistical quality. As an example, for the three X-ray binary pulsars in the Vela field for which we provided images and light curves above, SuperAGILE was able to detect their spin periodicity and obtain their pulse profile by period folding. In Fig. 7 we show the folded light curves at the periods 283 s for Vela X-1, 680 s for GX 301-2 and 4.8 s for Cen X-3 (the folding epoch is arbitrary).

5.3 The Galactic Center
The Galactic Center region is the field most rich of sources for any X-ray experiment. A number of bright sources are concentrated within the central 10-20∘ of our Galaxy, mostly neutron star and black-hole X-ray binaries, and every look at this region offers a different picture, due to their large variability. For SuperAGILE this field is also very complex, due to the one-dimensional encoding of the sky, leading to source confusion in some conditions. This is made even more difficult due to the large field of view of SA, that often includes Sco X-1, the brightest X-ray source in the sky, despite its galactic latitude. Images taken by SA from this region of the Galaxy need to be analyzed very carefully, especially when Sco X-1 is in the field of view, due to the higher fluctuations and coding noise it induces.
The Galactic Center region was observed 5 times in 2007-2008 (see Table 1): two short observations in 2007 (August and October), two one-month pointings in 2008 (March and September) and in March 2009. In Fig. 8 we show a SuperAGILE image taken on October 2007 of a field centered near to the Galactic Center (boresight at l=21.430, b=-20.031) such that the position of Sco X-1 is at SA coordinates X=-6.252, Z=48.792, that is outside the field of view of the X detectors (for these detectors it has a non-coding off-set angle of 49∘, and their effective area goes to zero at 35∘ off-set)), and marginal in Z. The favorable condition of not having very bright sources in the field allowed for a 9-day long integration, corresponding to typical net exposure to the sources of about 370 ks. The X image (Fig. 8, top panel) is nearly parallel to the Galactic longitude (i.e., the Galactic plane is seen ”face-on”), and it shows several sources, as labelled in the figure: GRS 1915+105, 1M 1812-121, GX 17+2, GX 13+1, Ginga 1826-24, GX 5-1, SAX J1810.8-2609, 4U 1820-303, 3A 1822-371, and AX J1846.4-0258 and/or XTE J1855-026 (confused, being projected to X coordinates separated by less than 0.4 arcmin). These sources are all X-ray binaries in our Galaxy, and their intensity in this observation ranges from 40 to 150 mCrab.

The sources in the X image are approximately evenly distributed over the field of view, thus the balance of counts does not give rise to significant (concentrated) coding noise disturbance. Instead, the Galactic plane projection onto the SA Z coordinate is almost ”edge-on” and the sources are clustered around an off-set of 20-30 degrees (the Galactic Center is at Z 28∘). This fact, together with the bright Sco X-1 lying about 49∘ off-axis, induces significant fluctuations due to coding noise at the opposite side of the field of view, near off-set -20∘. The sources that we identified in the Z image are: Ginga 1826-24, 4U 1820-303, 3A 1822-371, GX 17+2, GX 13+1, SAX J1810.8-2609, GX 5-1, GX 354-0, GX 1+4 and Sco X-1. These sources are not all those detected in the X image, due to their different projections on the two SA coordinates. As an example the microquasar GRS 1915+105 lies at SA coordinates X=-30.607, Z=2.594, implying that it has a reasonable exposed area in X detectors (being only 2.6∘ off-axis in their non-coding direction) and a negligible area in the Z detectors (for which it lies at 30.6∘ in the non-coding direction). Thus, in the Z image we expect a far less significant peak for this source, that is indeed detected in the expected position but with a significance below our threshold. Similarly, the two sources confused in the X image, at X=-18.03, AX J1846.4-0258 and XTE J1855-026, are expected at Z=12.293 and Z=9.873 respectively. Although their coordinates do not favor a detection in the Z image, the presence of a small peak at Z=12.3 and nothing at Z=9.9 supports the identification with AX J1846.4-0258. Other weaker sources are most likely detected in these images, but they will significantly detected only after the coding noise due to the brighter sources will be subtracted with the future version of the SA data analysis software.
5.4 Galactic transients
In addition to the long term monitoring of variable sources, the wide field of view and sensitivity of SuperAGILE allow for the detection and localization of short timescale events, originating from Galactic transient sources. This is the case for the short bursts from Soft Gamma Repeaters (SGRs), with typical duration in the range of few hundreds of ms, the type I X-ray bursts from Low Mass X-ray Binaries (LMXB), in the range of tens of seconds, and the outbursts or flares from High Mass X-ray Binaries (HMXB), usually lasting from hours to days.
The relatively small fraction of time spent by AGILE pointing at the Galactic Center region (see 4 and Table 1), where these transients are more frequent, made the SA detection rather sparse. Type I X-ray bursts, having thermal energy spectra with temperatures of about 2-3 keV, are also unfavored by the band pass of SA. Type I X-ray bursts were detected by SA from IGR J17473-2721, SAX J1750.8-2900, and the millisecond pulsar SAX J1808.4-3658 (Del Monte et al. 2008b; Pacciani et al. 2008b; Del Monte et al. 2008c). The case of IGR J17473-2721 is noticeable because the single X-ray burst detected by SA was the first one ever detected from this previously unidentified source and allowed its classification as a LMXB. This was confirmed by the later activity of the source detected by other experiments: the complete outburst lasted for approximately 3 months, showed several bursts and an hard-to-soft spectral state change followed by a transition back to a hard spectral state. During the soft spectral state 900 Hz QPOs were also detected with the RossiXTE/PCA, as typical of atoll sources (Altamirano et al. 2008).
Longer outbursts were detected from several X-ray binary systems: the Compton-thick X-ray binary source IGR J16318-4848 (Pacciani et al. 2008c), the Be binary GRO J1008-57 (Evangelista et al. 2008), the HMXB 1A 1118-61, the slow spinning HMXB source 3A 0114+650 (Pacciani et al. 2009b), the neutron star transient SAX J1750.8-2900 (Pacciani et al. 2008d, see Fig. 9). The recurrent transient and black hole candidate IGR J17464-3213 was detected by SA on September 2008. An interesting state of Vela X-1 was also detected by SA on October 2008 (Soffitta et al. 2008): the source flux rose from an average 500 mCrab level up to more than 2 Crab in approximately 7 hours, before redescending to a 500 mCrab flux. The intensity of the source during the flare was such that the individual 283.5-s pulsations of the neutron star were clearly visible on the raw 16-s SA ratemeters counters. Interestingly, during the hours-long flare, shorter 100 s flares were also observed, peaking at fluxes as high as 4 Crabs.

During the last two years several magnetar sources entered new periods of intense bursting activity, namely the SGRs 1806-20, 1627-41 and 0501+4516 (actually discovered by Swift/BAT on 22nd August 2008, Barthelmy et al. 2008), as well as the Anomalous X-ray Pulsar (AXP) 1E 1547.0-5408. Unfortunately, the periods of activity of these sources generally did not coincide with the observation of their sky regions by AGILE. Thus, only a handful of short bursts were imaged by SA, originating from SGR 1806-20, 1E 1547.0-5408 and SGR 0501+4516. The latter was indeed monitored during a dedicated target of opportunity observation approximately 10 days after its discovery, from 31st August to 10th September, but the source turned out to have gone back to an almost burst-quiescent state (see, e.g., Rea et al. 2009) and only 2 short bursts were detected by SuperAGILE (Feroci et al. 2008b). Examples of short bursts from the SGR sources detected by SA are shown in Fig. 10, highlighting the time resolution achieved by the photon by photon data, basically limited by the counts statistics only. Sometimes the short bursts from these active magnetars were so bright that they were detected in the SuperAGILE rates even with the source lying well outside the experiment field of view, passing through the collimator walls or the AGILE satellite structures. This happened for a few events from SGR 1806-20, SGR 0501+4516 and 1E1547.0-5408.


5.5 Gamma Ray Bursts
Gamma ray bursts (GRBs) are among the primary scientific objectives for AGILE, being the first gamma-ray mission in operation after EGRET and in the ”afterglow era” of the GRB science. Based on what known from the EGRET experience in this field, the GRB emission in the energy range above 50 MeV is a relatively uncommon feature in ordinary GRBs (the few percent brightest bursts), and when present, the expected number of photons is such that an accurate localization in the gamma-ray range only is difficult with an experiment of 500 cm2 effective area like the AGILE/GRID, although in case of very bright events the smaller deadtime of GRID compared to EGRET would favor the collection of a higher number of photons. In order to discover the multi-wavelength GRB afterglow (e.g., soft X-rays, optical, infrared and radio), and the source distance thereof, a prompt arcmin-level localization of the GRID-detected GRBs is highly desirable. SuperAGILE is in the best position in this respect, having its field of view covering a large fraction of the AGILE/GRID one at any time.
Indeed, SA carried out this duty quite diligently. About 1 GRB/month was discovered and localized by SA, with typical error radii of 3 arcminutes (except for those 1-2 events localized at the very beginning of the mission). Most of them were followed up with the Swift X-Ray Telescope, that discovered their X-ray afterglow, thus also indirectly confirming the accuracy of the SA GRB positions. The first GRB localized by SA was already on 24 July 2007, during the AGILE Science Verification Phase. An extensive report on this event may be found in Del Monte et al. (2008a), while a description of the SA GRB triggering system may be found in Del Monte et al. (2007).
When a bright GRB illuminates the SA detectors, during its short duration it usually overwhelms the background count rate. In Fig. 11 (top panel), we show the case of one GRB, 080723B, where the peak count rate of the GRB exceeds by more than 5 times the average background rate recorded by the SA experiment. Taking into account the source-dominated condition and the fact that on such short time scale both the temperature and the satellite attitude variations become negligible, images of the event can be accumulated over the energy range from 17 to 60 keV, deriving the projections of the source position in the SA reference frame. They are shown in Fig. 11 (bottom panel) for the same event. During the GRB emission, the burst intensity typically outshines any other source in the field. In the few cases where a bright field source has an intensity comparable to that of the GRB on the same timescale, that source is usually easily identified, being among the few brightest X-ray sources in the Galaxy (e.g., Sco X-1, or Cyg X-1, …). From such images an unambiguous sky position for the GRB is derived and promptly distributed to the world wide community through the GCN coordinate distribution network ().


The case of GRB 080723B is representative of the most frequent condition in the SA GRB detection statistics. However, in some cases the event occurs in the part of the SA field of view with only one-dimensional imaging encoding. In this case the SA imaging response can only be a narrow (3 arcmin) strip in the sky, whose length depends on the geometry of the SA field of view and Earth occultation constraints. Typically, it is of the order of 10∘ or more. This can be reduced to the arcmin size by including the analysis of the delay in the arrival time of the event at the SA location and at some other long-distance spacecraft (i.e., few light-seconds), within the context of the Interplanetary Network (e.g., Hurley 2008). This was the case, for example, of GRB 080514B, that was localized by SA at X=-37.61∘, then in the 1D coding region, and the error box reduced to a 100 arcmin2 sky region thanks to a rapid triangulation with the data of the GRB detector onboard Mars Odyssey. This event was especially noticeable because it was also the first GRB detected above 25 MeV by the AGILE GRID. It was indeed the first GRB detected at high energies after EGRET, and the first ever GRB with emission above 25 MeV associated with a multi-wavelength afterglow and with a photometric red-shift z=1.8 (Giuliani et al. 2008a, Rossi et al. 2008).
5.6 Extragalactic sources
The band pass and sensitivity of SA are certainly not optimal for the study of extragalactic sources. Only a few bright AGNs were detected over the reported period though (see Table 2), with the noticeable cases of the radiogalaxy Cen A, for which several detections were obtained also on the orbital timescale, and the BL Lac source Mkn 421. The latter was serendipitously observed during a one-week AGILE target of opportunity observation toward the blazar W Comae. Mkn 421 was indeed detected in a hard X-ray flaring state, with a flux peaking at approximately 55 mCrab (Costa et al. 2008). The SA observation of the hard X-ray flaring motivated a target of opportunity observation with Swift/XRT that measured the source flux at its brightest state ever at soft X-rays. An integration over the whole week of data resulted also in a detection above 100 MeV by the AGILE/GRID. The SA and GRID data were then analyzed in a multi-frequency context, from optical to TeV energies (Donnarumma et al. 2009a).
5.7 Monitoring of AGILE GRID gamma-ray sources
The classes of persistent sources that are detectable in gamma-rays with the sensitivity of the AGILE GRID (e.g., blazars, gamma-ray pulsars, supernova remnants, …) are usually distinct from those typically detectable in hard X-rays with the sensitivity of SA (e.g., low and high mass X-ray binaries), although there are cases where this general scenario does not apply, e.g. in the reported case of Mkn 421, or the Crab pulsar (Pellizzoni et al. 2009), or the AGILE observation of the flat spectrum radio quasar 3C 373 (Pacciani et al. 2009). However, the SA data are systematically searched for hard X-ray excesses in time and space coincidence with those detected by the AGILE/GRID (and vice-versa). This resulted mostly in upper limits so far. In some cases the SA upper limits provide significant constraints to the interpretation of the gamma-ray data. As an example, the rapid and bright gamma-ray transients detected by the AGILE GRID in the Galactic plane (e.g., Longo et al. 2008; Pittori et al. 2008; Chen et al. 2008; Giuliani et al. 2008b) are unknown in origin. They were typically observed on the timescale of one day, and no contemporaneous observations are available in other energy ranges. SuperAGILE observed those sources simultaneously with the gamma-ray detections but did not find any coincident X-ray emission. The value of the upper limits depends on the source position in the SA field of view and the integration time, and ranges between 10 and 45 mCrab. The gamma-ray sources, instead, displayed emission as large as 0.5 Crab above 100 MeV.
6 Public distribution of SuperAGILE light curves
The orbital light curves of the sources detected by SA, automatically extracted by the SASOA pipeline, provide new inputs to the SA source database after processing of the latest available data following every passage of the AGILE satellite over the Malindi ground station. The orbit-averaged source fluxes in the standard 20-60 keV energy range are then made automatically and publicly available to the general community, with no restrictions. The source flux data can be accessed from the SuperAGILE web page at AGILE Data Center () for display and download purposes. Since they are the products of the automatic orbital source extraction, as we discussed in Sect. 2 the detection quality is not optimized, but it is usually good enough for the monitoring of the intensity state of bright sources. The ASDC web page is automatically updated twice a day, and the input of the new data into the public distribution is then not delayed by more than 12 hours.
Orbital flux measurements are provided for only a sub-set of the sources listed in Table 2, those for which significant detections could be obtained by the orbital analysis (identified with ”Y” in the ”Orbital Data” column of the table). The brightest sources have a frequent coverage, while weaker sources (or sources that have been only marginally observed) have only a sparse coverage. Any source can be monitored only when it is inside the SuperAGILE field of view. Thus, a source light curve available from the web is usually composed of clustered sets of measurements obtained by subsequent orbits in the observing periods, interleaved with long gaps corresponding to periods when the AGILE satellite was pointing at other regions. As an example, in the top panel of Fig. 12 we show the complete orbital data set for the bright source Sco X-1 (as available from the public web site as of April 2009), while the bottom panel shows the same data zoomed over a one-month period (September 2008). From the same web site the user can access the AGILE pointing plan to know when the source of interest was or will be in the SuperAGILE field of view.
The web page reports only the positive detections (i.e., with significance greater than 4 either on the X or Z detectors). This means that if the source flux goes below the detection limit for one orbit, this will correspond to a missing point in the light curve. This may also sometimes happen due to a very small net exposure time during a given orbit, e.g. when the source visibility (with respect to the Earth occultation) overlaps with the satellite passage through the South Atlantic Anomaly. These conditions can usually be recovered by a human-assisted analysis, optimizing the source exposure. It is worth stressing again here that being based on positive detections only, the SA light curves currently publicly available offer an intrinsically upward-biased view of the flux history of the sources, except for very bright sources (i.e., above 100-200 mCrab).

Non-positive detections and upper limits can be computed as well, typically ranging between 10 and few tens of mCrab, depending on the integration time and the source position in the field of view. They are currently not yet given in the web page due to computing time constraints, but can be provided on specific sources by the SA hardware team on request.
The automated orbital data processing applies filters to the source detections, mostly based on the exposed area to the source and the comparison of the source flux with a pre-set range, in order to guarantee the reliability of the realtime, automated source flux extraction. When a source detection is filtered out it is automatically sent as an input to the manual processing, that verifies the detection quality and reliability. In case of validation the data are injected back to the public archive as soon as the human-validated analysis is available. This implies that, in principle, the SA source flux data are always subject to improvements and refinements without notice, although this condition is rather unfrequent. The temporary filter is also used as an alert to the SuperAGILE team about special conditions of the detected sources, in some cases leading to rapid communication through, e.g., Astronomer’s Telegrams ().
It is useful to remind here that since the AGILE boresight drifts by per day, the same source will be seen by SA at different positions of the field of view (that is, potentially with a largely different effective area) even during the same pointing, having typical durations of a few weeks. A given source may thus pass in 2-3 weeks of the same pointing from being detectable to undetectable, or viceversa, not only due to its flux but also to its changing position in the experiment field of view.
The SA data accessible through the web page are currently only the results of the automatic orbital processing, described in Sect. 2. Data products deriving from analysis on different timescales, either shorter for bursts or outbursts, or longer for the weaker sources, are currently not provided. Similarly, refined source analysis are currently not provided. Work is in progress to provide in the near future additional and more refined products, starting with the daily integrations.
7 Summary and conclusions
The SuperAGILE experiment is successfully operating onboard the AGILE mission since 2007, April 23rd. In this paper we provided a description of the SA data, and reported an overview of the main scientific results achieved in the first 20 months of scientific observations. The main goals of SuperAGILE are the simultaneous hard X-ray observation of the central region of the field of view of the AGILE/GRID experiment, the prompt discovery and localization of gamma-ray bursts and Galactic transients, and the long-term monitoring of the bright Galactic sources.
The aim of the simultaneous hard X and gamma-ray observation of the same field is to discover correlated variability of sources in these two energy ranges, and use the finer angular resolution of SuperAGILE to localize gamma-ray sources detected in the GRID. This is the first time that an X-ray and a gamma-ray imager systematically observe the same field simultaneously. Regrettably, this did not bring yet to discover any previously unknown correlated behavior of sources. The sources that SuperAGILE and GRID detected simultaneously were already known to emit in both energy ranges. This is the case for the Crab pulsar, or the AGNs 3C 273 and Mkn 421. However, the guaranteed simultaneous GRID and SuperAGILE observations represent the basic seed of multifrequency campaigns, often complemented with radio to TeV observations. This led, for example, to detect a flaring state of the BL Lac source Mkn 421 and interpret the time variability of the simultaneous optical-to-TeV spectral energy distribution in terms of a rapid acceleration episode of the leptons in the jet (Donnarumma et al. 2009).
The primary goal is of course to search for positive detections in both instruments, but there are cases where also upper limits in one or the other are important to interpret the origin of the detected emission. This was the case of the unidentified transient sources discovered by the AGILE/GRID on the galactic plane, in the Cygnus and Musca regions (e.g., Longo et al. 2008; Pittori et al. 2008; Chen et al. 2008; Giuliani et al. 2008b). Following Romero & Vila (2009), the SuperAGILE upper limits on the simultaneous hard X-ray emission of these transient gamma-ray sources imply a very large ratio between the gamma-ray and X-ray luminosity, posing severe constraints on their interpretation in terms of emission from jets of galactic microquasars, strongly favoring a dominant hadronic component in the jet.
Interesting results were obtained also in the field of gamma-ray bursts. Despite of the prompt SuperAGILE arcmin-localization of several GRBs, enabling searches in time and spatial coincidence, in the reported period only two events were significantly detected by the AGILE/GRID (Giuliani et al. 2008a, Moretti et al. 2009), including GRB080514B, the first GRB ever for which the gamma-ray emission can be correlated to an afterglow counterpart with a measured distance, and GRB 090401B. The detection of these events by all the AGILE instruments - SA (18-60 keV), GRID (25 MeV), MCAL (350-700 keV) and ACS (8 keV) - also allowed to measure a few seconds delay of the emission above 25 MeV with respect to that at lower energies. The observations of the Compton Gamma Ray Observatory, particularly the EGRET and BATSE experiments, provided the result that the GRBs with a gamma-ray counterpart detectable above the EGRET sensitivity (that is similar to AGILE/GRID’s) belong to the brightest 5% of the BATSE GRB distribution, but the statistics was only that of 5 events. Although the SuperAGILE GRBs are selected towards the bright end of the BATSE distribution, because of its smaller area, the 2 GRID detections over 21 GRBs localized by SuperAGILE by the end of April 2009 are still consistent with the approximate EGRET statistics.
The pointing strategy of the AGILE mission, typically consisting of long exposures, offers as a by-product a long term monitoring of the same field by SuperAGILE and as a drawback a very inhomogeneous sky coverage (see Fig. 4), largely privileging the Cygnus and Vela sky regions in particular. Although the analysis of the SuperAGILE data collected so far is not complete yet (see 2 and 5.1), about 60 sources were detected over the time period reported in this paper. As it can be seen from Table 2, the large majority of them are X-ray binaries, mostly Low Mass X-ray Binaries (LMXB).
Despite the inhomogeneity and incompleteness of the SuperAGILE
exposure and data analysis, it may be useful to put the list of
sources detected by SA in the context of the current scenario in
the hard X-rays. Currently, INTEGRAL/ISGRI and Swift/BAT offer the
most complete sky surveys in the hard X-rays. The list of sources
detected by SuperAGILE given in Table 2 was
obtained mainly by daily integrations. The sensitivity of
SuperAGILE on this timescale is in the range of 15-20 mCrab.
Applying a flux cut at 15 mCrab in the ISGRI 3.5-year catalogue
(20-40 keV, Bird et al. 2007) and to the BAT 22-month catalog
(14-150 keV, Tueller et al. 2009) we found about 50 and 40
sources, respectively. Of these, in ISGRI 38% are HMXB and 57%
are LMXB, while in BAT they are 31% and 59%, respectively. From
the list in Table 2, SA detected 57 persistent
sources, of which 33% are HMXB and 58% are LMXB. As expected, a
large number of sources are actually in common, being the bright
tail of the LogN-LogS distribution of persistent hard X-ray
sources. Although the agreement is remarkably good, the above
comparison should not be taken rigorously, due to a large number
of important caveats about pointing strategy, type of the
analysis, exposure, energy range and intrinsic source variability.
However, it is a nice general confirmation that the source
detection record by SuperAGILE is consistent with the sensitivity
limit of the current analysis.
Pushing the comparison (as well as the caveats) beyond, we made
the same type of selection to the source catalog of the
BeppoSAX/Wide Field Cameras (WFC, Verrecchia et al. 2007). This
experiment operated in the 2-26 keV energy range. Selecting the
sources with reported average flux above 15 mCrab in 2-10 keV, we
found 80 sources, of which 20% are HMXB and 73% are LMXB.
A comparison between the type and number of X-ray binary sources
brighter than 15 mCrab below 20 keV (in the WFC) and above
(in SA, BAT and ISGRI) shows that approximately the same number of
objects is found among the HMXB, while the LMXB decrease to one
half above 20 keV. This suggests that the LMXB, as a class, tend
to have energy spectra softer than the Crab (photon index
2.1), while the HMXB tend to have harder spectra, on
average.
Many of the SA sources were detected on the orbital timescale, meaning that public light curves are available for them at the ASDC web page (see 6), updated daily with new data (when available). In this paper we provided detailed explanations on how these light curves are extracted and under what assumptions, thus offering an understanding of the limits of their scientific use. Other sources have been detected either in longer integrations or in short outbursts. For these sources no publicly accessible science products are currently available yet.
The main characteristics of the SA observation is the continuity and long duration. Some galactic sources have been observed for probably the longest continuous stretches of time ever, allowing for monitoring the long term variability of their hard X-ray flux. The duration and continuity of the monitoring distinguishes the SA data from those of more sensitive experiments (e.g., Swift/BAT) that offer short and sparse observations of individual sources, sometimes missing short-term variability or events. In addition, the SA field is always simultaneously observed by the AGILE/GRID, thus offering the simultaneous measurement of the flux above 50-100 MeV.
The SuperAGILE experiment is operating nominally since its switch-on in orbit in 2007, showing no signs of degradation or losses with time. The in-flight operation of the AGILE mission is expected to continue until at least mid-2011, subject to approval by the Italian Space Agency (ASI).
Acknowledgements.
AGILE is a mission of the Italian Space Agency (ASI), with co-participation of INAF (Istituto Nazionale di Astrofisica) and INFN (Istituto Nazionale di Fisica Nucleare).References
- (1) D. Altamirano, D. Galloway, J. Chenevez, et al. 2008, ATel 1651
- (2) G. Barbiellini, G. Fedel, G. Liello, et al. 2002, Nucl. Instr. and Meth. A, 490, 146
- (3) S. Barthelmy, A.P. Beardmore, D.N. Burrows, et al. 2008, GCN 8113
- (4) A.J. Bird, A. Malizia, A. Bazzano, et al., 2007, ApJS 170, 175
- (5) A. Chen, P. Caraveo, A. Giuliani, et al. 2008, ATel 1585
- (6) E. Costa, E. Del Monte, I. Donnarumma et al. 2008, ATel 1574
- (7) E. Del Monte, E. Costa, G. Di Persio, et al., 2007, Proceedings of the 5th SCINEGHE Workshop, June 18-20, 2007; Frascati Physics Series vol.45 (2007) pag. 201, A.Lionetto, A.Morselli editors (see also arXiv:0712.1548)
- (8) E. Del Monte, M. Feroci, L. Pacciani, et al., 2008a, A&A 478, L5
- (9) E. Del Monte, Y. Evangelista, M. Feroci, et al. 2008b, ATel 1445
- (10) E. Del Monte, Y. Evangelista, M. Feroci, et al. 2008c, ATel 1732
- (11) I. Donnarumma, E. Costa, E. Del Monte, et al., 2006, Proc. SPIE Conf. 6266, 6266-36
- (12) I. Donnarumma, V. Vittorini, S. Vercellone, et al., 2009a, ApJ 691, L13
- (13) Y. Evangelista, E. Costa, E. Del Monte, et al. 2006, Proc. SPIE Conf. 6266, 6266-35
- (14) Y. Evangelista, I. Donnarumma, E. Del Monte, et al. 2008, ATel 1619
- (15) M. Feroci, E. Costa, P. Soffitta, et al. 2007, Nucl. Instr. and Meth. A, 581, 724
- (16) M. Feroci, E. Costa, E. Del Monte, et al. 2008, Proc. SPIE Conf. 7011, 7011-63
- (17) M. Feroci, L. Pacciani, E. Del Monte, et al. 2008b, ATel 1705
- (18) A. Giuliani, S. Mereghetti, F. Fornari, et al., 2008a, A&A 491, L25
- (19) A. Giuliani, P. Caraveo, A. Chen, et al. 2008b, ATel 1547
- (20) K. Hurley, 2008, Proc. 37th COSPAR Scientific Assembly. Held 13-20 July 2008, in Montr al, Canada., p.1299
- (21) C. Labanti, M. Marisaldi, F. Fuschino, et al. 2009, Nucl. Instr. and Meth. A, 598, 470
- (22) F. Lazzarotto, E. Costa, E. Del Monte, et al., 2008, Astronomical Data Analysis Software and Systems ASP Conference Series, Vol. 394, Proceedings of the conference held 23-26 September, 2007, in Kensington Town Hall, London, United Kingdom. Edited by Robert W. Argyle, Peter S. Bunclark, and James R. Lewis., p.593
- (23) F. Lazzarotto, E. Costa, E. Del Monte, et al. 2009, Astronomical Data Analysis Software and Systems ASP Conference Series, Proceedings of the conference held 2-5 November, 2008, in Quebec City, Quebec, Canada. Edited by David Bohlender, Patrick Dowler and Daniel Durand, in press
- (24) F. Longo, A. Chen, S. Vercellone, et al. 2008, ATel 1492
- (25) E. Moretti, F. Longo, G. Barbiellini, et al. 2009b, GRB Coordinate Network circular #9069
- (26) L. Pacciani, O. Uberti, E. Del Monte, et al. 2008a, Nucl. Instr. and Meth. A, 593, 367
- (27) L. Pacciani, E. Costa, E. Del Monte, et al. 2008b, ATel 1775
- (28) L. Pacciani, M. Feroci, E. Del Monte, et al. 2008c, ATel 1713
- (29) L. Pacciani, E. Costa, E. Del Monte, et al. 2008d, ATel 1428
- (30) L. Pacciani, I. Donnarumma, V. Vittorini, et al., 2009, A&A 494, 49
- (31) L. Pacciani, E. Costa, E. Del Monte, et al. 2009b, ATel 1917
- (32) A. Pellizzoni, M. Pilia, A. Possenti, et al. 2009, ApJ 691, 1618
- (33) F. Perotti, M. Fiorini, S. Incorvaia, E. Mattaini, E. Sant’Ambrogio, Nucl. Instr. and Meth. A, 556, 228
- (34) C. Pittori, F. Verrecchia, P. Santolamazza, et al. 2008, ATel 1394
- (35) C. Pittori, F. Verrecchia, A.W. Chen, et al. 2009, to appear on A&A (arXiv:0902.2959)
- (36) M. Prest, G. Barbiellini, G. Bordignon, et al. 2003, Nucl. Instr. and Meth. A, 501, 280
- (37) N. Rea, G.L. Israel, R. Turolla, et al. 2009, MNRAS, 396, 2419
- (38) G.E. Romero & G.S. Vila 2009, A&A 494, L33
- (39) A. Rossi, A. de Ugarte Postigo, A. Ferrero, et al., 2008, A&A 491, L29
- (40) P. Soffitta, E. Costa, E. Del Monte, et al. 2008, ATel 1782
- (41) M. Tavani, G. Barbiellini, A. Argan, et al. 2009, A&A 502, 995
- (42) M. Trifoglio, A. Bulgarelli, F. Gianotti, et al. 2008, Proc. SPIE Conf. 7011
- (43) J. Tueller, W.H. Baumgartner, C.B. Markwardt, et al. 2009, preprint (arXiv:0903.3037v2)
- (44) F. Verrecchia, J.J.M. in ’t Zand, P. Giommi, et al. 2007, A&A 472, 707