Fermi observations of TeV-selected AGN
Abstract
We report on observations of TeV-selected AGN made during the first 5.5 months of observations with the Large Area Telescope (LAT) on-board the Fermi Gamma-ray Space Telescope (Fermi). In total, 96 AGN were selected for study, each being either (i) a source detected at TeV energies (28 sources) or (ii) an object that has been studied with TeV instruments and for which an upper-limit has been reported (68 objects). The Fermi observations show clear detections of 38 of these TeV-selected objects, of which 21 are joint GeV–TeV sources and 29 were not in the third EGRET catalog. For each of the 38 Fermi -detected sources, spectra and light curves are presented. Most can be described with a power law of spectral index harder than 2.0, with a spectral break generally required to accommodate the TeV measurements. Based on an extrapolation of the Fermi spectrum, we identify sources, not previously detected at TeV energies, which are promising targets for TeV instruments. Evidence for systematic evolution of the -ray spectrum with redshift is presented and discussed in the context of interaction with the EBL.
1 Introduction
At energies above approximately 100 GeV (hereafter the TeV energy regime), ground-based -ray observatories have detected 96 sources over the past two decades. The pace of discovery in this energy regime has been particularly high since the inception of the latest generation of instruments: H.E.S.S., CANGAROO, MAGIC and VERITAS (Weekes, 2008, for recent review). Online catalogs, such as TeVCat111http://tevcat.uchicago.edu, see Wakely & Horan (2008), present continuously updated views of the TeV -ray sky. The majority of the TeV sources are galactic, however 30 extragalactic sources have also been detected, of which 28 correspond to Active Galactic Nuclei (AGN), the other two being recently detected starburst galaxies. Most (25) of these TeV AGN are blazars, an AGN sub-category in which the jet of relativistic plasma ejected from the core is roughly coaligned with our line-of-sight and hence appear Doppler boosted. The majority (24) of the TeV blazars belong to a further sub-category, the BL Lac objects (from BL Lacertae, the prototype for the class), which do not have significant emission or absorption features in their optical spectra, making it difficult to measure their redshift directly.
The first blazar detected at TeV energies was Markarian 421 (Mrk 421; Punch et al., 1992), at a redshift of . It is seen to be highly variable, with flux varying between and the flux of the Crab Nebula222The Crab Nebula is the brightest steady TeV source and the “standard candle” of TeV astronomy, defining the “Crab Unit” in which TeV fluxes and limits are often expressed. We adopt the value of cm-2s-1 from Hillas et al. (1998). (). Doubling timescales as short as 15 minutes have been observed during flares (Gaidos et al., 1996). Mrk 421 has a hard spectrum, with mean photon index of , and has shown clear evidence of spectral variability during flaring episodes (Krennrich et al., 2002a). The detection of such a distant object was interpreted in the context of -ray attenuation through pair-production (Gould & Schréder, 1967) to produce a limit on the power density of extragalactic background light (EBL; Stecker & de Jager, 1993). Mrk 421 was detected by EGRET, the predecessor of the Fermi Large Area Telescope (Thompson et al., 1993; Kanbach et al., 1988), and was reported in the third EGRET catalog (3EG; Hartman et al., 1999) with a detection significance of . However, EGRET did not have sufficient sensitivity to make detailed measurements on the short timescales required to match the TeV observations.
Since this initial discovery, 28 AGN sources have been detected at TeV energies, the most distant reported being 3C 279, at a redshift of . Like Mrk 421, many of these have shown evidence for variability, undergoing episodic flaring activity with short doubling timescales. To date, the most extreme example of variability has been observed from PKS 2155-304 (Aharonian et al., 2007a), in which the flux was seen to reach a maximum of with doubling times as short as s. However, approximately half of the TeV blazars show no evidence for variability, e.g. PKS 2005-489 (Aharonian et al., 2005a) and PG 1553+113 (Aharonian et al., 2006c; Albert et al., 2009). The detections of more distant objects lead to tighter constraints on the the level of the EBL, suggesting that its density is close to the minimum level required from galaxy counts (Aharonian et al., 2006a). The spectra of the majority of TeV blazars are adequately described by a simple power law333The exceptions being Mrk 421 and Mrk 501 which show evidence for spectral curvature and PKS 2155-304 whose spectrum was found to have the form of a broken power-law, during the flaring episode of June 2006., with , and with those of the more distant sources being considerably softer, up to (e.g. Acciari et al., 2009b; Albert et al., 2007b, 2008b; Aharonian et al., 2006c, 2005a). The peak in the measured -ray spectrum (in representation) of these objects lies outside of the energy range of the TeV instruments, making it difficult to fully constrain models of emission using TeV observations alone. The spatial and spectral properties of the TeV-detected AGN are presented in Tables Fermi observations of TeV-selected AGN and Fermi observations of TeV-selected AGN, together with references to TeV observations of each source.
The Large Area Telescope (LAT) is a pair conversion telescope on the Fermi Gamma-ray Space Telescope (formerly GLAST), launched in June 2008. The Fermi LAT instrument, described in detail in Atwood et al. (2009), detects rays with energies between 20 MeV and 300 GeV (hereafter denoted the GeV energy regime). The bulk of the Fermi observational program is dedicated to a sky-survey, in which the full -ray sky is observed every 3 hours. This survey is optimized to produce a uniform exposure to the sky on timescales of months and to facilitate the monitoring and detection of variable and flaring -ray sources on shorter timescales. In its first three months of operation the Fermi LAT mapped the -ray sky with a sensitivity and precision that exceeds any previous space mission in this energy regime. A list of the 205 brightest sources ( or greater) found during that period, and their properties, has been published by the Fermi-LAT collaboration to guide multiwavelength studies with other instruments (Abdo et al., 2009b). This collection of sources is henceforth referred to as the 0FGL list, with individual sources denoted as 0FGL JHHMM.MDDMM. In addition, an in-depth study of the population of 0FGL sources most likely associated with AGN has been made (Abdo et al., 2009a); this population is commonly referred to as the LAT bright AGN sample (LBAS).
Only eight of the 28 TeV-detected AGN were detected by EGRET and included in the 3EG catalog (see Table 4); six are BL Lacs. The majority of these 3EG GeV–TeV sources were discovered as TeV emitters only with the advent of the latest generation of TeV observatories. With the previous generation of instruments only two such extragalactic GeV–TeV sources were established, despite dedicated programs to observe 3EG sources (e.g. Fegan et al., 2005), indicating the degree of mismatch between the sensitivities and effective energy ranges of these instruments. In accordance with the blazar sequence hypothesis (Fossati et al., 1999), BL Lacs are the least luminous class of blazars in the GeV regime, but their emission peaks at a higher energy and they have hard photon indices in the GeV domain. In fact, above a few 10s of GeV, BL Lacs are often relatively brighter than other AGN. With a rapidly falling sensitivity above GeV, EGRET preferentially detected the more luminous, lower-energy-peaked blazars. In contrast, the Fermi LAT has a relatively flat effective area at high energies (8000 cm2 for on-axis rays at GeV) and an energy response that extends beyond 300 GeV, making it much more sensitive to the hard BL Lac sources than was EGRET. Of the 0FGL sources, 14 are AGN detected at TeV energies.
One of the most powerful tools for probing the physics underlying the emission from AGN is the dedicated multiwavelength observational campaign, in which simultaneous observations are made across the full spectrum. Generally, such observations of the TeV blazars reveal two non-thermal components: one at lower energies, peaking in the UV to X-ray regime, and showing clear evidence of polarization, and a second peaking in the -ray regime. The low-energy component is commonly interpreted as resulting from synchrotron emission from relativistic electrons in the jet, while the high-energy component results from a different process, such as inverse-Compton scattering of lower-energy photons in the region of the jet, or the decay of particles produced in interactions of relativistic protons. In many such campaigns significant correlation between the X-ray and TeV -ray emission has been detected (e.g. Buckley et al., 1996; Aharonian et al., 2009b), suggesting that a single population of relativistic particles is responsible for the emission in both regimes (see Katarzyński et al., 2005, for further discussion of X-ray/TeV correlations). Leptonic mechanisms, such as the synchrotron self-Compton (SSC) and external-Compton (EC) processes, and hadronic mechanisms have been invoked to explain the broad-band emission and correlated time variability seen between the low-energy and high-energy components (see Böttcher, 2007, for further discussion). Instances of isolated -ray variability have also been detected in some cases (e.g. Krawczynski et al., 2004), and it is probable that no simple mechanism will fully explain the considerable variety of the blazar behaviour.
Despite the participation of instruments across a wide range of the spectrum, until recently, multiwavelength campaigns have been largely unable to probe the energy range between keV and GeV, as no instrument with sensitivity matched to the day-to-week timescales of typical campaigns has existed. As such, although the synchrotron component has been well measured from radio to X-ray, the full extent of the higher energy -ray component has not. In the case of the TeV blazars, ground-based -ray instruments have generally measured the falling edge of the high-energy component (in representation), which has usually been consistent with a featureless power-law. The rising edge and peak of the emission have, however, been inaccessible, and hence models of the emission have been unconstrained in this energy range. In many cases, very different emissions mechanisms have been invoked, and can explain the data equally well. With the launch of Fermi, which has the sensitivity to measure the emission from the brighter TeV blazars on the day to week timescales, a large part of this gap in coverage has been closed. A recent multi-wavelength campaign on PKS 2155-304 was the first in which the rising and falling edges of the high-energy SED were simultaneously measured with precision (Aharonian et al., 2009c). Measurement of the full broadband spectrum and the pattern of correlation between the optical, X-ray, GeV -ray and TeV -ray emission removes degeneracies in modeling of this object which were present in the results from previous campaigns that could not measure the high-energy component fully.
In this paper we present the results of the first 5.5 months of Fermi-LAT observations of the known TeV blazars and of those AGN for which upper-limits exist at TeV energies. The motivation for this study is two-fold: (i) to present as complete a picture of the high-energy emission as possible by combining the GeV and TeV results on these objects, and (ii) to help guide future TeV observations. For each object detected by Fermi a power-law fit to the GeV spectrum is presented, as are light curves on monthly timescales. For the brighter sources, lightcurves on 10-day timescale are also given. The GeV power-law spectra are extrapolated to TeV energies assuming absorption on the EBL, yielding predictions for TeV emission for the simplest case where there is no curvature in the intrinsic spectra of the objects. For those objects which are not detected by the Fermi LAT, upper limits in the GeV range are presented and extrapolated to TeV energies.
2 Sources
The primary objects selected for this study are the 25 blazars and 3 radio galaxies detected at TeV energies. These are listed in Table Fermi observations of TeV-selected AGN with their coordinates, the AGN sub-class of the object, redshift and references to the initial detection at TeV energies. In summary, 19 high-frequency-peaked BL Lacs (HBL), 3 intermediate-frequency-peaked BL Lacs (IBL), 2 low-frequency-peaked BL Lacs (LBL), 1 flat-spectrum radio quasar (FSRQ) and 3 Fanaroff-Riley radio galaxies (type FR1) have been detected by TeV instruments, the most distant having a redshift of . Table Fermi observations of TeV-selected AGN lists the parameters of a power-law fit to the TeV spectra for these objects, where available: the integral flux () and photon index of the fit () and the threshold energy for the observation (), such that the differential spectrum is:
The differential flux at GeV (the median threshold of the measurements), , is calculated from the TeV power-law spectrum and presented in the table to compare the TeV objects at a single energy lying within the domain of the Fermi-LAT observations. For some objects, multiple TeV spectra have been measured, either by different instruments, in different epochs, or when the object is in different flux states. Where possible, the spectrum corresponding to a low-flux state is listed.
In addition we search for GeV emission from 68 objects for which TeV upper-limits were published from observations with the Whipple 10m telescope (Horan et al., 2004; de la Calle Pérez et al., 2003; Falcone et al., 2004), HEGRA (Aharonian et al., 2004), MAGIC (Albert et al., 2008a) and H.E.S.S. (Aharonian et al., 2005c, 2008b). These targets are listed in Table Fermi observations of TeV-selected AGN with the lowest flux upper-limit published.
From these 96 target objects, the 18 listed in Table 4 are identified or associated with sources in the 0FGL list and LBAS sample (Abdo et al., 2009b, a). Those lists were limited to sources with in three months of Fermi-LAT data444The test statistic, TS, is roughly indicative of the significance of the LAT detection of the source squared.; in this study the criterion to claim a detection and derive a spectrum is lowered to and the period of observation is increased to 5.5 months. A total of 38 sources are detected by Fermi, of which 21 are jointly detected at GeV and TeV energies. We also give an upper-limit for TeV sources not detected by Fermi.
3 Analysis
Fermi-LAT data from the 5.5 month interval from MJD 54682 to MJD 54842 are processed with the standard analysis chain ScienceTools (ST; version V9R11). The latest instrumental response functions (IRFs; version P6_V3) are used to characterize the PSF and effective area during the analysis. These IRFs offer a distinct improvement over those used in the 0FGL analysis, which did not properly account for the presence of remnants of non-triggering events in the tracker. This change results in a systematic increase of in the derived flux from -ray sources, and a possible change in the spectral index, which is most pronounced for softer sources. However, despite these improvements, the P6_V3 IRFs are based on pre-flight calibrations, and to be conservative, only events in the energy range from 200 MeV to 300 GeV are retained for analysis (see for example. Abdo et al., 2009b).
The data for each of the AGN targets is analyzed in a identical manner. Low-level processing of the spacecraft data is applied automatically in a pipeline, reconstructing the energy, arrival direction and particle type of the primary. Events reconstructed from a region of interest (ROI) of around the target location are extracted from this database and filtered such that only those having the highest probability of being a photon (those in the so-called “diffuse” event class) and having an angle of with respect to the local zenith (to suppress the background from the Earth albedo) are retained.
For each target, a background model is constructed, consisting of a diffuse galactic component, predicted by the GALPROP program (Strong et al., 2004a, b), a diffuse power-law component (for the extragalactic and instrumental background) and any of the point sources from the Fermi three-month catalog (Abdo et al., 2009b)555We use an internal version of catalog which is not limited to TS100. which overlap the ROI. The spectrum for each of the point sources is modeled as a power-law. An unbinned maximum likelihood method (Cash, 1979; Mattox et al., 1996), implemented as part of the ST by the gtlike program, is used to optimize the parameters to best match the observations.
The validity of the optimized emission model is verified by producing a TS map for each region. This is done using the ST gttsmap program, which adds a test source to each location over a prescribed region and calculates the improvement in log-Likelihood with the inclusion of the test source. Statistically compelling sources, not accounted for by the model, are identified visually in the map and added to the background in another iteration of gtlike. In addition, high resolution TS maps are produced for each source of interest and the centroid of the emission and contours defining the 68%, 95% and 99% probability regions calculated. During the construction of the 0FGL list, a systematic error of in the reconstruction of the centroids of emission from well known bright sources was identified, and this error is folded into the emission contours displayed in Figure 1. If the centroid of emission on the map is and the distance from the centroid to the (statistical) error contours are defined parametrically by the functions , where for the 68%, 95% and 99% probabilities (), then the contours which account for systematic errors are defined as,
For well detected sources the error contours are roughly circular, with the systematic error dominating. For weakly detected sources the contours can be irregularly shaped, with the statistical component dominating.
Among the outputs from the gtlike program are the optimized values of the model parameters, the covariance matrix describing their variances and correlations, and the TS of each source, which indicates the significance of the source detection. An error contour (called butterfly diagram) is computed from these values and plotted to indicate the confidence range of the fitted model. If the power-law is written as , with normalization parameter , photon index and covariance , the the contour is defined by:
| (1) |
The narrowest point in the butterfly occurs at , the so-called decorrelation energy. For each source, the butterfly is drawn between the lowest energy used in the analysis (either 0.2 GeV or 1 GeV) and the energy of the highest photon detected from the source, subject to the constraint of GeV.
For the sources with a detection significance of (), upper limits on the integral flux above 200 MeV are computed assuming a photon index arbitrary fixed at 1.5 and 2.0. For the very bright LAT sources, the energy range is divided into two bins (200 MeV–1 GeV and 1 GeV–300 GeV), and spectra are fitted to each bin separately. This analysis is limited to sources for which in each of the energy bins, ensuring that a sufficiently accurate spectrum can be derived in each. For all detected sources, systematic errors on the flux and index of the power-law fit to the full Fermi energy range, caused by systematic errors in the IRFs used in the analysis, are evaluated using the “bracketing” method of Abdo et al. (2009d).
In order to make predictions for the TeV energy domain and to make comparisons between the Fermi-LAT and TeV spectra, the best-fit spectrum and butterfly are extrapolated up to 10 TeV. This assumes that the intrinsic spectrum of the emission is described by a single power-law extending over the GeV and TeV energy range, the simplest and least model-dependent assumption that can be made. Above a few hundred GeV, the photons interact with the infrared photons from the EBL as they propagate through the Universe, modifying the detected spectrum from a simple power-law. Franceschini et al. (2008) provide tabulated values of the optical depth as a function of the redshift, which are used to compute the flux detectable between 200 GeV and 10 TeV from the extrapolated GeV spectrum. Their EBL model is consistent with experimental measurements: the lower limits from galaxy counts and upper limits from observations of TeV blazars, and is widely used. However it is not necessarily the final word on EBL density (see e.g. Krennrich et al., 2008), and any errors in the model will propagate into the extrapolation of the GeV spectra to TeV energies. In addition to absorption on the EBL, TeV photons may undergo absorption in the neighborhood of the source (see e.g. Aharonian et al., 2008c), which must also be modeled and accounted for to unfold the intrinsic accelerated spectrum from the detected spectrum. However, such modeling is beyond the scope of this paper.
Light curves for each source are produced with time bins of 10 and 28 days (following the lunar cycle). The light curves are produced by binning the events by their arrival times and performing an independent likelihood analysis for each temporal bin with the same model (same background sources and number of free parameters) as in the fitting of the time-averaged spectrum. The probability that the light curve is consistent with being flat, from a fit to a constant value, is also computed, and used to evaluate the hypothesis that the fitted spectra, averaged over the full period, are valid.
4 Results and discussion of individual sources
Of the 28 TeV-selected sources studied here, 21 are detected by Fermi with . This degree of connection between the TeV blazars and the GeV regime was not found by EGRET and the previous generation of TeV instruments, and is evident now only as a result of the improved sensitivity and greater overlap between the effective energy ranges of Fermi and the current generation of TeV instruments.
The majority of the TeV blazars detected by Fermi have a photon index in the GeV regime, the median index is . In contrast, the populations of BL Lacs and FSRQs from the LBAS sample have median indices of and respectively. The TeV blazars are amongst the hardest extragalactic objects detected by Fermi.
Of the 68 extragalactic objects with TeV limits which were considered here, a total of 17 are detected in the GeV regime. These too have a hard median index, of , indicating that they, perhaps, are good targets for deeper observation with TeV instruments. Of these 17, only one is not a blazar (NGC 1275, an FR1 radiogalaxy), one is an FSRQ (3C 273) and the remainder are BL Lacs. That the majority of these 16 blazars are BL Lacs, rather than following the ratio of FSRQs to BL Lacs found in LBAS, is most likely a result of the way these objects were selected for observation originally by the various TeV groups, rather than anything inherently fundamental. These 15 objects break down as follows: 3 LBL, 1 IBL and 11 HBL.
For each of the 38 sources detected by Fermi, power-law fits to the data and extrapolations into the TeV regime are presented in Figure 2 for GeV–TeV sources, and in the online material for the GeV sources with TeV upper-limits. Additionally, for TeV sources not detected by Fermi, upper limits on the spectra are presented in Figure 3. To justify the validity of these “averaged spectra”, light curves on 28-day timescales are presented in Figure 4 for all GeV-detected objects, and on 10-day timescales in Figure 5 for the brighter GeV emitters. In the 5.5 months of data analyzed here, the majority of sources do not show evidence of flux variation on the timescales tested. For a subset of the sources, as discussed below, a TS map is presented in Figure 1. The remainder are available in the online material.
In addition to the figures, the parameters of the power-law spectra and variability are given in tables. For each of the sources detected by Fermi, Table 5 lists
-
•
the flux and index of the power law, the statistical and systematic errors on these quantities, the decorrelation energy,
-
•
the energy of the highest and fifth highest photons detected within of the source position, which corresponds to % containment according to the P6_V3 IRFs, and
-
•
the probabilities that the 28-day and 10-day light curves are consistent with a constant value.
For the brightest GeV sources, Table 6 lists the parameters of the power-law fits to the low-energy (0.2 GeV–1 GeV) and high-energy (1 GeV–300 GeV) bands. For the TeV sources not detected by Fermi, Table 7 gives the GeV upper-limit over the Fermi energy range. Finally, Table 8 presents the extrapolations of the GeV spectra to the TeV domain, listing the differential flux extrapolated (or measured) at 100 GeV, the integral flux in the TeV band (0.2 TeV–10 TeV) and the photon index found by fitting the EBL-corrected spectrum between 100 GeV and 1 TeV with a power-law.
4.1 TeV sources detected by the Fermi LAT
The TeV sources detected by the Fermi LAT are discussed individually below. For sources with a published TeV spectrum the Fermi spectrum is compared with the TeV. Unless otherwise noted, when more than one TeV spectrum is available in the literature, the one corresponding to the lowest flux state is chosen for comparison. Since references to the initial detection of each TeV source and to the TeV spectra chosen are given in Tables Fermi observations of TeV-selected AGN and Fermi observations of TeV-selected AGN, they are not repeated in the text below. As discussed above, the TS maps, spectra and light curves are presented in Figures 1, 2, 4 and 5 and in Tables 5, 6 and 8, and the reader is not directed to them individually in the discussion below.
3C 66A (catalog )/B: TeV -ray emission from this region was initially reported by the Crimea Observatory group and later, based on observations with the more sensitive VERITAS and MAGIC instruments, with a flux that was less than that claimed in the original detection. VERITAS observations during 2007 & 2008 lead to the detection of a flare from 3C 66A (in October 2008), an IBL, while ruling out 3C 66B, separated by from 3C 66A, at a level of . In contrast, the MAGIC observations during 2007 are consistent with the emission originating from 3C 66B, a radio-galaxy at a distance of ; they rule out 3C 66A at a probability of . The MAGIC observations revealed a harder source, with a significantly lower flux than the later VERITAS observations, which were taken during a flaring episode. The MAGIC observations showed no evidence for variability. GeV -ray emission from the region of 3C 66A was discovered by EGRET, although the signal was contaminated by a nearby pulsar (Kuiper et al., 2000). Details of a dedicated multiwavelength campaign on 3C 66A, involving Fermi, during the period of the VERITAS flare are given by Reyes et al. (2009). The redshift of 3C 66A is assumed to be . This value, however, is based on two measurements of a single weak line in the spectrum of the galaxy, and is considered to be uncertain (Miller et al., 1978).
The positions of 3C 66A (“”) and 3C 66B (“+”) are marked in the TS map for this field. The emission is distributed throughout a broad region around both sources, consistent with the Fermi LAT PSF (which is large at low energies), however it can be seen that the centroid of the emission is constrained to a relatively small region containing 3C 66A (at a 68% confidence level) and excluding 3C 66B (at 99% level). The Fermi LAT emission above 1 GeV is well described by a power law with index of , which is extrapolated to the TeV regime using the redshifts of both 3C 66A (dashed line) and 3C 66B (dot-dashed line). The VERITAS and MAGIC spectral measurements are also shown. It is clear that the spectrum extrapolated in the distant “3C 66A” scenario is in better agreement with the TeV measurements than the close-by “3C 66B” scenario. The latter case would require significant turnover in the intrinsic spectrum above 100 GeV to agree with the MAGIC measurements. The 28-day and 10-day lightcurves show evidence for variability, with a factor of 5–6 between the highest and lowest fluxes. As a result of this, and since the VERITAS measurements showed evidence for a flaring state, and the fact that the redshift of 3C 66A is uncertain, we do not claim that the extrapolated, averaged GeV spectrum is an exact match to the VERITAS points, only that their superficial agreement is suggestive of the dominance of a more distant source. Taken together the positional and spectral information indicate that the bulk of the GeV emission arises from 3C 66A.
RGB J0710+591 (catalog ): Detected recently by the VERITAS collaboration, detailed spectral information at TeV energies has not yet been published for this HBL. RGB J0710+591 is weakly detected by the Fermi LAT, with indications of a hard spectrum. The low statistics at GeV energies mean that the extrapolation into the TeV regime is not constraining.
S5 0716+714 (catalog ): This recently detected MAGIC source was reported with a preliminary flux level of cm-2s-1. Fermi-LAT observations reveal highly significant GeV emission, with a falling spectrum. The extrapolated GeV spectrum gives a flux of cm-2s-1, indicating that the source was likely in a particularly bright state during the MAGIC observations. Indeed, Swift observations contemporaneous with the MAGIC detection revealed the highest X-ray flux ever measured from S5 0716+714 (Giommi et al., 2008).
1ES 0806+524 (catalog ): Fermi detects significant emission from this object, which is consistent with a flat spectrum of . The extrapolation of this power-law to TeV energies agrees well with the spectrum measured by VERITAS. The VERITAS observations did not reveal any significant variability on timescales of months, but the flux was too low to probe shorter timescales. The Fermi LAT observations show only marginal evidence for variability on 28-day timescales, and we therefore suggest that it is reasonable to equate the time-averaged GeV and TeV spectra.
1ES 1011+496 (catalog ): The spectrum of this bright Fermi source is analyzed in two energy bands. The high energy band ( GeV) is consistent with a power law of index . The TeV spectrum from MAGIC is considerably softer, with the lowest spectral measurement made at 150 GeV. The highest energy photon detected by Fermi has an energy of 168 GeV, and hence is in the range covered by the MAGIC spectrum. The flux of the two measured spectra are consistent in the overlapping region, and the extrapolated, absorbed Fermi spectrum agrees well with the measured TeV points. No evidence of variability is seen in the GeV or TeV observations.
Markarian 421 (catalog ): A very bright source in the GeV regime, the spectrum of Markarian 421 is measured with precision by the LAT. No indication of spectral curvature is found; the spectrum above 1 GeV is well described by a simple power law of index . A similar value is found for the spectrum below 1 GeV. The highest energy photon detected by the LAT from Markarian 421 was reconstructed at GeV, and five photons were found with GeV. This source has the highest degree of overlap between GeV and TeV spectra of any of the TeV blazars. There are a considerable number of TeV spectral measurements available in the literature; we adopt the MAGIC spectrum, which has the lowest energy threshold, was made in a relatively low flux state (0.5 ). The spectrum during an extreme flaring state, measured by Whipple in 2001, is also shown. The differential flux measured by the Fermi LAT at 100 GeV is compatible with that found by MAGIC, nevertheless, the extrapolation of the Fermi spectrum leads to an overestimation of the integral flux above 200 GeV. The extrapolated photon index is , clearly harder than any reported in the literature. It is impossible to reconcile the GeV and TeV spectra on the basis of EBL absorption alone, and we conclude there is a turnover in the intrinsic spectrum in the neighborhood of 100 GeV, a region of falling sensitivity for both Fermi and the TeV instruments.
Markarian 180 (catalog ): Based on detection at a level of , the Fermi observations show no evidence for variability and yield a power-law spectral index of . The highest energy photon associated with Mrk 180 is 14 GeV, a decade lower than the TeV data points reported by MAGIC. The TeV spectrum is softer than a simple extrapolation from the Fermi regime, but has a larger flux at 150 GeV. MAGIC did not detect any variability from the object, however their observations were triggered by a particularly high optical state, which might indicate that the TeV spectrum is not representative of an “average” state.
1ES 1218+304 (catalog ): This object lies close to two others considered in this study, W Comae and ON 325. All three occupy a single region of interest (see section 3) for Fermi, and must hence be analyzed together. In the GeV regime the brightest by far is ON 325, an LBL which was detected in the 0FGL survey but not detected by TeV instruments. The TeV source 1ES 1218+304 lies only from ON 325, well within the PSF of the Fermi LAT, at least at lower energies, and W Comae, also a TeV source, lies away.
Fermi detects significant emission from the region of 1ES 1218+304. The Fermi spectrum is well described by a power law with an index of , making it one of the hardest sources in the sample. In the TS map for this region, the centroid of the GeV emission is offset by arcmin, with the blazar located on the 95% confidence contour. Since the TS map shows the residual signal after the known sources have been accounted for, it is possible that small errors in the modeling of ON 325 (located just beyond the right edge of the map), possibly resulting from inaccuracies in the IRFs, introduce a systematic shift in the centroid of the residual emission. However, in light of the extremely hard spectrum measured by Fermi, we consider the GeV emission to be associated with 1ES 1218+304. No variability is detected in the Fermi light curve. During their original observations, MAGIC and VERITAS observed no evidence for variability at TeV energies, and the spectra they produced agree well. However, during observations in January and February 2009, just after the time period considered in this study, VERITAS detected a flare from 1ES 1218+304, during which its flux increased by a factor of five (Imran et al., 2009). The GeV and TeV spectra are close to overlapping at 100 GeV, and an extrapolation from GeV energies agrees quite well with the TeV data points. Again, the -ray emission evidently peaks in the 50–150 GeV range.
W Comae (catalog ): The light curves on 10 and 28-day timescales show a decline of a factor of 2–3 in flux between the start and end of the study period. A relatively bright Fermi source, the averaged spectrum below 1 GeV is consistent with being flat or moderately increasing, while the higher energy band is softer, with . The TeV emission has also proved to be highly variable, with VERITAS reporting a dramatic flare, during which their spectral measurements were derived. In light of the variability in the GeV and TeV regimes, it is not particularly surprising that the extrapolated GeV spectrum does not match well with the TeV data.
3C 279 (catalog ): The only FSRQ detected to date at TeV energies, 3C 279 (catalog ) is the strongest Fermi source in this study. The GeV spectrum shows clear evidence for curvature, with the peak of the emission lying below 200 MeV. A strong flare occurred during the period of this study, between MJD 54780 and 54840, during which the flux increased by a factor of and then declined. We show the spectra from the pre-flare (MJD) and peak-flaring (MJD) periods separately, along with the TeV measurements from MAGIC. The spectral indices for the GeV components are similar in the two states. The predicted TeV flux from an extrapolation of the flaring GeV spectrum is cm-2s-1, an order of magnitude below the flux reported by MAGIC during the February 2006. The extrapolated index for both states is , in agreement with that reported by MAGIC. In contrast, below 1 GeV the Fermi spectral index changed significantly between the two flux states, becoming harder () during the flaring period, suggesting that the peak of the high energy component increased in energy.
PKS 1424+240 (catalog ): Prompted by an initial detection in the 0FGL list by Fermi, this object was subsequently detected at TeV energies by VERITAS and confirmed by MAGIC. The GeV spectrum is hard (). No redshift measurement has been made for this object, and, therefore, we do not extrapolate the GeV spectrum into the TeV regime. At the present time, no TeV spectrum has been published by VERITAS or MAGIC.
H 1426+428 (catalog ): Fermi detects weak emission from the region of this HBL, with a spectral index of . No evidence for variability is seen. A powerful, distant FSRQ (B3 1428+422, ) lies arc seconds from H 1426+428, too close to be resolved separately by Fermi (Fabian et al., 1999; Costamante et al., 2001). However, the hard GeV spectral index strongly suggests that H 1426+428 is the source of the bulk of the emission detected by Fermi. At TeV energies, H 1426+428 was detected during active periods by Whipple, HEGRA, CAT and others, but no detections have been reported with the more sensitive third-generation IACTs. Extrapolated to TeV energies, the GeV spectrum would result in an integral flux of , compared with ( GeV) measured by Whipple and & ( TeV) by HEGRA over two different periods.
PG 1553+113 (catalog ): Detected by H.E.S.S., PG 1553+113 is one of the softest TeV sources, with . In contrast, in the GeV regime, Fermi detects a bright, hard source, with a spectral index of . The spectra measured by Fermi overlaps with those measured by H.E.S.S. and MAGIC, and are in good agreement at around 150 GeV. This source therefore has a strong spectral break of , which must be explained either through absorption with the EBL or through some mechanism intrinsic to the blazar.
Due to the almost complete lack of measurable spectral lines, the redshift of this HBL has not been established. Several indirect methods place it in the range . Therefore we extrapolate the flux from the GeV to TeV energy ranges by assuming both the lower and upper limit on redshift. In the case of , the EBL absorption is sufficient that the extrapolated GeV spectrum is in good agreement with the TeV measurements, leading credence to the hypothesis that the redshift of PG 1553+113 is significantly larger than the lower bound of the allowable redshift range. Indeed, PG 1553+113 might be the most distant TeV object detected to date. This source is the subject of an independent Fermi-LAT paper (Abdo et al., 2009g).
Markarian 501 (catalog ): Many episodes of flaring have been detected from Mrk 501 with previous generation TeV instruments. To date, however, the spectrum for a low-level flux state has not been published by third-generation instruments. In the GeV regime, EGRET detected emission from Mrk 501 after the initial discovery at TeV energies, and significant emission is observed by the LAT. The GeV spectrum of Mrk 501 is well fitted with a simple power law with . In contrast to the historical TeV emission, the GeV flux shows no evidence of variability. With , the extrapolated GeV spectrum is harder than all spectral measurements made with TeV instruments, indicating the presence of curvature in the intrinsic spectrum of the source. TeV instruments have long detected evidence for curvature in the spectrum of this object at 1 TeV. The GeV spectrum is shown with TeV measurements made during a moderate flare (0.4 , GeV) and during a very high state (1.8 , GeV).
1ES 1959+650 (catalog ): Fermi detects emission from this object with a flat spectrum, finding no evidence of variability over the period of this study. At TeV energies, 1ES 1959+650 had long been detected only while flaring. However, during a dedicated multiwavelength campaign in 2006, MAGIC measured its spectrum in a low flux state. An extrapolation of the GeV butterfly overlaps these MAGIC measurements indicating that the underlying spectrum is largely compatible with a single power law over the full -ray regime. The difference between the measured and extrapolated spectral indices, however, is , indicating that there is some evidence for curvature between the two bands (at the level).
PKS 2005-489 (catalog ): A southern hemisphere HBL detected in the TeV domain by H.E.S.S., this source is one of the softer TeV blazars with . Fermi detects significant, hard GeV emission with an index of . No evidence of variability is seen by Fermi on timescales of months while H.E.S.S. observes variability only on timescales longer than a year. The difference between the indices of the extrapolated GeV and H.E.S.S. spectra is , indicating a clear break at a few hundred GeV.
PKS 2155-304 (catalog ): The results of a dedicated multiwavelength campaign on this object, including GeV and TeV observations with Fermi and H.E.S.S. and simple SSC modeling, are reported by Aharonian et al. (2009c). Since the publication of these results, an improved set of IRFs have become available, which correct for an overestimate of the effective area at lower energies that results from on-orbit “pile-up” of events in the detector. A reanalysis of the Fermi data with these IRFs results in an increase in flux of with almost no change in the spectral index. During the 5.5 month period of this study, the GeV flux of PKS 2155-304 varied by a factor of , with a maximum of cm-2s-1, times higher than the average flux. The change in spectral index between the GeV and TeV measurements can only partly be explained by EBL absorption, the remainder presumably resulting from some process intrinsic to the source.
BL Lacertae (catalog ): The spectral index measured by Fermi from this LBL is relatively soft, with . No evidence for variability is seen over the period of the study. The extrapolated flux is approximately one third that measured by MAGIC during a flaring episode. Since this flux represents an estimate of the TeV flux in the optimistic case that there is no intrinsic curvature, we conclude that the low flux state from this object will likely be difficult to measure at TeV energies without a significant investment of observing time.
1ES 2344+514 (catalog ): One of the fainter sources in this study, 1ES 2344+514 is detected with a TS of only 37 and the highest energy photon collected has GeV. The Fermi spectrum is not consistent with the MAGIC spectrum obtained in a low state, but the poor statistics are insufficient to make a reliable prediction of the TeV flux.
M 87 (catalog ) & Centaurus A (catalog ): These nearby sources are two of the three radio galaxies thus far detected at TeV energies. Both are classified as FR1, thought to be the parent class of BL Lacs. While Cen A has not shown evidence of variability on time scales of days or months, M 87 has undergone several flaring episodes on time scales as short as a day. In the GeV domain, Fermi detects both of these sources. The flux of M 87 between 0.2 GeV and 300 GeV, is ten times lower than the flux of Cen A and is too faint to make strong predictions for the TeV emission. In contrast, the detection of Cen A with yields a strongly constraining extrapolation to the TeV domain. The Fermi butterfly underestimates the TeV measurements from Cen A by a factor 10. M 87 and Cen A are the subject of dedicated Fermi papers (Abdo et al., 2009c, f).
4.2 TeV sources not detected by the Fermi LAT
Of the 28 TeV-detected AGN, only the six listed in Table 7 (and 3C 66B, for which we cannot produce upper limits due to contamination by 3C 66A) have not been detected at GeV energies in 5.5 months of data taking with Fermi. The differential fluxes of these objects at 200 GeV, calculated from measured TeV spectra (column in Table Fermi observations of TeV-selected AGN), are all below the median flux, , from the full sample. In fact, they are six of the eight TeV objects with the smallest fluxes.
Upper limits are calculated from the GeV observations assuming two scenarios for the spectral index, and , and are given in Table 7. These limits are extrapolated into the TeV regime in the usual way, and are presented in Figure 3. In general, these two sets of extrapolated limits bracket the TeV measurements.
4.3 GeV sources with upper limits in the TeV regime
In addition to TeV-detected sources, Fermi detects emission from 17 AGN for which only upper limits exist at TeV energies. These GeV detections can be extrapolated to predict the flux that might be observable by TeV observatories, with the caveat that assuming the intrinsic spectrum is described by a single power-law up to the TeV regime can lead to overly optimistic predictions for detection. For most of the TeV sources, the spectra in the TeV regime are well described by a power law with an index no harder than , and it is reasonable to think that this will be the case for future detections. In this context, sources with a predicted photon index harder than should exhibit an intrinsic spectral break.
1ES 0033+595 (catalog ): Observed by Whipple for 12 hours without detection, this HBL, visible only from the northern hemisphere, has an uncertain redshift. Perlman tentatively measured (see comment in Falomo & Kotilainen, 1999), while others have argued that it is more distant (e.g. Sbarufatti et al., 2005, who claim ). We adopt the tentative, direct measurement. The Fermi spectrum is consistent with a flat power law with ) and photons detected up to 150 GeV, resulting in an extrapolated index of . The Whipple upper limit, 0.166 , is in agreement with the prediction of 0.053 obtained here. To reach this flux level with the sensitivity of VERITAS (see Holder et al., 2008) would require an observation of approximately 2.5 hours.
PKS B0521-365 (catalog ), PKS 0829+046 (catalog ) & 3C 273 (catalog ): The objects have an extrapolated flux less than 0.01 . In the absence of significant flaring, it will likely be difficult to detect TeV emission from them unless a large amount of time is dedicated to their observation.
1ES 0647+250 (catalog ): The Fermi LAT detects the emission of this object with a very hard spectral index of and very high maximum photon energy of 257 GeV. The source is visible in the northern hemisphere and was observed by HEGRA for 4 hours. The predicted flux from the Fermi data is 0.0543 , consistent with the HEGRA upper limit and corresponding to 2.5 hours of observations with VERITAS.
1ES 1028+511 (catalog ), 1ES 1118+424 (catalog ) & I Zw 187 (catalog ): These AGN lie outside the 95% probability contour for the origin of the emission on the TS maps. Given that there are 17 AGN detected in this category, the chance probability of discovering three outside the 95% contours is , equivalent to a Gaussian event. The possibility that the emission detected from one or more of these three regions is not associated with the particular AGN under study cannot be discounted. For completeness, the chance probability based on the 38 AGN detected in this study is , not unreasonable, but begging the question as to why all such objects belong to this category (TeV non-detected sources in Table 5).
1ES 1440+122 (catalog ): This Fermi-LAT source is formally the hardest detected in this study. However, since the LAT detected only 10 photons with energy , more observations are required before firm statements can be made about the spectral index. With a redshift of , the extrapolated index between 200 GeV and 1 TeV is 1.68, which is harder than any TeV source yet detected. The predicted flux of 0.231 is likely overestimated by a large factor and a turnover, not accounted for by EBL absorption only, is required to explain the discrepancy between the predicted flux and the H.E.S.S. upper limits of 0.03 .
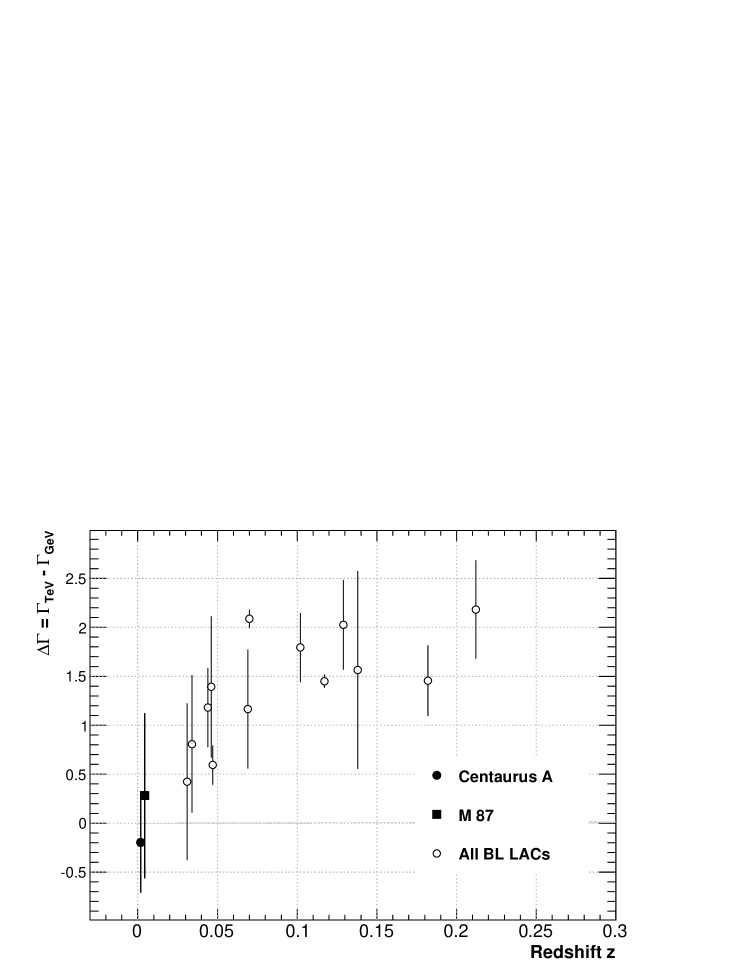
5 Evolution of detected GeV–TeV spectra with redshift
In the LBAS study, the dependence of GeV spectral index of the FSRQ and BL Lac populations on redshift was presented (Figure 11 of Abdo et al., 2009a). Although it was found that the two populations have different spectral properties, no significant relation between the gamma-ray photon index and redshift was found within each source class. The GeV–TeV sources provide a population in which the effects of spectral evolution with redshift can be studied across a much wider energy range than LBAS (although, admittedly in a much smaller redshift range). The presence of a redshift-dependent spectral break in these sources could be indicative of the effects of absorption on the EBL, and provide experimental evidence for this absorption in a manner independent of any specific EBL-density model. Appendix A discusses the relationship between EBL absorption and the redshift dependent change in spectral index between the GeV and TeV ranges,
| (2) |
i.e. in the presence of EBL absorption, and assuming that the intrinsic spectra do not get harder with energy, measured spectral breaks must lie in a region of the plane defined by , with defined by the EBL optical depth.
Figure 6 depicts the difference in the measured TeV and GeV spectral indices, , as a function of the redshift, , for 15 of the 21 extragalactic GeV–TeV sources666We exclude 3C 66A and PG 1553+113 as is not known, RGB J0710+59, S5 0716+714 and PKS 1424+240 as has not been published and 3C 279 as the GeV and TeV states are badly mismatched.. It is evident that the difference between the GeV and TeV spectral indices increases with redshift. At low redshifts the radio galaxies M 87 and Cen A have , as do the near-by BL Lacs. At redshifts greater than , all of the BL Lacs are consistent with .
Pearson’s correlation factor, , is widely used to quantify the correlation between two variables. However, this correlation factor does not take measurement errors into account. Thus, to evaluate the significance of the correlation, a series of Gaussian random variables centered on the values of the measured spectral changes, , and with width equal to their measurement errors are used to generate multiple simulated data sets. The full width at half maximum of the distribution obtained for gives an estimate of the error777The analytic expression for the error gives , consistent with the Monte Carlo method.. The value obtained is , which indicates a clear correlation. To check the robustness of this result, the Kendall rank, defined by
where N is the size of the data set (), is been calculated. For each pair of points from the dataset , those in the same order are assigned a value of , and the others assigned . The sum, , of these combinations is then constructed (Gleissner et al., 2004, and references therein), giving a value of , ranging from , indicating the degree of correlation. The error on is calculated in the same way as for . The same conclusion is established with this test, .
The effects of systematics present in Figure 6 must be considered when determining the validity of concluding that it reflects the effects of EBL absorption. Such systematics are difficult to evaluate in a quantitative manner, appendix B discusses possible contributions in more detail. In light of these difficulties it cannot be claimed with 100% certainty that the observed deficit of sources at for large redshift is a real effect. We anticipate that the TeV AGN not detected by the LAT in this study will ultimately be detected and that this figure will then be limited only by the selection bias at TeV energies. Finally, EBL absorption is not the only effect that could cause a redshift dependent spectral break, evolution of the intrinsic spectra with redshift also cannot be excluded, although this may be difficult to reconcile with the LBAS study, which did not detect any evolution in the larger LAT BL Lac sample.
6 Conclusions
In 5.5 months of observation the Fermi LAT has detected GeV emission from 21 TeV-detected AGN, and from 17 AGN previously observed by TeV groups and for which upper limits have been published at TeV energies. Whereas EGRET detected only a small number of such TeV sources, and detected those only with integration times of months and years, Fermi has detected the majority of the TeV blazars in its first few months of operation. Fermi observations will help TeV observatories optimize the limited observation time available each year, and will be useful in evaluating possible targets for observation. Fermi has sufficient sensitivity to participate meaningfully in simultaneous multi-wavelength campaigns and to measure spectra and light curves from the brighter blazars with a resolution of days to months. In future campaigns, it can be expected that the high-energy emission will be as well covered by Fermi and the TeV observatories as the low-energy peak is by instruments in the radio to X-ray bands.
Many of the TeV sources exhibit an increasing spectrum () in the GeV range confirming the presence of a high energy peak in representation. This is the first large-scale characterization of the full -ray emission component for this class of energetic AGN. More detailed modeling of these -ray sources, which is beyond the scope of this paper, will become possible as more data are acquired by Fermi and the flight-calibrated IRFs become available (extending the effective energy below 100 MeV). The MAGIC-II and H.E.S.S. II instruments will increase the range over which the sensitives of TeV instruments overlap with Fermi at lower energies, producing better coverage at energies between 50 and 200 GeV where a number of TeV sources seem to have turnovers in their measured spectra.
The intrinsic spectrum for some of the TeV sources can be well described by a single power-law across the energy range spanned by the Fermi LAT and the TeV observatories, with any breaks in the measured -ray spectra between the two regimes being consistent with the effects of absorption with a model of minimal EBL density. For other objects, however, a softening of the intrinsic spectrum is required to match the TeV measurements. This could be due to softening intrinsic to the IC component – itself reflecting curvature in the relativistic electron or seed photon distributions.
Based on an extrapolation of the GeV spectra measured by Fermi to TeV energies, a number of previously observed TeV candidates are good candidates for re-observation with TeV instruments: 1ES 0033+595 and 1ES 0647+250 are two such targets.
Redshift-dependent evolution is detected in the spectra of objects detected at GeV and TeV energies. The most reasonable explanation for this is absorption on the EBL, and as such, it would represent the first model-independent evidence for absorption of rays on the EBL. Future observations with Fermi and TeV instruments have the potential to probe in a more quantitative manner.
Appendix A Relationship between GeV–TeV break index and EBL
Writing the measured TeV spectrum as , the unabsorbed (intrinsic) spectrum as and the redshift-dependent optical depth due to EBL absorption as , the effects of the EBL on the measured spectrum is given by,
| (A1) |
If both the measured and intrinsic spectra can be approximated as power laws over the range of the TeV observations, and , then the EBL effects must also be given by a power law, say . The power-law index of the EBL absorption, , is a function of the redshift and the energy range over which the TeV observations are made (denoted for convenience as a dependence on some energy, , at which the measured TeV data most constrains the fitted spectrum). Equating the two expressions for the absorption to first order in gives (see Vassiliev, 2000; Stecker & Scully, 2006, for further discussion of linear and polynomial expansions of the EBL optical depth). Equation A1 relates to the intrinsic and measured spectral indices,
| (A2) |
where it is further assumed that the measured GeV spectral index can be used as a proxy for the intrinsic index in the TeV regime. This is equivalent to assuming that there is no curvature in the intrinsic spectrum between the GeV and TeV energy regimes and that absorption on the EBL does not affect the spectrum in the LAT energy range, which is true for all reasonable EBL models for sources with . For GeV–TeV detected sources, this suggests that the variable probes the effects of EBL absorption in a manner independent of any specific model of EBL density.
For real sources there is curvature in the intrinsic spectrum between the GeV and TeV regimes, and the measured is not a perfect estimator for in the TeV regime. In general it has been found that the curvature in the differential spectra is concave, and the intrinsic spectrum at TeV energies is expected to be softer than the measured GeV spectrum. Therefore it is expected that for real sources:
| (A3) |
so that sources would occupy a region of the space of above some curve defined by the EBL.
Appendix B Discussion of systematics in evolution of spectra with redshift
A number of components contribute to the systematics in Figure 6 and are addressed below: (i) systematic errors on the points themselves and (ii) the effects of the criteria used to select targets for the study.
The systematic errors on the measurements of for the individual sources are presented in Table 5, and are generally smaller than statistical errors, with the largest being . Similarly, the TeV groups estimate and report systematic errors on for each of the detected TeV sources. See, for example, Aharonian et al. (2006e) for a discussion of systematic error estimation with H.E.S.S. In general, the GeV and TeV systematic errors are too small to explain the trend in Figure 6, in which changes by over the range of redshift in question.
The sources in this study are subject to a two-stage selection process, which may lead to regions of the phase-space of being inaccessible due to limitations imposed by of the sensitivities of Fermi and the TeV instruments. This could, in turn, lead to a false correlation being evident in the data – for example, see Figure 7 from the LBAS study (Abdo et al., 2009a) for a correlation which might incorrectly be claimed based on a sensitivity-limited sample. Targets were originally selected by TeV astronomers for observation with TeV instruments. Given the sensitivities of those instruments and the amount of time dedicated to each target, some fraction were detected, leading to 28 sources used in this study. The Fermi sensitivity further restricts the sample to the 15 GeV–TeV sources displayed in Figure 6. Given the complexity (and randomness) of the selection process, it is almost impossible to quantify where its “sensitivity” limits are in the space of . In the null hypothesis, that there is no EBL effect present in the results of Figure 6, we attempt to evaluate in a qualitative manner whether the lack of sources at for larger redshifts could arise from a selection effect. The primary selection of targets is based on detection at TeV energies. Sources in this region of the plot would have harder TeV spectra than those actually detected at the larger redshifts. Since, it is unlikely that TeV astronomers are deliberately biasing the sample toward softer distant AGN, the major effect producing this bias would have to result from the sensitivity limit of the instrument. The instrumental sensitivity directly limits the space of , requiring for detection (as in the LBAS figure cited above), and these limits transfer to the space of only through convolution with the source function . Therefore, a sharp cut-off in this space should not be expected, rather a slower decrease in source counts into the “forbidden” region. In the no-EBL hypothesis, and further assuming that evolution in the source function, the primary consideration is whether the decrease in measured flux with distance coupled with the sensitivity limit would lead to an evolution in the population of detectable sources with redshift. There is very little published material addressing the flux sensitivity of current TeV instruments as a function of spectral index, however it is reasonable to presume that TeV instruments are more sensitive to sources with harder spectra, than to those with softer: they have better background rejection and an improved PSF at higher energies. Indeed, TeV instruments often use “hard cuts” to improve the sensitivity for hard sources. In this case, it would be expected that TeV instruments would preferentially detect harder sources (with lower fluxes) at larger redshifts, whereas this is exactly the opposite of what is actually observed, i.e. that the majority of the distant AGN are softer – no hard, weak TeV AGN has been detected to date.
References
- Abdo et al. (2009a) Abdo, A. A., et al. 2009a, ApJ, 700, 597
- Abdo et al. (2009b) —. 2009b, ApJS, 183, 46
- Abdo et al. (2009c) —. 2009c, ApJ, submitted
- Abdo et al. (2009d) —. 2009d, ApJ, submitted
- Abdo et al. (2009e) —. 2009e, in preparation
- Abdo et al. (2009f) —. 2009f, in preparation
- Abdo et al. (2009g) —. 2009g, ApJ, submitted
- Acciari et al. (2008) Acciari, V. A., et al. 2008, ApJ, 684, L73
- Acciari et al. (2009a) —. 2009a, ApJ, 690, L126
- Acciari et al. (2009b) —. 2009b, ApJ, 693, L104
- Acciari et al. (2009c) —. 2009c, ApJ, 695, 1370
- Aharonian et al. (2003a) Aharonian, F., et al. 2003a, A&A, 403, L1
- Aharonian et al. (2003b) —. 2003b, A&A, 403, 523
- Aharonian et al. (2004) —. 2004, A&A, 421, 529
- Aharonian et al. (2005a) —. 2005a, A&A, 436, L17
- Aharonian et al. (2005b) —. 2005b, A&A, 430, 865
- Aharonian et al. (2005c) —. 2005c, A&A, 441, 465
- Aharonian et al. (2006a) —. 2006a, Nature, 440, 1018
- Aharonian et al. (2006b) —. 2006b, A&A, 455, 461
- Aharonian et al. (2006c) —. 2006c, A&A, 448, L19
- Aharonian et al. (2006d) —. 2006d, Science, 314, 1424
- Aharonian et al. (2006e) —. 2006e, A&A, 457, 899
- Aharonian et al. (2007a) —. 2007a, ApJ, 664, L71
- Aharonian et al. (2007b) —. 2007b, A&A, 473, L25
- Aharonian et al. (2007c) —. 2007c, A&A, 475, L9
- Aharonian et al. (2008a) —. 2008a, A&A, 481, L103
- Aharonian et al. (2008b) —. 2008b, A&A, 478, 387
- Aharonian et al. (2009a) —. 2009a, ApJ, 695, L40
- Aharonian et al. (2009b) —. 2009b, A&A, 502, 749
- Aharonian et al. (2009c) —. 2009c, ApJ, 696, L150
- Aharonian et al. (2008c) Aharonian, F. A., Khangulyan, D., & Costamante, L. 2008c, MNRAS, 387, 1206
- Albert et al. (2006a) Albert, J., et al. 2006a, ApJ, 642, L119
- Albert et al. (2006b) —. 2006b, ApJ, 648, L105
- Albert et al. (2007a) —. 2007a, ApJ, 666, L17
- Albert et al. (2007b) —. 2007b, ApJ, 667, L21
- Albert et al. (2007c) —. 2007c, ApJ, 662, 892
- Albert et al. (2007d) —. 2007d, ApJ, 663, 125
- Albert et al. (2007e) —. 2007e, ApJ, 669, 862
- Albert et al. (2008a) —. 2008a, ApJ, 681, 944
- Albert et al. (2008b) —. 2008b, Science, 320, 1752
- Albert et al. (2009) —. 2009, A&A, 493, 467
- Aliu et al. (2009) Aliu, E., et al. 2009, ApJ, 692, L29
- Atwood et al. (2009) Atwood, B., et al. 2009, ApJ, in press, arXiv:0902.1089
- Böttcher (2007) Böttcher, M. 2007, Ap&SS, 309, 95
- Buckley et al. (1996) Buckley, J. H., et al. 1996, ApJ, 472, L9+
- Cash (1979) Cash, W. 1979, ApJ, 228, 939
- Catanese et al. (1998) Catanese, M., et al. 1998, ApJ, 501, 616
- Chadwick et al. (1999) Chadwick, P. M., et al. 1999, Astroparticle Physics, 11, 145
- Costamante et al. (2001) Costamante, L., et al. 2001, A&A, 371, 512
- de la Calle Pérez et al. (2003) de la Calle Pérez, I., et al. 2003, ApJ, 599, 909
- Fabian et al. (1999) Fabian, A. C., Celotti, A., Pooley, G., Iwasawa, K., Brandt, W. N., McMahon, R. G., & Hoenig, M. D. 1999, MNRAS, 308, L6
- Falcone et al. (2004) Falcone, A. D., et al. 2004, ApJ, 613, 710
- Falomo & Kotilainen (1999) Falomo, R., & Kotilainen, J. K. 1999, A&A, 352, 85
- Fegan et al. (2005) Fegan, S. J., et al. 2005, ApJ, 624, 638
- Fossati et al. (1999) Fossati, G., Celotti, A., Ghisellini, G., & Maraschi, L. 1999, in Astronomical Society of the Pacific Conference Series, Vol. 159, BL Lac Phenomenon, ed. L. O. Takalo & A. Sillanpää, 351–+
- Franceschini et al. (2008) Franceschini, A., Rodighiero, G., & Vaccari, M. 2008, A&A, 487, 837
- Gaidos et al. (1996) Gaidos, J. A., et al. 1996, Nature, 383, 319
- Giommi et al. (2008) Giommi, P., Perri, M., Verrecchia, F., Pittori, C., Tavani, M., Gehrels, N., & Chester, M. 2008, The Astronomer’s Telegram, 1495, 1
- Gleissner et al. (2004) Gleissner, T., Wilms, J., Pottschmidt, K., Uttley, P., Nowak, M. A., & Staubert, R. 2004, A&A, 414, 1091
- Gould & Schréder (1967) Gould, R. J., & Schréder, G. P. 1967, Physical Review, 155, 1408
- Hartman et al. (1999) Hartman, R. C., et al. 1999, ApJS, 123, 79
- Hillas et al. (1998) Hillas, A. M., et al. 1998, ApJ, 503, 744
- Holder et al. (2008) Holder, J., et al. 2008, in American Institute of Physics Conference Series, Vol. 1085, American Institute of Physics Conference Series, ed. F. A. Aharonian, W. Hofmann, & F. Rieger, 657–660
- Horan et al. (2002) Horan, D., et al. 2002, ApJ, 571, 753
- Horan et al. (2004) —. 2004, ApJ, 603, 51
- Imran et al. (2009) Imran, A., et al. 2009, in Proc. 31st ICRC (in press), arXiv:0908.0142
- Kanbach et al. (1988) Kanbach, G., et al. 1988, Space Sci. Rev., 49, 61
- Katarzyński et al. (2005) Katarzyński, K., Ghisellini, G., Tavecchio, F., Maraschi, L., Fossati, G., & Mastichiadis, A. 2005, A&A, 433, 479
- Krawczynski et al. (2004) Krawczynski, H., et al. 2004, ApJ, 601, 151
- Krennrich et al. (2008) Krennrich, F., Dwek, E., & Imran, A. 2008, ApJ, 689, L93
- Krennrich et al. (2002a) Krennrich, F., et al. 2002a, ApJ, 575, L9
- Krennrich et al. (2002b) —. 2002b, ApJ, 575, L9
- Kuiper et al. (2000) Kuiper, L., Hermsen, W., Verbunt, F., Thompson, D. J., Stairs, I. H., Lyne, A. G., Strickman, M. S., & Cusumano, G. 2000, A&A, 359, 615
- Mattox et al. (1996) Mattox, J. R., Bertsch, D. L., & Chiang, J. 1996, ApJ, 461, 396
- Miller et al. (1978) Miller, J. S., French, H. B., & Hawley, S. A. 1978, in BL Lac Objects, ed. A. M. Wolfe, Vol. 176
- Neshpor et al. (2001) Neshpor, Y. I., Chalenko, N. N., Stepanian, A. A., Kalekin, O. R., Jogolev, N. A., Fomin, V. P., & Shitov, V. G. 2001, Astronomy Reports, 45, 249
- Neshpor et al. (1998) Neshpor, Y. I., Stepanyan, A. A., Kalekin, O. P., Fomin, V. P., Chalenko, N. N., & Shitov, V. G. 1998, Astronomy Letters, 24, 134
- Nishiyama (1999) Nishiyama, T. 1999, in Proc. 26th ICRC, Vol. 3, 370–+
- Ong et al. (2009a) Ong, R., et al. 2009a, The Astronomer’s Telegram, 2098, 1
- Ong et al. (2009b) —. 2009b, The Astronomer’s Telegram, 1941, 1
- Punch et al. (1992) Punch, M., et al. 1992, Nature, 358, 477
- Quinn et al. (1996) Quinn, J., et al. 1996, ApJ, 456, L83+
- Reyes et al. (2009) Reyes, L. C., et al. 2009, in Proc. 31st ICRC (in press), arXiv:0907.5175
- Samuelson et al. (1998) Samuelson, F. W., et al. 1998, ApJ, 501, L17+
- Sbarufatti et al. (2005) Sbarufatti, B., Treves, A., & Falomo, R. 2005, ApJ, 635, 173
- Stecker & de Jager (1993) Stecker, F. W., & de Jager, O. C. 1993, ApJ, 415, L71+
- Stecker & Scully (2006) Stecker, F. W., & Scully, S. T. 2006, ApJ, 652, L9
- Strong et al. (2004a) Strong, Moskalenko, & Reimer. 2004a, ApJ, 613, 962
- Strong et al. (2004b) Strong, A. W., Moskalenko, I. V., Reimer, O., Digel, S., & Diehl, R. 2004b, A&A, L47, 422
- Superina et al. (2008) Superina, G., Benbow, W., Boutelier, T., et al. 2008, in Proc. 30th ICRC, Vol. 3, 913–916
- Tagliaferri et al. (2008) Tagliaferri, G., et al. 2008, ApJ, 679, 1029
- Teshima et al. (2008) Teshima, M., et al. 2008, The Astronomer’s Telegram, 1500, 1
- Thompson et al. (1993) Thompson, D. J., et al. 1993, ApJS, 86, 629
- Vassiliev (2000) Vassiliev, V. V. 2000, Astroparticle Physics, 12, 217
- Wakely & Horan (2008) Wakely, S. P., & Horan, D. 2008, in International Cosmic Ray Conference, Vol. 3, International Cosmic Ray Conference, 1341–1344
- Weekes (2008) Weekes, T. C. 2008, in AIP conf. series, ed. F. A. Aharonian, W. Hofmann, & F. Rieger, Vol. 1085, 3–17
| Name | TypeaaSee notes for Table Fermi observations of TeV-selected AGN for explanation of object types. | Ref | |||
|---|---|---|---|---|---|
| Blazars: | |||||
| RGB J0152+017 (catalog ) | HBL | 1 | |||
| 3C 66A (catalog ) | IBL | bbThe redshift of 3C 66A is considered to be uncertain. | 2,3ccDetection of E1 TeV emission from 3C 66A and BL Lacertae was first claimed by Neshpor et al. (1998, 2001). The measured fluxes are not consistent with the later measurements made with more sensitive instruments. | ||
| 1ES 0229+200 (catalog ) | HBL | 4 | |||
| 1ES 0347-121 (catalog ) | HBL | 5 | |||
| PKS 0548-322 (catalog ) | HBL | 6 | |||
| RGB J0710+591 (catalog ) | HBL | 7 | |||
| S5 0716+714 (catalog ) | LBL | 8 | |||
| 1ES 0806+524 (catalog ) | HBL | 9 | |||
| 1ES 1011+496 (catalog ) | HBL | 10 | |||
| 1ES 1101-232 (catalog ) | HBL | 11 | |||
| Markarian 421 (catalog ) | HBL | 12 | |||
| Markarian 180 (catalog ) | HBL | 13 | |||
| 1ES 1218+304 (catalog ) | HBL | 14 | |||
| W Comae (catalog ) | IBL | 15 | |||
| 3C 279 (catalog ) | FSRQ | 16 | |||
| PKS 1424+240 (catalog ) | IBL | 17 | |||
| H 1426+428 (catalog ) | HBL | 18 | |||
| PG 1553+113 (catalog ) | HBL | 19 | |||
| Markarian 501 (catalog ) | HBL | 20 | |||
| 1ES 1959+650 (catalog ) | HBL | 21 | |||
| PKS 2005-489 (catalog ) | HBL | 22 | |||
| PKS 2155-304 (catalog ) | HBL | 23 | |||
| BL Lacertae (catalog ) | LBL | 24,25ccDetection of E1 TeV emission from 3C 66A and BL Lacertae was first claimed by Neshpor et al. (1998, 2001). The measured fluxes are not consistent with the later measurements made with more sensitive instruments. | |||
| 1ES 2344+514 (catalog ) | HBL | 26 | |||
| H 2356-309 (catalog ) | HBL | 27 | |||
| Others | |||||
| 3C 66B (catalog ) | FR1 | 28 | |||
| M 87 (catalog ) | FR1 | 29 | |||
| Centaurus A (catalog ) | FR1 | 30 | |||
References. — (1) Aharonian et al. (2008a); (2) Neshpor et al. (1998); (3) Acciari et al. (2009b); (4) Aharonian et al. (2007c); (5) Aharonian et al. (2007b); (6) Superina et al. (2008); (7) Ong et al. (2009b); (8) Teshima et al. (2008); (9) Acciari et al. (2009a); (10) Albert et al. (2007b); (11) Aharonian et al. (2006a); (12) Punch et al. (1992); (13) Albert et al. (2006b); (14) Albert et al. (2006a); (15) Acciari et al. (2008); (16) Albert et al. (2008b); (17) Ong et al. (2009a) (18) Horan et al. (2002); (19) Aharonian et al. (2006c); (20) Quinn et al. (1996); (21) Nishiyama (1999); (22) Aharonian et al. (2005a); (23) Chadwick et al. (1999); (24) Neshpor et al. (2001); (25) Albert et al. (2007a); (26) Catanese et al. (1998); (27) Aharonian et al. (2006b); (28) Aliu et al. (2009); (29) Aharonian et al. (2003a); (30) Aharonian et al. (2009a).
| Name | Note | Ref | ||||
|---|---|---|---|---|---|---|
| [GeV] | [cm-2s-1] | [1] | [cm-2s-1TeV-1] | |||
| Blazars: | ||||||
| RGB J0152+017 (catalog ) | 300 | 0.058 | No variability | 1 | ||
| 3C 66A (catalog ) | 200 | 0.201 | Flaring state | 2 | ||
| 1ES 0229+200 (catalog ) | 580 | 0.003 | No variability | 3 | ||
| 1ES 0347-121 (catalog ) | 250 | 0.065 | No variability | 4 | ||
| PKS 0548-322 (catalog ) | 200 | 0.030 | 5 | |||
| RGB J0710+591 (catalog ) | 300 | ATEL 1941 | 6 | |||
| S5 0716+714 (catalog ) | 400 | ATEL 1502 | 7 | |||
| 1ES 0806+524 (catalog ) | 300 | 2.231 | Low flux state? | 8 | ||
| 1ES 1011+496 (catalog ) | 200 | 0.237 | Flaring state | 9 | ||
| 1ES 1101-232 (catalog ) | 225 | 0.063 | No variability | 10 | ||
| Markarian 421 (catalog ) | 383 | 87.96 | Flaring state | 11 | ||
| 200 | 1.572 | Lowest flux state | 12 | |||
| Markarian 180 (catalog ) | 200 | 0.264 | Flaring state | 13 | ||
| 1ES 1218+304 (catalog ) | 200 | 0.125 | 14 | |||
| W Comae (catalog ) | 200 | 0.280 | Flaring state | 15 | ||
| 3C 279 (catalog ) | 100 | 0.931 | Flaring state | 16 | ||
| PKS 1424+240 (catalog ) | 200 | ATEL 2084 | 17 | |||
| H 1426+428 (catalog ) | 280 | 0.696 | 18,19aaThe flux reported by the HEGRA collaboration is 0.08 above 1 TeV. | |||
| PG 1553+113 (catalog ) | 200 | 0.720 | Low flux state? | 20 | ||
| Markarian 501 (catalog ) | 300 | 3.03 | Flaring state | 21 | ||
| 150 | 0.592 | Lowest flux state | 22 | |||
| 1ES 1959+650 (catalog ) | 1300 | 7.030 | Orphan flare | 23 | ||
| 150 | 0.171 | Low flux state | 24 | |||
| PKS 2005-489 (catalog ) | 200 | 0.093 | 25 | |||
| PKS 2155-304 (catalog ) | 200 | bbA broken power law with , and GeV was preferred. | 20.6 | Flaring state | 26 | |
| 300 | 1.248 | Low flux state | 27 | |||
| BL Lacertae (catalog ) | 200 | 0.078 | 28 | |||
| 1ES 2344+514 (catalog ) | 200 | 0.233 | Low flux state | 29 | ||
| H 2356-309 (catalog ) | 200 | 0.043 | No variability | 30 | ||
| Others | ||||||
| 3C 66B (catalog ) | 150 | 0.042 | Flaring state | 31 | ||
| M 87 (catalog ) | 730 | 0.016 | 32 | |||
| Centaurus A (catalog ) | 250 | 0.019 | Low flux state? | 33 | ||
References. — (1) Aharonian et al. (2008a); (2) Acciari et al. (2009b); (3) Aharonian et al. (2007c); (4) Aharonian et al. (2007b); (5) Superina et al. (2008); (6) Ong et al. (2009b); (7) Teshima et al. (2008); (8) Acciari et al. (2009a); (9) Albert et al. (2007b); (10) Aharonian et al. (2006a); (11) Krennrich et al. (2002b); (12) Albert et al. (2007d); (13) Albert et al. (2006b); (14) Acciari et al. (2009c); (15) Acciari et al. (2008); (16) Albert et al. (2008b); (17) Ong et al. (2009a) (18) Horan et al. (2002); (19) Aharonian et al. (2003b); (20) Aharonian et al. (2006c); (21) Samuelson et al. (1998) (22) Albert et al. (2007e); (23) Krawczynski et al. (2004); (24) Tagliaferri et al. (2008); (25) Aharonian et al. (2005a); (26) Aharonian et al. (2007a); (27) Aharonian et al. (2005b); (28) Albert et al. (2007a); (29) Albert et al. (2007c); (30) Aharonian et al. (2006b); (31) Aliu et al. (2009); (32) Aharonian et al. (2006d); (33) Aharonian et al. (2009a).
| TeV limit | |||||||
|---|---|---|---|---|---|---|---|
| Name | TypeaaBL Lac, LBL, IBL, HBL – BL Lac object; FSRQ – Flat Spectrum Radio Quasar; FR1 & 2 – Fanaroff-Riley 1 & 2 galaxy; Sy 1, 1.5 & 2 – Seyfert 1, 1.5 & 2; RG – Radio Galaxy; NLSy1 – Narrow-Line Seyfert 1; UnC – Unclassified; see the SIMBAD (http://simbad.u-strasbg.fr/simbad) and NED (http://nedwww.ipac.caltech.edu) databases. | Flux | Energy | Ref | |||
| [] | [GeV] | ||||||
| III Zw 2 (catalog ) | Sy1 | 0.027 | 430 | 1 | |||
| 1ES 0033+595 (catalog ) | HBL | bbTentative measurement, see comment in text. | 0.11 | 390 | 2 | ||
| NGC 315 (catalog ) | FR1 | 0.05 | 860 | 3 | |||
| 4C+31.04 (catalog ) | RG | 0.14 | 760 | 3 | |||
| 1ES 0120+340 (catalog ) | HBL | 0.032 | 190 | 4 | |||
| 1ES 0145+138 (catalog ) | HBL | 0.015 | 310 | 5 | |||
| UGC 01651 (catalog ) | RG | 0.07 | 790 | 3 | |||
| BWE 0210+1159 (catalog ) | LBL | 0.012 | 530 | 1 | |||
| RGB J0214+517 (catalog ) | HBL | 0.17 | 430 | 6 | |||
| PKS 0219-164 (catalog ) | LBL | 0.27 | 1780 | 3 | |||
| NGC 1054 (catalog ) | Sy | 0.02 | 860 | 3 | |||
| NGC 1068 (catalog ) | Sy2 | 0.013 | 210 | 5 | |||
| V Zw 331 (catalog ) | LBL | 0.09 | 870 | 3 | |||
| NGC 1275 (catalog ) | FR1 | 0.03 | 850 | 3 | |||
| RX J0319.8+1845 (catalog ) | HBL | 0.033 | 190 | 4 | |||
| B2 0321+33B (catalog ) | NLSy1 | 0.10 | 400 | 7 | |||
| 1ES 0323+022 (catalog ) | HBL | 0.015 | 210 | 5 | |||
| 4C +37.11 (catalog ) | RG | 0.05 | 800 | 3 | |||
| 1ES 0414+009 (catalog ) | HBL | 0.057 | 230 | 4 | |||
| 3C 120 (catalog ) | RG | 0.004 | 230 | 5 | |||
| MG J0509+0541 (catalog ) | IBL | 0.11 | 960 | 3 | |||
| 4C+01.13 (catalog ) | BL Lac | 0.10 | 1010 | 3 | |||
| Pictor A (catalog ) | FR2 | 0.014 | 220 | 5 | |||
| PKS B0521-365 (catalog ) | LBL | 0.042 | 310 | 1 | |||
| EXO 0556.4-3838 (catalog ) | HBL | 0.051 | 220 | 5 | |||
| PKS 0558-504 (catalog ) | NLSy1 | 0.018 | 310 | 1 | |||
| 1ES 0647+250 (catalog ) | HBL | 0.13 | 780 | 3 | |||
| UGC 03927 (catalog ) | UnC | 0.09 | 1090 | 3 | |||
| 3C 192.0 (catalog ) | RG | 0.20 | 930 | 3 | |||
| RGB J0812+026 (catalog ) | BL Lac | 0.031 | 220 | 5 | |||
| 3C 197.1 (catalog ) | FR2 | 0.05 | 960 | 3 | |||
| PKS 0829+046 (catalog ) | LBL | 0.06 | 1000 | 3 | |||
| NGC 2622 (catalog ) | Sy1 | 0.05 | 400 | 7 | |||
| 1ES 0927+500 (catalog ) | HBL | 0.052 | 230 | 4 | |||
| S4 0954+65 (catalog ) | LBL | 0.096 | 300 | 6 | |||
| MS1019.0+5139 (catalog ) | BL Lac | 0.07 | 920 | 3 | |||
| 1ES 1028+511 (catalog ) | HBL | 0.29 | 400 | 6 | |||
| RGB J1117+202 (catalog ) | HBL | 0.030 | 610 | 5 | |||
| 1ES 1118+424 (catalog ) | HBL | 0.12 | 430-500 | 6 | |||
| Markarian 40 (catalog ) | Sy1 | 0.21 | 430 | 6 | |||
| NGC 3783 (catalog ) | Sy1 | 0.025 | 220 | 5 | |||
| NGC 4151 (catalog ) | Sy1.5 | 0.07 | 790 | 3 | |||
| 1ES 1212+078 (catalog ) | HBL | 0.17 | 920 | 3 | |||
| ON 325 (catalog ) | LBL | 0.22 | 400-430 | 6 | |||
| 3C 273 (catalog ) | FSRQ | 0.014 | 300 | 1 | |||
| MS 1229.2+6430 (catalog ) | HBL | 0.17 | 300-430 | 6 | |||
| 1ES 1239+069 (catalog ) | HBL | 0.20 | 400-430 | 6 | |||
| 1ES 1255+244 (catalog ) | HBL | 0.11 | 350-500 | 6 | |||
| RGB J1413+436 (catalog ) | RG | 0.06 | 400 | 7 | |||
| RX J1417.9+2543 (catalog ) | HBL | 0.023 | 190 | 4 | |||
| OQ530 (catalog ) | LBL | 0.058 | 300 | 6 | |||
| 1ES 1440+122 (catalog ) | HBL | 0.033 | 290 | 5 | |||
| RGB J1629+401 (catalog ) | NLSy1 | 0.09 | 400 | 7 | |||
| RX J1725.0+1152 (catalog ) | HBL | 0.046 | 190 | 4 | |||
| I Zw 187 (catalog ) | HBL | 0.086 | 300-350 | 6 | |||
| 1ES 1741+196 (catalog ) | HBL | 0.053 | 350-500 | 6 | |||
| 3C 371 (catalog ) | LBL | 0.19 | 300 | 6 | |||
| Cyg A (catalog ) | FR2 | 0.03 | 910 | 3 | |||
| PKS 2201+04 (catalog ) | BL Lac | 0.08 | 950 | 3 | |||
| PG 2209+184 (catalog ) | RG | 0.13 | 400 | 7 | |||
| RBS 1888 (catalog ) | HBL | 0.009 | 170 | 5 | |||
| HS 2250+1926 (catalog ) | FSRQ | 0.009 | 590 | 1 | |||
| 2QZ J225453.2-272509 (catalog ) | BL Lac | 0.016 | 170 | 5 | |||
| PKS 2254+074 (catalog ) | LBL | 0.05 | 900 | 3 | |||
| NGC 7469 (catalog ) | Sy1 | 0.006 | 250 | 5 | |||
| PKS 2316-423 (catalog ) | HBL | 0.014 | 190 | 5 | |||
| 1ES 2321+419 (catalog ) | HBL | 0.03 | 890 | 3 | |||
| 1ES 2343-151 (catalog ) | IBL | 0.012 | 230 | 1 | |||
| TeV name | 0FGL name | 3EG name |
|---|---|---|
| TeV detected: | ||
| 3C 66A (catalog ) | 0FGL J0222.64302 (catalog ) | 3EG J02224253 (catalog ) |
| S5 0716+714 (catalog ) | 0FGL J0722.07120 (catalog ) | 3EG J07217120 (catalog ) |
| 1ES 1011+496 (catalog ) | 0FGL J1015.24927 (catalog ) | |
| Markarian 421 (catalog ) | 0FGL J1104.53811 (catalog ) | 3EG J11043809 (catalog )aaA well established TeV source at the time of the 3EG catalog. |
| W Comae (catalog ) | 0FGL J1221.72814 (catalog ) | 3EG J12222841 (catalog ) |
| 3C 279 (catalog ) | 0FGL J1256.10547 (catalog ) | 3EG J12550549 (catalog ) |
| PKS 1424+240 (catalog ) | 0FGL J1427.1+2347 (catalog ) | |
| PG 1553+113 (catalog ) | 0FGL J1555.81110 (catalog ) | |
| Markarian 501 (catalog ) | 0FGL J1653.93946 (catalog ) | |
| 1ES 1959+650 (catalog ) | 0FGL J2000.26506 (catalog ) | |
| PKS 2005-489 (catalog ) | 0FGL J2009.44850 (catalog ) | |
| PKS 2155-304 (catalog ) | 0FGL J2158.83014 (catalog ) | 3EG J21583023 (catalog )aaA well established TeV source at the time of the 3EG catalog. |
| BL Lacertae (catalog ) | 0FGL J2202.44217 (catalog ) | 3EG J22024217 (catalog ) |
| Centaurus A (catalog ) | 0FGL J1325.44303 (catalog ) | 3EG J13244314 (catalog ) |
| TeV non-detected: | ||
| 1ES 0033+595 (catalog ) | 0FGL J0036.75951 (catalog ) | |
| ON 325 (catalog ) | 0FGL J1218.03006 (catalog ) | |
| 3C 273 (catalog ) | 0FGL J1229.10202 (catalog ) | 3EG J12290210 (catalog ) |
| NGC 1275 (catalog ) | 0FGL J0320.04131 (catalog ) | |
| Parameters of fitted power-law spectrum | Highest energy | Probability of | ||||||
|---|---|---|---|---|---|---|---|---|
| Name | TS | Flux (200 MeV) | Photon Index | Decorr. | photons | constant flux | ||
| energy | 10 day | 28 day | ||||||
| [1] | [cm-2s-1] | [1] | [GeV] | [GeV] | [GeV] | [1] | [1] | |
| TeV detected: | ||||||||
| 3C 66A (catalog ) | 2221 | 96.7 5.82 3.39 | 1.93 0.04 0.04 | 1.54 | 111aaPhoton-like events were selected for study using the so-called “diffuse” class cuts. Using a stricter set of cuts (“extradiffuse”), developed to study the extragalactic diffuse radiation (Abdo et al., 2009e), the highest energy photons from 3C 66A and I Zw 187 were eliminated, giving GeV and GeV respectively for the two sources. | 54 | ||
| RGB J0710+591 (catalog ) | 42 | 0.087 0.049 0.076 | 1.21 0.25 0.02 | 15.29 | 74 | 4 | ||
| S5 0716+714 (catalog ) | 1668 | 79.9 4.17 2.84 | 2.16 0.04 0.05 | 0.82 | 63 | 9 | ||
| 1ES 0806+524 (catalog ) | 102 | 2.07 0.38 0.71 | 2.04 0.14 0.03 | 1.54 | 30 | 4 | ||
| 1ES 1011+496 (catalog ) | 889 | 32.0 0.27 0.29 | 1.82 0.05 0.03 | 1.50 | 168 | 32 | ||
| Markarian 421 (catalog ) | 3980 | 94.3 3.88 2.60 | 1.78 0.03 0.04 | 1.35 | 801 | 155 | ||
| Markarian 180 (catalog ) | 50 | 5.41 1.69 0.91 | 1.91 0.18 0.09 | 1.95 | 14 | 2 | ||
| 1ES 1218+304 (catalog ) | 147 | 7.56 2.16 0.67 | 1.63 0.12 0.04 | 5.17 | 356 | 31 | ||
| W Comae (catalog ) | 754 | 41.7 3.40 2.46 | 2.02 0.06 0.05 | 1.13 | 26 | 18 | ||
| 3C 279 (catalog ) | 6865 | 287 7.13 10.2 | 2.34 0.03 0.04 | 0.59 | 28 | 21 | ||
| PKS 1424+240 (catalog ) | 800 | 34.35 2.60 1.37 | 1.85 0.05 0.04 | 1.50 | 137 | 30 | ||
| H 1426+428 (catalog ) | 38 | 1.56 1.05 0.29 | 1.47 0.30 0.11 | 8.33 | 19 | 3 | ||
| PG 1553+113 (catalog ) | 2009 | 54.8 3.63 0.85 | 1.69 0.04 0.04 | 2.32 | 157 | 76 | ||
| Markarian 501 (catalog ) | 649 | 22.4 2.52 0.13 | 1.73 0.06 0.04 | 2.22 | 127 | 50 | ||
| 1ES 1959+650 (catalog ) | 306 | 25.1 3.49 2.83 | 1.99 0.09 0.07 | 1.60 | 75 | 21 | ||
| PKS 2005-489 (catalog ) | 246 | 22.3 3.09 2.14 | 1.91 0.09 0.08 | 1.01 | 71 | 8 | ||
| PKS 2155-304 (catalog ) | 3354 | 109 4.45 3.18 | 1.87 0.03 0.04 | 1.13 | 299 | 46 | ||
| BL Lacertae (catalog ) | 310 | 51.6 5.81 12.2 | 2.43 0.10 0.08 | 0.85 | 70 | 4 | ||
| 1ES 2344+514 (catalog ) | 37 | 3.67 2.35 1.62 | 1.76 0.27 0.23 | 5.28 | 53 | 3 | ||
| M 87 (catalog ) | 31 | 7.56 2.70 2.24 | 2.30 0.26 0.14 | 1.11 | 8 | 1 | ||
| Centaurus A (catalog ) | 308 | 70.8 5.97 5.80 | 2.90 0.11 0.07 | 0.47 | 6 | 4 | ||
| TeV non-detected: | ||||||||
| 1ES 0033+595 (catalog ) | 137 | 20.3 5.11 1.74 | 2.00 0.13 0.07 | 2.58 | 150 | 16 | ||
| MG J0509+0541 (catalog ) | 217 | 19.7 3.78 0.70 | 2.01 0.11 0.06 | 1.95 | 31 | 12 | ||
| PKS B0521-365 (catalog ) | 148 | 26.6 3.50 3.34 | 2.52 0.13 0.10 | 0.64 | 7 | 2 | ||
| 1ES 0647+250 (catalog ) | 95 | 4.09 1.39 1.01 | 1.66 0.15 0.09 | 4.54 | 247 | 16 | ||
| PKS 0829+046 (catalog ) | 187 | 27.3 3.37 1.08 | 2.43 0.11 0.04 | 0.70 | 4 | 2 | ||
| 1ES 1028+511 (catalog ) | 52 | 3.88 1.43 0.57 | 1.72 0.19 0.08 | 3.07 | 48 | 2 | ||
| RGB J1117+202 (catalog ) | 116 | 7.12 1.75 0.36 | 1.79 0.13 0.06 | 2.37 | 46 | 6 | ||
| 1ES 1118+424 (catalog ) | 33 | 2.31 1.27 0.41 | 1.71 0.26 0.08 | 3.99 | 27 | 3 | ||
| ON 325 (catalog ) | 761 | 42.3 3.68 2.98 | 1.99 0.06 0.06 | 1.26 | 45 | 12 | ||
| 3C 273 (catalog ) | 3569 | 224. 6.78 8.49 | 2.79 0.04 0.04 | 0.45 | 11 | 5 | ||
| RX J1417+2543 (catalog ) | 31 | 2.56 2.14 0.65 | 1.68 0.39 0.08 | 6.02 | 41 | 1 | ||
| 1ES 1440+122 (catalog ) | 33 | 1.05 0.06 0.10 | 1.18 0.27 0.03 | 17.04 | 19 | 2 | ||
| RX J1725.0+1152 (catalog ) | 152 | 18.1 3.93 0.86 | 2.01 0.13 0.05 | 1.87 | 39 | 11 | ||
| I Zw 187 (catalog ) | 31 | 5.41 2.23 0.68 | 1.95 0.23 0.03 | 2.22 | 77aaPhoton-like events were selected for study using the so-called “diffuse” class cuts. Using a stricter set of cuts (“extradiffuse”), developed to study the extragalactic diffuse radiation (Abdo et al., 2009e), the highest energy photons from 3C 66A and I Zw 187 were eliminated, giving GeV and GeV respectively for the two sources. | 3 | ||
| 1ES 1741+196 (catalog ) | 46 | 4.93 2.17 0.17 | 1.80 0.22 0.03 | 3.58 | 37 | 3 | ||
| 1ES 2321+419 (catalog ) | 88 | 6.76 2.77 0.79 | 1.78 0.20 0.09 | 3.90 | 42 | 14 | ||
| NGC 1275 (catalog ) | 1351 | 99.1 5.13 3.87 | 2.20 0.04 0.06 | 0.80 | 18 | 13 | ||
| Low-energy band (0.2 GeV–1 GeV) | High-energy band (1 GeV–300 GeV) | |||||
|---|---|---|---|---|---|---|
| Name | Flux | Photon Index | Decorr. | Flux | Photon Index | Decorr. |
| energy | energy | |||||
| [cm-2s-1] | [1] | [GeV] | [cm-2s-1] | [1] | [GeV] | |
| TeV detected: | ||||||
| 3C 66A (catalog ) | 80.5 7.2 | 1.97 0.16 | 0.52 | 17.3 1.0 | 1.98 0.04 | 2.47 |
| S5 0716+714 (catalog ) | 65.8 1.7 | 2.20 0.05 | 0.37 | 12.8 2.2 | 2.37 0.09 | 2.17 |
| 1ES 1011+496 (catalog ) | 23.2 3.1 | 2.11 0.25 | 0.47 | 4.6 0.8 | 1.96 0.09 | 3.08 |
| Markarian 421 (catalog ) | 74.4 4.2 | 1.93 0.11 | 0.47 | 9.6 0.9 | 1.78 0.04 | 3.71 |
| W Comae (catalog ) | 33.7 3.9 | 1.92 0.21 | 0.51 | 5.5 1.1 | 2.16 0.10 | 2.52 |
| 3C 279 (catalog )aaPre-flaring period (MJD). | 142 7.61 | 2.49 0.11 | 0.40 | 16.2 1.5 | 2.55 0.12 | 1.98 |
| 3C 279 (catalog )bbPeak flaring (MJD). | 512.6 18.3 | 2.00 0.08 | 0.43 | 67.9 4.5 | 2.49 0.09 | 1.98 |
| PKS 1424+240 (catalog ) | 25.9 3.0 | 1.84 0.22 | 0.50 | 8.41 0.63 | 1.82 0.05 | 1.77 |
| PG 1553+113 (catalog ) | 34.8 4.6 | 1.52 0.25 | 0.58 | 5.6 0.6 | 1.70 0.05 | 4.14 |
| PKS 2155-304 (catalog ) | 78.6 4.5 | 1.72 0.11 | 0.49 | 13.2 1.2 | 1.96 0.04 | 2.71 |
| TeV non-detected: | ||||||
| ON 325 (catalog ) | 32.3 4.4 | 1.98 0.23 | 0.48 | 8.5 1.7 | 2.32 0.11 | 2.25 |
| 3C 273 (catalog ) | 206.5 6.8 | 2.66 0.07 | 0.38 | 62.5 17.7 | 3.42 0.17 | 1.47 |
| NGC 1275 (catalog ) | 81.6 5.4 | 2.09 0.13 | 0.46 | 14.5 2.9 | 2.40 0.11 | 2.25 |
| Flux limit, assuming | ||
|---|---|---|
| Name | ||
| [cm-2s-1] | ||
| TeV detected: | ||
| RGB J0152+017 (catalog ) | 2.02 | 5.01 |
| 1ES 0229+200 (catalog ) | 1.94 | 5.12 |
| 1ES 0347-121 (catalog ) | 0.80 | 1.81 |
| PKS 0548-322 (catalog ) | 0.59 | 3.14 |
| 1ES 1101-232 (catalog ) | 0.83 | 4.40 |
| H 2356-309 (catalog ) | 0.28 | 7.25 |
| Extrapolation at 100 GeV | Extrapolation over 0.2 TeV to 10 TeV band | ||
|---|---|---|---|
| Name | Photon index - | Integral flux - | |
| [cm-2s-1TeV-1] | [1] | [] | |
| TeV detected: | |||
| 3C 66A (catalog ) | 1.98 0.34 | 4.26 0.02 | |
| RGB J0710+591 (catalog ) | 0.61 0.38 | 1.74 0.11 | |
| S5 0716+714 (catalog ) | 0.34 0.12 | 3.20 0.03 | |
| 1ES 0806+524 (catalog ) | 0.18 0.11 | 2.65 0.10 | |
| 1ES 1011+496 (catalog ) | 1.05 0.33 | 2.82 0.04 | |
| Markarian 421 (catalog ) | 5.86 0.92 | 1.90 0.02 | |
| Markarian 180 (catalog ) | 0.17 0.12 | 2.09 0.13 | |
| 1ES 1218+304 (catalog ) | 0.94 0.38 | 2.46 0.07 | |
| W Comae (catalog ) | 0.46 0.18 | 2.44 0.04 | |
| 3C 279 (catalog ) | 0.35 0.09 | 5.25 0.02 | |
| PKS 1424+240 (catalog ) | 1.47 0.30 | 1.85 0.03 | |
| H 1426+428 (catalog ) | 0.42 0.32 | 1.85 0.18 | |
| PG 1553+113 (catalog ) | 3.32 0.56 | 5.27aaExtrapolated assuming . 0.02 | |
| 2.06bbExtrapolated assuming . 0.03 | |||
| Markarian 501 (catalog ) | 1.71 0.44 | 1.86 0.05 | |
| 1ES 1959+650 (catalog ) | 0.53 0.20 | 2.17 0.06 | |
| PKS 2005-489 (catalog ) | 0.68 0.26 | 2.20 0.06 | |
| PKS 2155-304 (catalog ) | 3.11 0.54 | 2.37 0.02 | |
| BL Lacertae (catalog ) | 0.10 0.05 | 2.72 0.08 | |
| 1ES 2344+514 (catalog ) | 0.23 0.20 | 1.94 0.16 | |
| Centaurus A (catalog ) | 0.010 0.006 | 2.90 0.11 | |
| M 87 (catalog ) | 0.027 0.033 | 2.33 0.22 | |
| TeV non-detected: | |||
| 1ES 0033+595 (catalog ) | 0.39 0.19 | 2.35 0.08 | |
| MG J0509+0541 (catalog ) | 0.36 0.17 | 2.01 0.07 | |
| PKS B0521-365 (catalog ) | 0.03 0.02 | 2.74 0.14 | |
| 1ES 0647+250 (catalog ) | 0.43 0.22 | 2.61 0.08 | |
| PKS 0829+046 (catalog ) | 0.05 0.03 | 3.24 0.09 | |
| 1ES 1028+511 (catalog ) | 0.28 0.20 | 3.56 0.10 | |
| RGB J1117+202 (catalog ) | 0.40 0.22 | 2.40 0.09 | |
| 1ES 1118+424 (catalog ) | 0.19 0.17 | 2.25 0.15 | |
| ON 325 (catalog ) | 0.28 0.12 | 3.12 0.04 | |
| 3C 273 (catalog ) | 0.05 0.01 | 3.52 0.03 | |
| RX J1417+2543 (catalog ) | 0.24 0.28 | 2.79 0.18 | |
| 1ES 1440+122 (catalog ) | 0.80 0.48 | 1.68 0.11 | |
| RXJ 1725.0+1152 (catalog ) | 0.33 0.18 | 2.08 0.10 | |
| I Zw 187 (catalog ) | 0.14 0.13 | 2.17 0.16 | |
| 1ES 1741+196 (catalog ) | 0.27 0.20 | 2.14 0.13 | |
| 1ES 2321+419 (catalog ) | 0.41 0.29 | 2.01 0.13 | |
| NGC 1275 (catalog ) | 0.34 0.14 | 2.26 0.04 | |
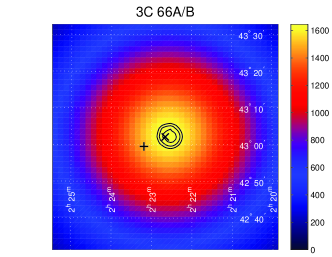
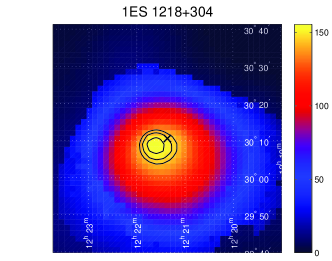
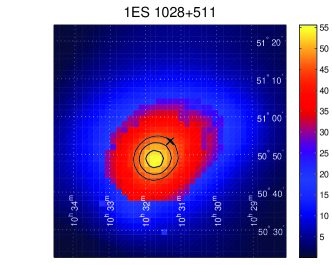
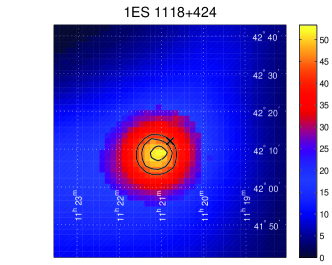
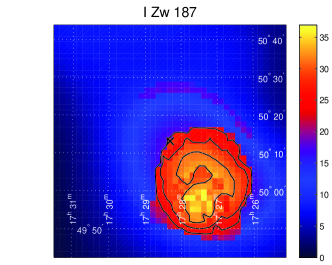
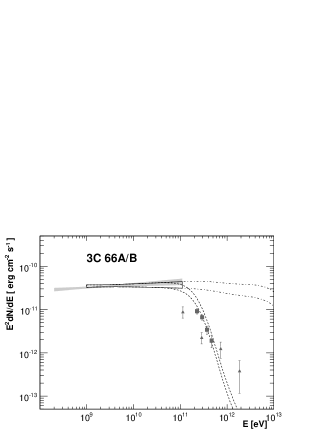


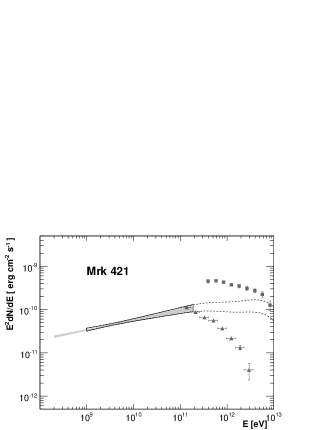
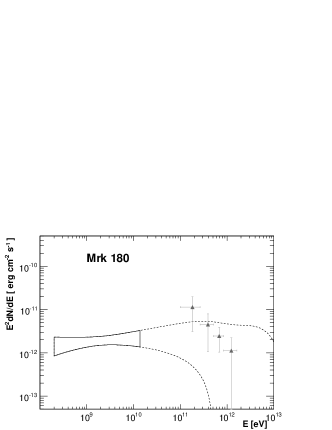
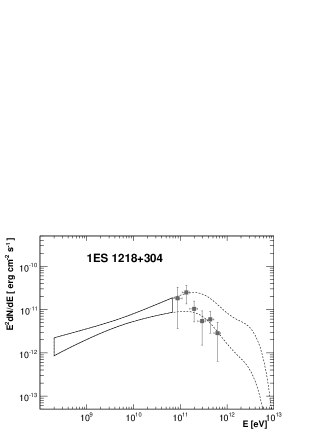
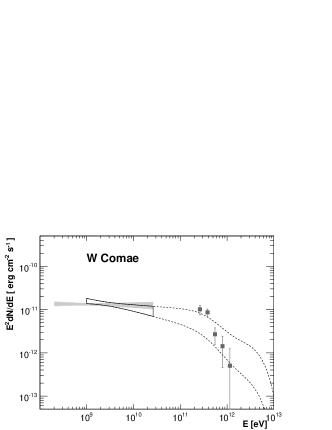
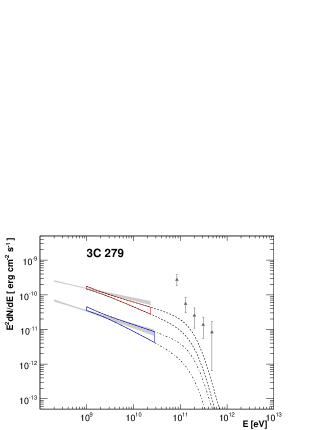
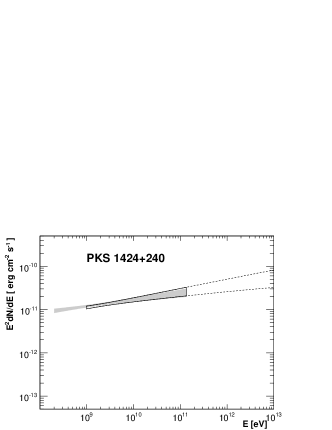

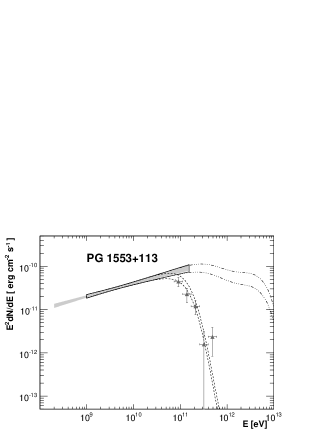

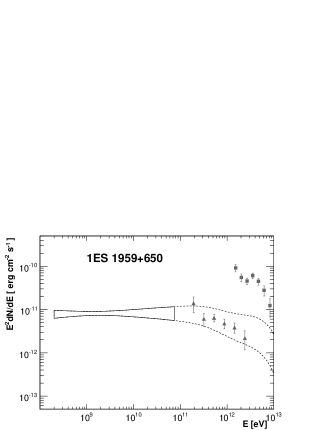


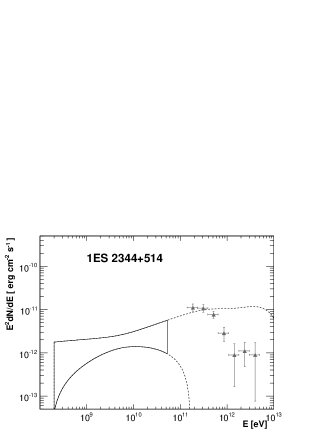
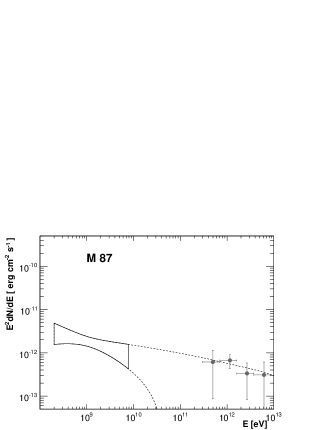
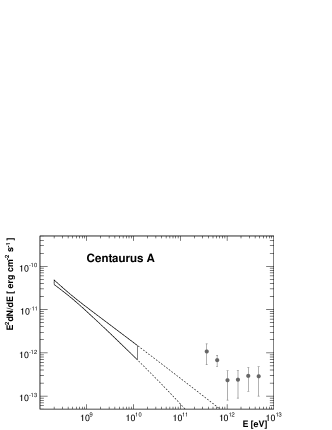
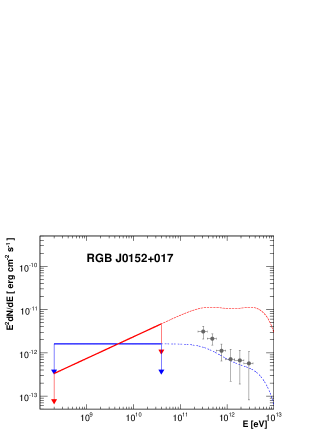

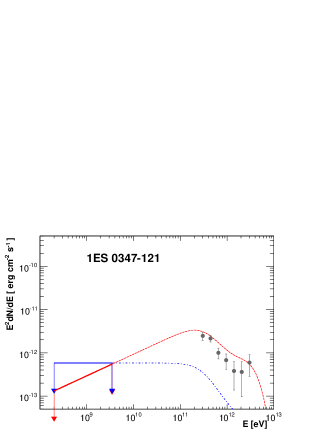
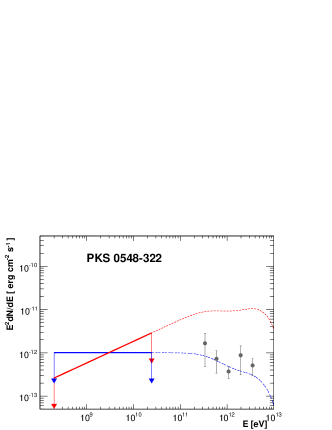
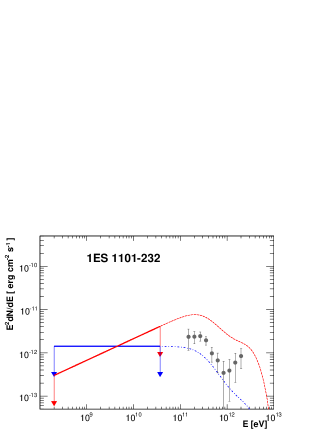
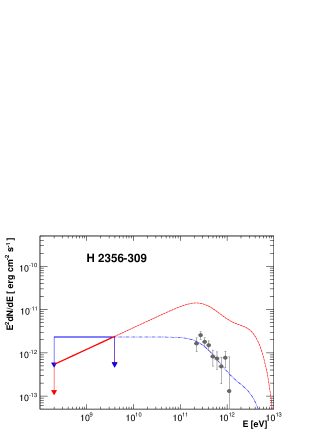
Flux – [cm-2s-1]


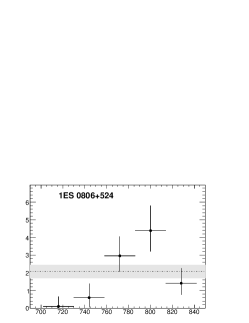


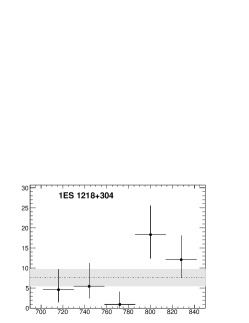


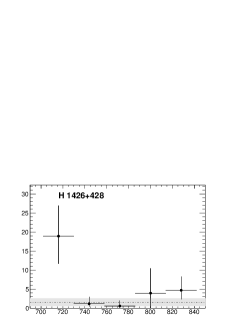

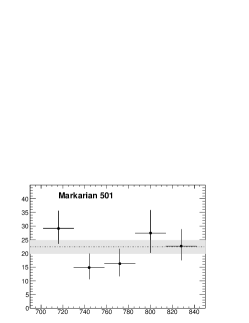
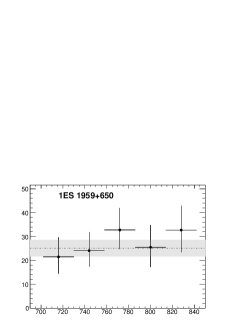
Date – MJD-54000 [days]
Flux – [cm-2s-1]

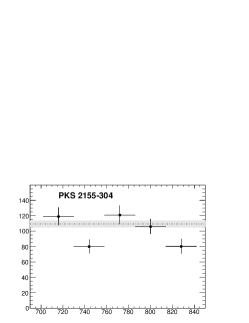

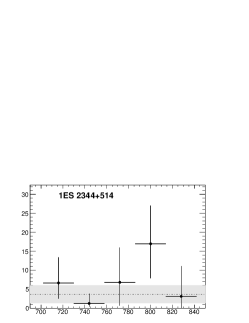


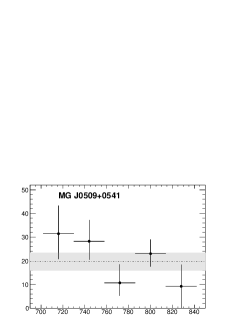


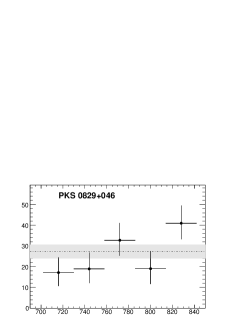

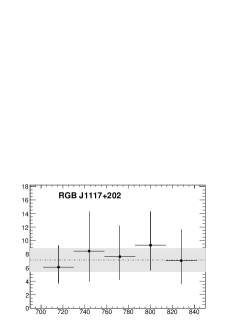

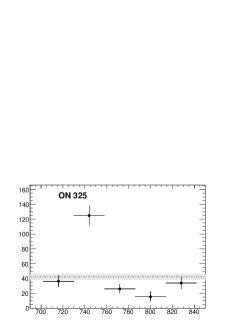
Date – MJD-54000 [days]
Flux – [cm-2s-1]


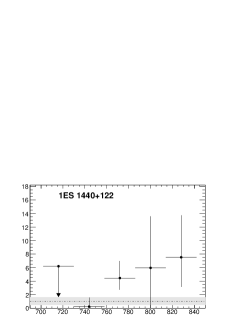


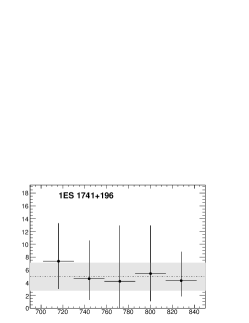


Date – MJD-54000 [days]
Flux – [cm-2s-1]


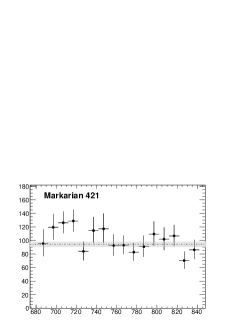


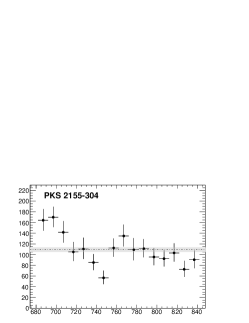

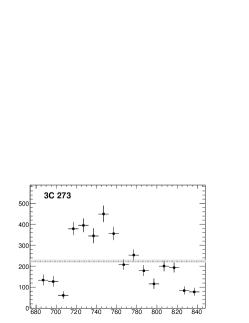
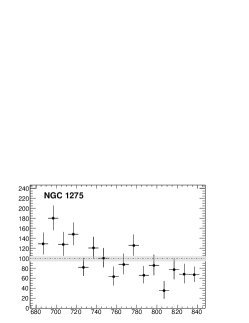
Date – MJD-54000 [days]