Spectral evolution in an insulator exhibiting linear specific heat
Abstract
We investigate the spectral evolution of an antiferromagnetic insulator, La0.2Sr0.8MnO3 exhibiting linear specific heat using state-of-the-art high resolution photoemission spectroscopy. Experimental spectral functions exhibit Fermi liquid like energy dependence at all the temperatures studied. Room temperature spectrum possess finite density of states at the Fermi level that vanishes generating a soft gap at about 260 K (the magnetic transition temperature). High resolution spectra reveal a hard gap in the magnetically ordered phase (C-type antiferromagnet). These results indicate signature of an amorphous phase coexisting with the long range ordered phase in these materials.
pacs:
71.30.+h, 75.47.Lx, 75.40.-s, 71.10.CaSpecific heat of an electron gas has a linear dependence with temperature and the specific heat coefficient, can be expressed as , where is the Boltzmann constant and is the density of states (DOS) at the Fermi level, . Here, is a linear function of . However, various experiments reported finite value of in insulating materials such as vitreous silica, germania, selenium etc [1]. Subsequently, it was proposed [2, 3] that in insulating materials the charge carriers can tunnel through the potential barrier among various local minima. The energy difference between the local minima will vary continuously in an amorphous system that leads to a linear term in specific heat. Interestingly, various studies in manganites reveal large in insulating crystalline compositions [4, 5]. In order to explain such anomalous observations, it was suggested that the DOS at is finite but localized that gives rise to finite and insulating transport. The other suggestion is the possibility of spin glass phase [6].
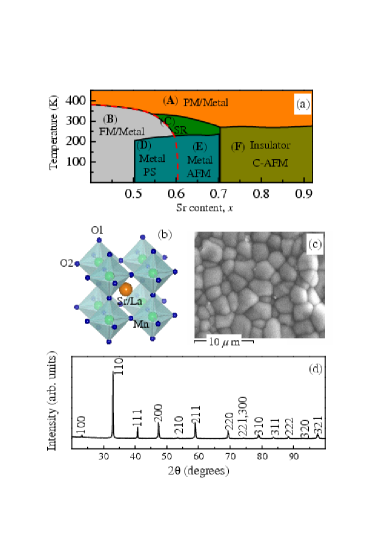
Hole doped manganites [7, 8, 4, 9, 10, 11], in general, have attracted a great deal of attention during last two decades followed by the discovery of colossal magnetoresistance (CMR) leading to potential technological applications. In addition, plethora of interesting phases are observed due to the interplay between spin, charge, orbital and lattice degrees of freedom. While CMR effect observed at low doping levels, the higher doping regime also displays interesting and complex phase diagram as shown in Fig. 1(a) in the case of La1-xSrxMnO3 [12, 13]. Clearly, the system lies in the proximity of ferromagnetic and antiferromagnetic ground states; phase coexistence is observed in the composition range (0.5 0.6). Thus, such systems may lead to spin amorphicity that contributes as finite in the specific heat data.
However, the observation of finite in the insulating materials far away from compositions having phase coexistence is curious. For example, La0.2Sr0.8MnO3 undergoes a transition from paramagnetic metallic phase to C-type antiferromagnetic insulating phase (moments in -plane are antiparallel and inter-plane coupling is ferromagnetic). in La0.2Sr0.8MnO3 is 5.6 mJ/(mole.K) [14], which is very close to the values observed in metallic compositions [4]. The crystal structure is perovskite derived as shown in Fig. 1(b). Here, we report our results on La0.2Sr0.8MnO3 employing high resolution photoemission spectroscopy. We find that DOS at is finite at room temperature although the electrons possess strong local character. Antiferromagnetic transition leads to an energy gap at . The spectral function exhibits Fermi liquid like energy dependence at all the temperatures studied (even in the gapped phase).
The samples were prepared by solid-state reaction route as reported elsewhere [15]. Scanning electron microscopic (SEM) picture [see Fig.1(c)] reveals large grain size ( 3 ) that could be achieved by long sintering at the final preparation temperature. The energy dispersive analysis of -rays on different grains and different location on same grain indicate absence of impurity phase and homogeneity of the composition. The room temperature powder -ray diffraction (XRD) experiment was carried out using PHILIPS X’Pert diffractometer with Cu K radiation. All the reflections were indexed with cubic structure (space group ) with lattice parameter of 3.826 Å, (see Fig 1(d)). No trace of impurity is found in the XRD pattern. The dc magnetization measurements (4 - 330K), carried out at 5 Tesla field in a superconducting quantum interference device (Quantum design) exhibits a distinct hump at about 265 K [see Fig. 2(a)] indicating transition to antiferromagnetic phase.
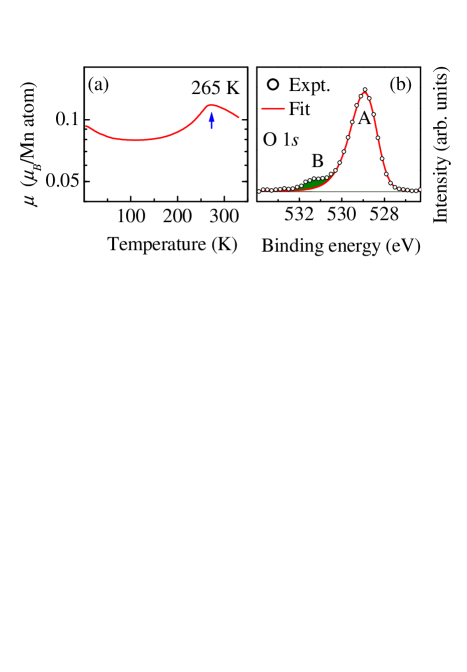
The photoemission measurements at different temperatures were carried out using monochromatic Al K ( = 1486.6 eV), He I ( = 20.2 eV) and He II ( = 40.8 eV) sources, and Gammadata Scienta analyzer SES2002. The energy resolution for -ray photoemission (XP), He I and He II measurements are 0.3 eV, 1.4 meV and 4.2 meV, respectively. The base pressure during the measurements was 4 10-11 Torr. The sample surface was cleaned by scraping in-situ with a diamond file. No intensity was observed for C 1 signal. A typical O 1 spectrum collected at room temperature is shown in Fig 2(b) exhibiting a sharp feature, A at 529 eV binding energy and a weak feature, B at about 531.3 eV binding energy. The feature B can be attributed to the surface oxygens and/or adsorbed impurities. The complete dominance of the feature A ensures high purity of the samples.
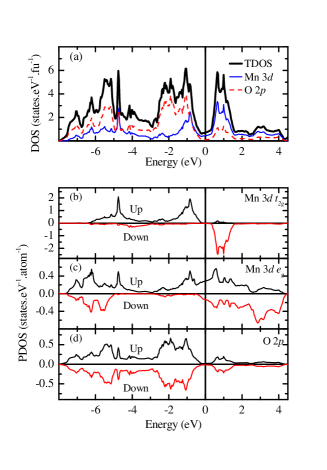
The band structure calculations were carried out by using a linearized muffin-tin orbital method within the atomic sphere approximation (LMTART 6.61) [16]. The muffin-tin radii used are 3.523, 3.523, 2.025, 1.591 a.u. for La, Sr, Mn and O respectively. The charge density and effective potential were expanded in spherical harmonics up to = 6 inside the sphere. The exchange correlation functional of the density functional theory was taken after Vosko et al [17]. The convergence in the total energy was set to 10-5 Ryd/cell. (8,8,8) divisions of the Brillouin zone along three directions for the tetrahedron integration were used to calculate DOS. The calculations were performed for La0.25Sr0.75MnO3 in the C-type antiferromagnetic phase.
The calculated DOS corresponding to the valence band are shown in Fig. 3. Mn 3 states split into and bands due to the crystal field of MnO6 octahedra. The bonding and antibonding up spin bands are centered around -5 eV and -1 eV, respectively; the energy separation is about 4 eV. Almost equal weight of the partial DOS in bonding and antibonding bands indicates its strong mixing with the O 2 electronic states. The down spin partial DOS appear above the Fermi level as expected for Mn3+/Mn4+ high spin state. The bonding bands appear between -4 to -8 eV. The contribution at the Fermi level, arises primarily due to the up spin electronic states. O 2 partial DOS has large contributions in the bonding and antibonding energy regions. The non-bonding O 2 contributions appear in the energy range of -1 to -3 eV.
The experimental valence band spectra are shown in Fig 4. There are three intense discernible features A, B and C in both XP and He II spectra. First, we discuss the observations in the room temperature spectra. The feature A in the XP spectrum appears at slightly higher binding energy compared to that in the He II spectrum, while the features B and C appear to have similar binding energies. The feature C intensity is reduced slightly in the He II spectrum compared to that in the XP spectrum. The contributions from Mn 3 states are dominant in the XP spectrum and that from O 2 states are dominant in the He II spectrum due to photoemission cross section. Thus, these observations suggest strongly mixed character of the features along with a small enhancement in Mn 3 contribution in feature C. Comparing these results with the calculated DOS, it is evident that the feature A represents the photoemission signal from bonding bands (both and ), the feature B is the non-bonding O 2 contributions and the feature C is the antibonding bands. The peaking of feature A at slightly higher binding energy in the XP spectrum presumably due to the enhanced intensity of the bonding bands contributions at XP energies. In addition, a weak feature D can also be observed (see inset) in the vicinity of the Fermi level, which is dominant in the XP spectra and represent the electronic states having symmetry as evident in Fig. 3(c). All these spectra exhibit negligible intensity at the Fermi level suggesting proximity to an insulating phase. This is consistent with the results from resistivity measurements.
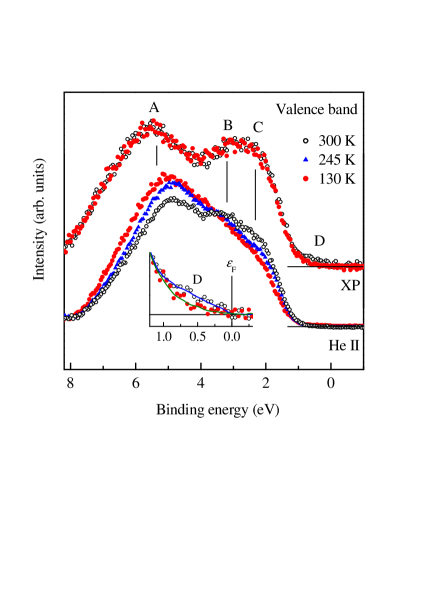
The energy and intensity of the features in XP spectrum remain almost identical down to 130 K (much below the magnetic transition temperature of 265 K). On the other hand, the He II spectra (normalized by the intensity of non-bonding O 2 signal) exhibit significant spectral weight transfer. The feature A becomes stronger at lower temperatures with subsequent reduction in intensity of feature C. Since the O 2 character is dominant in the He II spectra, these spectral evolution suggests the shift of O 2 eigen energies towards higher binding energies. The antiferromagnetic coupling among Mn moments in the -plane is mediated by O 2 electronic states (superexchange interaction). It appears that the onset of antiferromagnetic ordering leads to a higher degree of localization of the O 2 electrons.
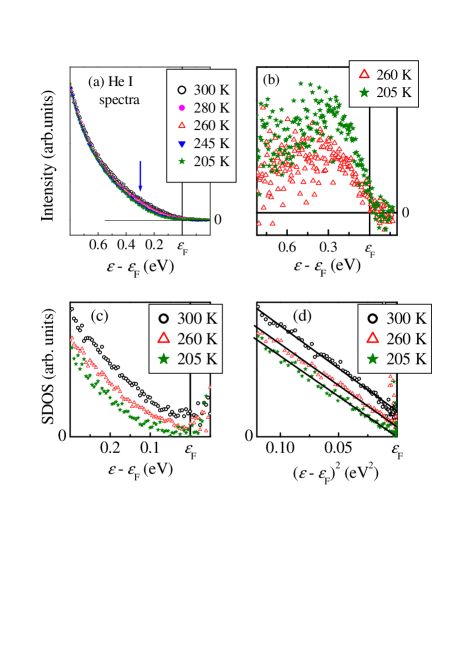
The inset of Fig. 4 reveals significant reduction of intensity of the band (feature D) indicating an opening of a hard gap in the antiferromagnetic phase. In order to investigate this with better clarity, we probed this energy region with very high energy resolution of 1.4 meV. The spectra collected at different temperatures are shown in Fig. 5(a). Evidently the intensity at in the room temperature spectrum is weak and a change in intensity is observed near the arrow. To visualize the spectral changes, we have subtracted all the spectra from the room temperature spectrum. The subtracted intensities shown in Fig. 5(b) exhibit a peak at about 0.3 eV which enhances gradually with the increase in temperature difference. Qualitatively, it is expected that 0.2 electrons in the bands would pin the Fermi level at the lower half of the conduction band as seen in Fig. 3(c). However, the experimental results suggests that these electrons have significant local character that leads to the peak at 0.3 eV and weak intensity at . Interestingly, the spectral intensity of this local feature shifts towards higher binding energies at lower temperatures as also evidenced in the XP spectra shown in the inset of Fig. 4.
The spectral density of states (SDOS) are extracted by dividing the experimental spectra by the corresponding Fermi-Dirac distribution function. The SDOS at room temperature [see Fig. 5(c)] exhibits a dip at (pseudogap) which leads to a soft gap at 260 K and a hard gap in the antiferromagnetic phase. It is to note here that the Neél temperature, marks the onset of the first order phase transition in this compound, which involves nucleation and growth process. Hence, pseudogap can be attributed to the signature of gapped low temperature phase nucleated above . The band gap below can be attributed to the relocation of the Brillouin zone boundary due to antiferromagnetic ordering in the -plane. In addition, the hard gap and vanishing of 0.3 eV features indicate that the electrons become more localized and shifts to higher binding energies in the magnetically ordered phase. A plot of the SDOS as a function of exhibit a linear dependence in both paramagnetic and antiferromagnetic phases indicating Fermi-liquid like behavior of the localized electrons/quasiparticles.
All the above results establish that the low temperature phase is insulating due to finite energy gap at although is finite and large (similar to that in the metallic phase of these compounds). Since, other low energy excitations involving electron-phonon, electron-magnon etc. do not contribute in the linear term of specific heat, it is clear that some kind of glassy phase/amorphicity is present in this systems. The issue of phase separation and its implication in the colossal magnetoresistance in these systems are widely discussed [18, 19]. It was also suggested that the magnetic transition is accompanied by the formation of a pseudogap phase [20] similar to that observed in high temperature superconductors [21]. Thus, it is tempting to correlate the behavior of this compound with the ones showing precursor effects, phase separations etc. These results emphasizes the need to consider a phase that has sufficient amorphicity and/or softness [22] coexisting with antiferromagnetic insulating phase that may contribute as a linear term in the specific heat. This is not unrealistic as electrons are localized and hence, 20% La concentration at the Sr sites in LaSrMnO3 will naturally induce disorder.
In summary, we have investigated the evolution of the electronic structure of La0.2Sr0.8MnO3 with temperatures using high resolution photoemission spectroscopy to probe the origin of linear term in the specific heat in its insulating phase. We observe interesting change in the oxygen 2 bands contributing in the valence band spectra. Spectral intensity is finite at the Fermi level in the paramagnetic phase and the electronic states seems to have dominant local character (peak of intensity appears around 0.3 eV). The spectral functions close to the Fermi level exhibit opening of a hard gap in the antiferromagnetic insulating phase via the formation of a soft Coulomb gap at the antiferromagnetic transition temperature. The energy dependence of the spectral function is Fermi liquid like in all the phases. These results indicate possibility of an amorphous phase involving localized quasiparticles within the long range ordered phase.
References
References
- [1] Zeller R C and Pohl R O 1971 Phys. Rev. B 4 2029.
- [2] Anderson P W, Halperin B I, Verma C M 1972 The Philosophical Magazine. 25 1.
- [3] Phillip W A 1972 J. Low temperature Physics. 7 351.
- [4] Salamon M B and Jaime M 2001 Rev. Mod. Phys. 73 583 .
- [5] Banerjee A, Rawat R, Mukherjee K, and Chaddah P 2009 Phys. Rev. B. 79 212403.
- [6] Ghivelder L and Abrego Castillo I, Gusmo M A, Alonso J A, Cohen L F 1999 Phys. Rev. B. 60 12184.
- [7] Coey J M D, Viret M and Von Molnár S 1999 Adv. Phys. 48 167.
- [8] Dagotto E, Hotta T, Moreo A 2001 Physics Reports. 344 1.
- [9] Tokura Y 2003 Physics Today. 56, 50.
- [10] Colossal Magnetoresistance, Charge ordering and related properties of Manganese oxides, edited by C. N. R. Rao and B. Raveau (World Scientific Publishing Co. Pvt. Ltd., 1998)
- [11] Ramakrishnan T V 2008 Current Science. 95, 1284.
- [12] Hemberger J, Krimmel A, Kurz T, Krug von Nidda H -A, Ivanov V Yu, Mukhin A A, Balbashov A M, and Loidl A 2002 Phys. Rev. B. 66, 094410.
- [13] Chmaissem O, Dabrowski B, Kolesnik S, Mais J, Jorgensen J D, and Short S 2003 Phys. Rev. B. 67 094431.
- [14] Bindu R, Maiti K , Rawat R , Khalid S 2008 Appl. Phys. Lett. 92 121906.
- [15] Bindu R 2004 Eur. Phys. J. B. 37, 321.
- [16] Savrasov S Y 1996 Phys. Rev. B. 54 16470; 2005 Z. Kristallogr. 220 555
- [17] Vosko S H, Wilk L, and Nusair M 1980 Can. J. Phys. 58 1200.
- [18] Adriana Moreo, Seiji Yunoki, and Elbio Dagotto 1999 Science. 283 2034.
- [19] Ramakrishnan T V 2007 J. Phys.: Condens. Matter. 19 125211.
- [20] Mannella N, Yang W L, Zhou X J, Zheng H, Mitchell J F, Zaanen J, Devereaux T P, Nagaosa N, Hussain Z, and Shen Z -X 2005 Nature 438, 474.
- [21] Kanigel A et al. 2006 Nature Phys. 2, 447.
- [22] Milward G C, Calderón M J, and Littlewood P B 2005 Nature 433, 607.