11email: flamare@ast.obs-mip.fr
Spectral classification of emission-line galaxies from the Sloan Digital Sky Survey
Abstract
Aims. We study the spectral classification of emission-line galaxies as star-forming galaxies or Active Galactic Nuclei (AGNs). From the Sloan Digital Sky Survey (SDSS) high quality data, we define an improved classification to be used for high redshift galaxies
Methods. We classify emission-line galaxies of the SDSS according to the latest standard recipe using [Oiii]5007, [Nii]6584, [Sii]6717+6731, H, and H emission lines. We obtain four classes: star-forming galaxies, Seyfert 2, LINERs, and composites. We then examine where these galaxies fall in the blue diagram used at high redshift (i.e. log([Oiii]5007/H) vs. log([Oii]3726+3729/H).
Results. We define new improved boundaries in the blue diagram for star-forming galaxies, Seyfert 2, LINERs, SF/Sy2, and SF-LIN/comp classes. We maximize the success rate to 99.7% for the detection of star-forming galaxies, to 86% for the Seyfert 2 (including the SF/Sy2 region), and to 91% for the LINERs. We also minimize the contamination to 16% in the region of star-forming galaxies. We cannot reliably separate composites from star-forming galaxies and LINERs, but we define a SF/LIN/comp region where most of them fall (64%).
Key Words.:
galaxies: fundamental parameters1 Introduction
Spectral classification of emission-line galaxies at low redshift is now routinely done with high quality calibrations. Using a set of five strong emission lines – [Oiii]5007, [Nii]6584, [Sii]6717+6731, H, and H –, one can reliably distinguish star-forming galaxies, Seyfert 2 galaxies, Low Ionization Nuclear Emission Region (hereafter LINER, see Heckman, 1980), and composite galaxies with both star-forming regions and an active galactic nucleus (hereafter AGN). The equations to do such classification have been derived successively by several authors (Baldwin et al., 1981; Veilleux & Osterbrock, 1987; Kewley et al., 2001; Kauffmann et al., 2003; Kewley et al., 2006, among others).
At redshifts greater than , the [Nii]6584, [Sii]6717+6731, and H emission lines get redshifted out of the wavelength range of all major optical spectroscopic surveys. Therefore, diagnostic diagrams need to based only on emission lines observed in the blue part of the spectra: [Oiii]5007, [Oii]3726+3729, and H. Such diagrams, which have been used in the past e.g. by Tresse et al. (1996) or Rola et al. (1997), and which we call the “blue diagram”, have been recently studied again by Lamareille et al. (2004). The latter have derived, from the 2dFGRS data, equations to distinguish star-forming galaxies from AGNs. They have also shown that a region exists in this diagram where both star-forming galaxies and AGNs fall (hereafter the “uncertainty region”) and thus cannot be distinguished.
With the high quality Sloan Digital Sky Survey Data Release 7 (hereafter SDSS DR7) data, it is now possible to revisit the blue diagram, and to derive new equations more compatible with the latest red classification by Kewley et al. (2006) than the ones given in Lamareille et al. (2004). We derive in particular in this paper more precise boundaries between the star-forming and AGN regions, new boundaries for the regions where AGNs or composites are mixed with star-forming galaxies, and new equations to distinguish between Seyfert 2 galaxies and LINERs in the blue diagram.
All spectral classifications, associated numbers, and figures presented in this paper have been done with the JClassif spectral classification pipeline, which is freely available at the following website: http://www.ast.obs-mip.fr/users/flamare/galaxie/. This paper is organized as follow: we recall the current classification scheme in Sect. 2, and apply it to SDSS DR7 data. Then, we define our new improved classification for high redshift galaxies in Sect. 3. Finally we show an example application our of our new classification in Sect. 4.
2 The current classification scheme
2.1 Data selection and the red classification

We use SDSS DR7 emission-line measurements of 868 492 galaxies in the redshift range . These data are available online at the following address: http://www.mpa-garching.mpg.de/SDSS/DR7/. The measurements are available for 927 552 different spectra, of which 109 219 spectra are duplicated (twice or more) observations of the same galaxy. We have averaged the measurements of duplicated spectra in order to increase the signal-to-noise ratio. Measurements which do not increase the averaged signal-to-noise ratio have been discarded. We select emission-line galaxies with the following criterion: the signal-to-noise ratio in the equivalent width of the emission lines used in our study must be greater than 5. The necessary emission lines to derive a spectral classification at low redshift are [Oiii]5007, [Nii]6584, [Sii]6717+6731, H, and H. We also need the [Oii]3726+3729 emission line which will be used to derive our new high redshift classification. We end up with 89 379 emission-line galaxies with the desired minimum signal-to-noise ratio. We sort these galaxies into four classes according to Kewley et al. (2006) classification scheme. We end up with the following numbers: 67 778 star-forming galaxies, 2 949 Seyfert 2, 4 912 LINERs, and 13 740 composites. Figure 1 shows the redshift histograms of the four classes of emission-line galaxies. We find that the targeted population has the same dependence on redshift for each of the four classes, with a peak around , except for the LINERs, whose proportion increases at low redshift as compared to the other classes. This possible bias has to be noted, even if it does not affect the classification derived in this paper that is not primarily based on relative proportions between classes.
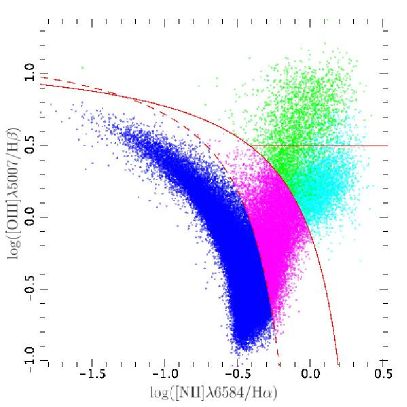
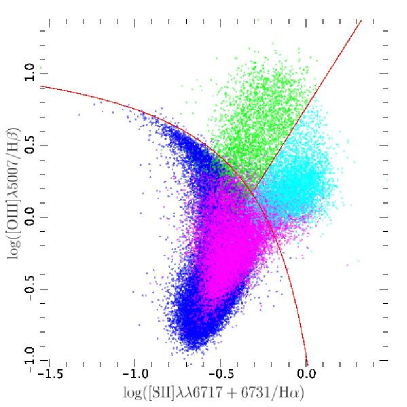
Figure 2 shows this classification in the standard BPT diagrams. In the left diagram, we remark the difference between the old classification of Seyfert 2 and LINERs (Veilleux & Osterbrock, 1987) and the new one defined by Kewley et al. (2006). The right diagram cannot be used to distinguish star-forming galaxies from composites, which fall in the same region of this diagram. This effect has been clearly explained by Stasińska et al. (2006) with photoionization models: the [Oiii]5007/H vs. [Nii]6584/H diagnostic diagram is the only one where composites and LINERs clearly separate from star-forming galaxies thanks to the so-called “seagull wings”. The same applies to LINERs and composites which are not clearly separated in the [Oiii]5007/H vs. [Sii]6717+6731/H diagnostic diagram. Unlike Kewley et al. (2006), we did not classify as “ambiguous” the composites which fall in the LINERs region, since this latter diagram is not accurate in separating composites and LINERs.
2.2 The blue classification
We now derive the blue classification and sort the emission-line galaxies into one of the four classes defined by Lamareille et al. (2004) with the following result : 83 654 secure star-forming galaxies, 699 secure AGNs, 3 670 candidate star-forming galaxies, and 1 356 candidate AGNs.
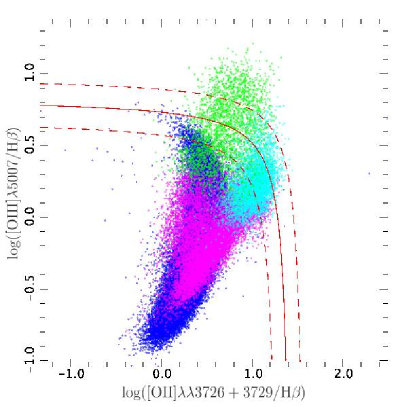
Figure 3 shows where the galaxies classified with the red classification fall in the blue diagram. The weaknesses of the blue classification as compared to the Kewley et al. (2006) classification scheme applied on the same data are evident in Fig. 3, thanks to the high quality of SDSS’s line measurement software, and to our signal-to-noise cut. The blue classification is clearly strongly biased against LINERs, which are classified for the majority of them as star-forming galaxies or candidate star-forming galaxies in the blue diagram. The uncertainty region is actually dominated by AGNs (83%), while a non-negligible number of Seyfert 2 and LINERs (38%) are misclassified as “secure” star-forming galaxies. Composites were classified as star-forming galaxies by Lamareille et al. (2004) on 2dFRGS data. This has lead them to choose an empirical separation that goes more to the right of the blue diagram than necessary.
Nevertheless, the empirical separation defined by Lamareille et al. (2004) from 2dFGRS data (the solid curve) does not follow the actual boundary between star-forming galaxies and AGNs, as seen with SDSS DR7 data. This separation may then be improved. We may also define a new uncertainty region, and a separation between Seyfert 2 and LINERs. The composites cannot be distinguished from star-forming galaxies, since they fall in the same region of the blue diagram. As mentioned above, this trend is also present in the log([Oiii]5007/H) vs. log([Sii]6717+6731/H) diagnostic diagram (see Fig. 2 right). Unfortunately, it cannot be avoided at high redshift, without the [Nii]6584 emission-line measurement.
The red classification is not sensitive to reddening since it uses ratios of emission lines which are close in wavelength. Conversely, the blue classification uses a line ratio – [Oii]3726+3729/H – involving two lines which are not close in wavelength. Using equivalent widths instead of fluxes, as in this paper, removes direct dependence on reddening. Still, the reddening does not impact exactly in the same way the flux of emission lines and the flux of the underlying stellar continuum. There is thus an indirect dependence of the [Oii]3726+3729/H line ratio with reddening when calculated with equivalent widths. Anyway this dependence is greatly reduced as compared to ratios of line fluxes.
3 The improved classification
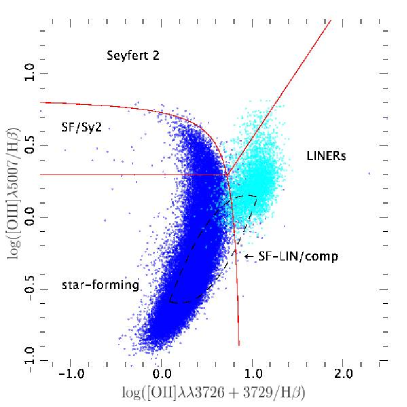
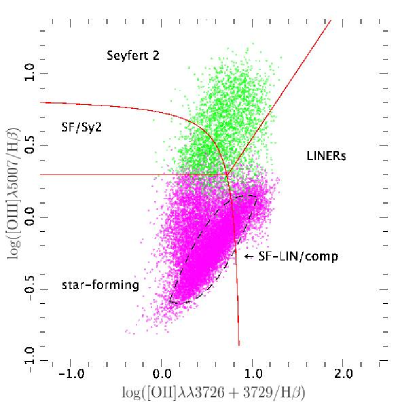
We now define the new improved blue classification of emission-line galaxies. Figure 4 shows how the objects of different classes, according to the red classification, fall in the new blue diagram.
3.1 The new star-forming – AGN boundary
We define a new boundary that follows more precisely the star-forming galaxies region, as did Kauffmann et al. (2003) compared to the Kewley et al. (2001) boundary in the log([Oiii]5007/H) vs. log([Nii]6584/H) diagnostic diagram. According to the old blue classification, 87 324 galaxies were classified as secure or candidate star-forming galaxies. But 19% of them are actually not star-forming galaxies according to the red classification. We can reduce this contamination by excluding almost all LINERs and most of the Seyfert 2 with a more conservative separation.
The equation that minimizes the contamination is :
| (1) |
It corresponds to the solid curve in Fig. 4. Star-forming galaxies are below this curve, AGNs are above. The contamination is minimized to 16%. The minimization was done by eye, keeping in mind to maximize at the same time the success rate. Figure 3 that a majority of composites and a number of Seyfert 2 cannot be excluded from the region of star-forming galaxies, which explains why the contamination cannot be zero. We check that 99.7% of the star-forming galaxies, according to the red classification, are correctly classified with the new blue classification, which is quite satisfactory.
3.2 The mixed regions
Even if almost all star-forming galaxies can be correctly classified using the blue diagram, we know that all star-forming galaxies classified according to the blue classification are not actual star-forming galaxies. As shown in the right panel of Fig. 4, a non-negligible number of Seyfert 2 galaxies fall into the region of star-forming galaxies. From this plot, we easily define the boundary of the region where star-forming galaxies become mixed with Seyfert 2:
| (2) |
This is the horizontal line in Fig. 4. We call SF/Sy2 all the galaxies above this line. Counting the region of AGNs (as defined by Eq. 1) and the region of SF/Sy2, 86% of actual AGNs are correctly classified with our new blue classification (59% as Seyfert 2, 26% as SF/Sy2). The region of SF/Sy2 is nevertheless dominated by star-forming galaxies (74%). The left panel of Fig. 4 shows that, unlike Seyfert 2, LINERs do not significantly get mixed with star-forming galaxies: 91% of them are correctly classified without the need to define a SF/LINER region.
We need also to consider the case of composites which fall in the region of star-forming galaxies and LINERs in the blue diagram: 85% of the composites are classified as star-forming galaxies, and 16% as LINERs in our new classification. We see from the right panel of Fig. 4 that almost all the composites fall by chance below the line defined in Eq. 2. Thus this line can be used to define the region where one should expect to find composites. However the majority of the composites fall in a much narrower region. We define this region with the two following inequalities:
| (3) |
where , and . We call SF-LIN/comp all the galaxies in this region, which straddles over the star-forming galaxies and the LINERs. 64% of the actual composites fall in our SF-LIN/comp region. The SF-LIN/comp region is composed by 79% of star-forming galaxies, 19% composites, and 2% LINERs.
3.3 The new Seyfert 2 – LINER boundary
We define an empirical boundary that allows one to distinguish Seyfert 2 from LINERs in the AGNs region of the blue diagram. It is shown as a solid diagonal line in Fig. 4 and follows the equation below:
| (4) |
This separation minimizes the number of misclassifications between these two classes. Only 8% of the Seyfert 2 and 4% of the LINERs, according to the red classification, are misclassified respectively as LINERs or Seyfert 2, according to the new blue classification.
4 An example application
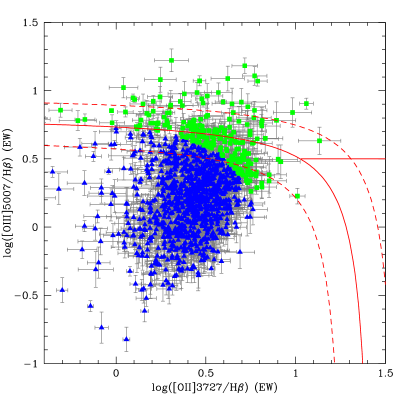
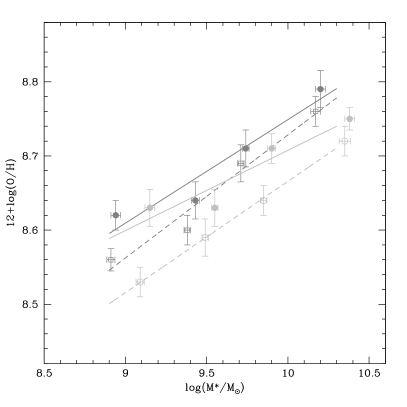
Our new classification will be useful for building samples of star-forming galaxies at high redshift. As an example, we show in Fig. 5 updated results obtained for VVDS data with our new classification. We refer the reader to Lamareille et al. (2009) for details. The left panel shows that we now obtain less star-forming galaxies than with the previous classification scheme. In the right panel, this ends up to slightly different estimates of the mass-metallicity relation in the and redshift ranges. With our improved classification, we now confirm and even strengthen the conclusion of Lamareille et al. (2009) that the metallicity evolution of star-forming galaxies is less significant as a function of redshift for lower mass galaxies than for high mass galaxies.
For galaxies of masses , the metallicity evolution is respectively dex and dex lower in the two above mentioned redshift ranges than the results obtained with the old classification of star-forming galaxies. The difference between the old and the new classification is not significant for galaxies of masses .
5 Conclusion
| total | SFG | Sey. 2 | LINER | comp. | |
|---|---|---|---|---|---|
| total | 89 379 | 67 778 | 2 949 | 4 912 | 13 740 |
| SFG | 80 312 | 67 539 | 952 | 270 | 11 551 |
| Sey. 2 | 2 016 | 55 | 1 748 | 187 | 26 |
| LINER | 7 051 | 184 | 249 | 4 455 | 2 163 |
| SF/Sy2 | 3 603 | 2 668 | 774 | 6 | 155 |
| SF-LIN/comp | 47 461 | 37 669 | 17 | 988 | 8 787 |
Table 1 summarizes the distribution of the objects in the new blue classification, as compared to the reference red classification. A large majority of star-forming galaxies are correctly classified with the new blue classification. But the new blue classification also suffer from a non negligible contamination of the star-forming regions by composites, which should be taken into account in studies of star-forming galaxies. We note however that a number of composites, according to the classification of Kauffmann et al. (2003), may actually only be star-forming galaxies. Kewley et al. (2001) have shown from theoretical modeling that pure star-forming spectra can be expected in the region latter defined as the composite region by Kauffmann et al. (2003). Stasińska et al. (2006) have also shown that the composites allow an AGN contribution up to 20%, but this does not mean that this contribution cannot be lower than 20%, or even be zero. True composites may be confirmed only from far infrared or X-ray observations.
We define the region of SF-LIN/comp which contains the majority of actual composites, but is dominated by actual star-forming galaxies and LINERs. The composites also contaminates the region of LINERs in our new classification. However, most of the actual LINERs are correctly classified with our new classification.
Finally, the region of Seyfert 2 in our new classification is almost only composed of actual Seyfert 2 with no significant contamination. But about a third of the actual Seyfert 2 are just classified as SF/Sy2 in our new classification, this class is unfortunately dominated by actual star-forming galaxies. The DEW classification proposed by Stasińska et al. (2006) actually complements our classification in classifying correctly SF/Sy2 galaxies. This will be commented in further details in the second paper of this series. Our new classification can be used to define samples of star-forming galaxies (see Sect. 4), but also samples of Seyfert 2 or LINERs (e.g. to compute luminosity functions) in a much more accurate way than the previous blue classification scheme. However it cannot be used to derive samples of composites since they get mixed with star-forming galaxies and LINERs.
Acknowledgements.
The author thanks “La Cité de l’Espace” for financial support while this paper was being written. The data used in this paper were produced by a collaboration of researchers (currently or formerly) from the MPA and the JHU. The team is made up of Stéphane Charlot (IAP), Guinevere Kauffmann and Simon White (MPA), Tim Heckman (JHU), Christy Tremonti (Max-Planck for Astronomy, Heidelberg - formerly JHU) and Jarle Brinchmann ( Sterrewach Leiden - formerly MPA). I thank in particular J. Brinchmann to keep always these data up to date, and for his quick answers to my questions. I thank also E. Hache and J. Marocco, whose work is partly at the origin of the idea to write this paper. I thank finally the referee G. Stasinska for useful comments and suggestions, and E. Davoust for improving English. All data presented in this paper have been processed with the JClassif software, part of the Galaxie pipeline.References
- Baldwin et al. (1981) Baldwin, J. A., Phillips, M. M., & Terlevich, R. 1981, PASP, 93, 5
- Heckman (1980) Heckman, T. M. 1980, A&A, 87, 152
- Kauffmann et al. (2003) Kauffmann, G., Heckman, T. M., Tremonti, C., et al. 2003, MNRAS, 346, 1055
- Kewley et al. (2001) Kewley, L. J., Dopita, M. A., Sutherland, R. S., Heisler, C. A., & Trevena, J. 2001, ApJ, 556, 121
- Kewley et al. (2006) Kewley, L. J., Groves, B., Kauffmann, G., & Heckman, T. 2006, MNRAS, 372, 961
- Lamareille et al. (2009) Lamareille, F., Brinchmann, J., Contini, T., et al. 2009, A&A, 495, 53
- Lamareille et al. (2004) Lamareille, F., Mouhcine, M., Contini, T., Lewis, I., & Maddox, S. 2004, MNRAS, 350, 396
- Rola et al. (1997) Rola, C. S., Terlevich, E., & Terlevich, R. J. 1997, MNRAS, 289, 419
- Stasińska et al. (2006) Stasińska, G., Cid Fernandes, R., Mateus, A., Sodré, L., & Asari, N. V. 2006, MNRAS, 371, 972
- Tresse et al. (1996) Tresse, L., Rola, C., Hammer, F., et al. 1996, MNRAS, 281, 847
- Veilleux & Osterbrock (1987) Veilleux, S. & Osterbrock, D. E. 1987, ApJS, 63, 295