Evidence of transient interactions between optical excitations and image potential states in graphite
Abstract
Here we report the experimental evidence of the interactions between the excitations of the optical transition and the image potential states (IPS) of highly oriented pyrolitic graphite (HOPG). By using non-linear angle resolved photoelectron spectroscopy (NL-ARPES) we show that the IPS photoemission intensity, the effective mass, and the linewidth exhibit a strong variation when the photon energy is tuned across the saddle points in the 3.1 - 4.5 eV photon energy range. A model based on the self-energy formalism is proposed to correlate the effective mass and the linewidth variations to transient many body effects, when a high carriers density (in the cm-3 range) is created by the absorption of a coherent light pulse. This finding brings a clear evidence of a high IPS-bulk coupling in graphite and opens the way for exploiting the IPS as a sensitive, nonperturbing probe for the many-body dynamics in materials.
pacs:
81.05.uf - 73.20.-r - 79.60.-i - 71.20.GjThe concept of quasiparticle in solids has been very useful for describing many unconventional physical properties, such as the deviation from the linear response in many body systems, by taking into account the residual interactions between the quasiparticles, i.e. the part of the Coulomb forces not accounted for in the formation of quasiparticle Chemla and Shah (2001).
For example, in these last decades it has been demonstrated that the optical properties of semiconductors near the electronic bandgap are dominated by excitons and their residual interactions, producing many-body effects, such as band-gap renormalization (BGR) Berggren and Sernelius (1981), and non-linear optical mechanisms. In particular, a deep insight has been gained on understanding the BGR in semiconductors by means of time-resolved non-linear optical spectroscopy in the fs time-domain Chemla (1999). For these reasons and also because their linear properties are well understood and excitons can be easily created and controlled through band-gap optical transitions, semiconductors have been considered ideal materials for such studies. Instead, in semi-metallic and gap-less systems the response to photoexcitation processes is still unclear, and the studies of the dynamics and interactions of quasiparticles have been only marginal.
In a previous work Pagliara et al. (2008), we have shown that for nonlinear photoemission processes in metals, the IPS effective mass () can be influenced by the hot electron (hot-e-) gas generated during the excitation process, but the interplay between bulk many body excitations and surface states remains elusive. Nonetheless, understanding these processes is of paramount importance for condensed matter physics.
In this framework, graphite is an intriguing and interesting system, since the excitations in this material could have a strong coupling with the IPS, originating from the hybridization between the IPS and the interlayer band Posternak et al. (1984), along with the anisotropy of the charge transport in the direction normal to the graphene planes. In addition, the presence of a van Hove singularity (vHs) at eV in the JDOS, corresponding to the transition between the bands saddle points, located at the M point of the Brillouin Zone (BZ) Bassani and Parravicini (1967), allows the photoinjection of high carrier densities in the outermost graphene layers.
Here we report on angle-resolved non-linear photoemission spectroscopy (NL-ARPES) studies, using ultrashort coherent photon pulses, on HOPG. By tuning the photon energy in the 3.1-4.5 eV range we discover that the photoemission (PE) intensity of the n=1 IPS, populated by the hot-e- scattering process accompanying the femtosecond excitations, has a maximum near eV. This energy results eV lower than the maximum of the imaginary part of the dielectric function, , where the highest photoelectron yield is expected for indirectly populated IPS.
Stimulated by this result and its possible link to transient BGR effects, we measured also the IPS effective mass () and linewidth (), finding that both quantities reach a maximum between eV and eV. On the basis of the measured and versus the photon energy we craft a semi-quantitative self-energy model, allowing to obtain an estimation of the renormalization energy of eV. This value is fully consistent with a BGR mechanism that, by downward shifting the vHs energy, sets the IPS PE maximum in the eV range, in agreement with the experimental observations.
The experimental setup is based on an amplified Ti:Sapphire laser system and optical parametric amplifiers, producing p-polarized, fs, near-UV pulses that are focused on the HOPG sample kept in an ultra-high vacuum chamber (pressure mbar). Photoelectrons are detected by a custom-built time of flight (ToF) electron spectrometer Paolicelli et al. (2002) with an angular acceptance of ° and an overall energy resolution 35 meV at an electron kinetic energy () of eV. The HOPG samples are cleaved ex-situ and annealed at 450°C until a good LEED pattern is obtained. The photoelectron spectra have been collected either at (normal emission - NE) and , being the component of the momentum parallel to the surface, by varying the angle between the sample normal and the ToF axis. In order to perform dispersion measurements with the maximal axial symmetry possible, the plane of incidence of the incoming UV pulses has been chosen to lie, at NE, on the plane defined by the manipulator axis and the ToF axis. [see lower part of Fig. 1-(a)]. All measurements have been performed at room temperature.
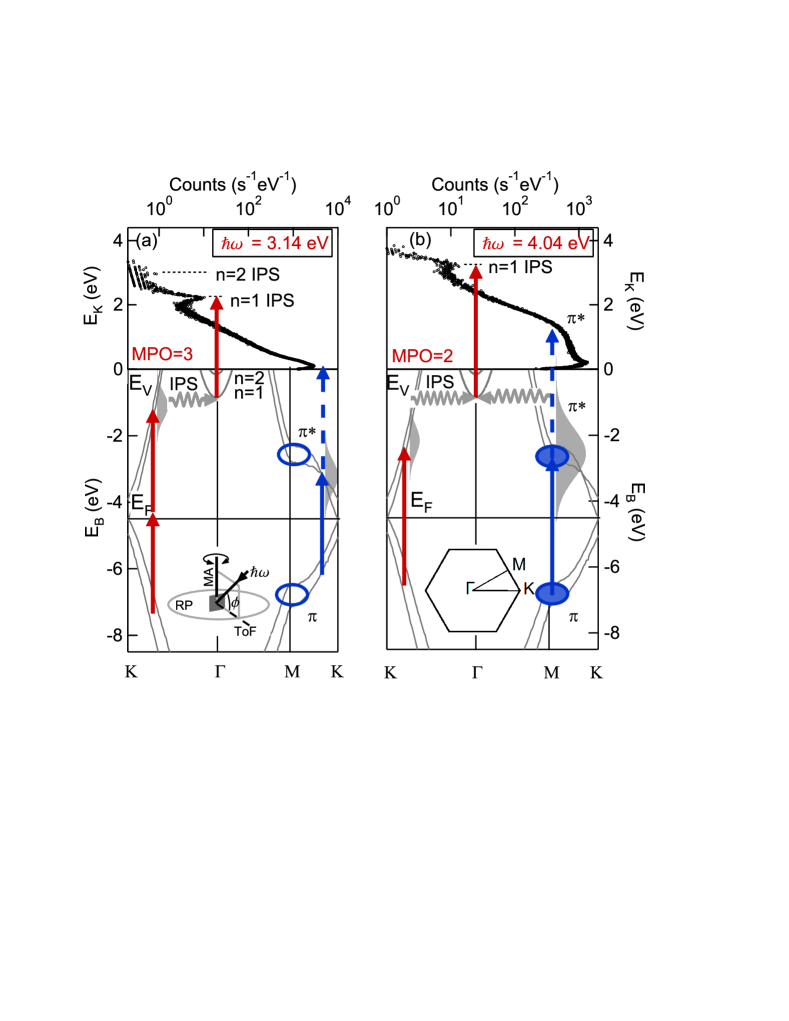
The upper parts of Fig. 1 show normal emission NL-PE spectra of HOPG at eV (a) and eV (b). The peaks located at EK above eV are identified with the n=1 and n=2 IPS emission, instead the hump-shaped feature (*), located below eV in Fig 1 (b), is assigned to the linear PE from the band, transiently populated via the transition. These assignments are consistent with the s-polarized photon spectra (not shown here) where the IPS emissions are quenched and the intensity is significantly reduced, according to the electric dipole selection rules for IPS and bulk bands with symmetry Hufner (2005).
To properly describe these complicated non-linear processes, important insights can be achieved by measuring the PE multiphotonic order (MPO) at different photon energies, defined as the logarithmic slope of the IPS emission peak intensity versus the pump fluence. We find a MPO=3 for eV and MPO=2 for eV. These informations, along with the graphite bandstructure Tatar and Rabii (1982), reported in the lower parts of Fig. 1, shows that, at eV, the IPS population process is the result of a two-photon absorption mechanism, whereas at =4.04 eV the IPS is populated by one-photon absorption process. At both photon energies the IPS is indirectly populated trough electron scattering of the hot electron (hot-e-) population created in the band by the optical absorption (see Fig. 1).
To unambiguously clarify the IPS population mechanism several NE PE spectra, a selection of which is shown in 2(a), have been measured at a constant laser fluence F = 150 J cm-2 by tuning the photon energy from = 3.2 eV to = 4.2 eV. The MPO of the IPS photoemission, versus photon energy, are shown in Fig. 2(b). As it is possible to note the MPO changes from 3 to 2 in going form 3.2 eV to 4.15 eV photon energy, being the transition region meV-wide and centered at eV. The linearity of the photoemission process from the IPS is shown in Fig. 2(c) where the IPS emission intensity is reported in a false colors plot in the () plane. It is manifest that the relation between the values of the IPS maxima and the photon energy is linear and it is well fitted by (black line), being the IPS binding energy referred to the vacuum level, . Noteworthy, the IPS value obtained from the data fit, i.e. eV is in agreement with the only value found in literature Lehmann et al. (1999). These findings confirm that at eV an indirect two-photon population process plus a linear photoemission process (2+1=3 MPO) take place, whereas at eV the IPS photoemission spectra result from an indirect one-photon population plus a linear photoemission process (1+1=2 MPO). For further details, see Ref. Montagnese et al., 2009.
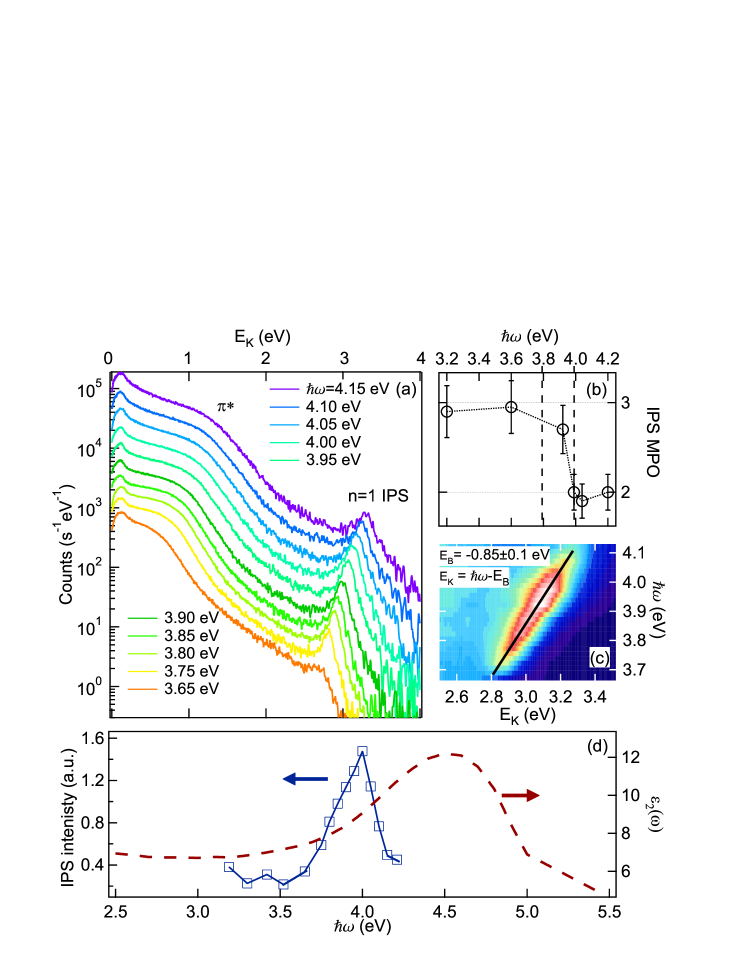
Being the population process of the IPS the result of scattering of the hot-e- gas excited into the bands, the IPS emission intensity should be proportional to the number of optically excited carriers in the band when the photon energy is tuned through the transition, i.e. proportional to . From the NE PE spectra is possible to obtain the dependence of the IPS emission intensity versus the photon energy. Fig. 2(d) shows that the IPS photoemission intensity depends on the photon energy, presenting a maximum at eV. However, the , as taken from Ref. Taft and Philipp, 1965, has a maximum, resulting from the optical transition between the two saddle points located at the M point of the Brillouin zone (BZ), i.e. at the vHs, located at eV. From these data it is unambiguous that the IPS maximum is located eV below the maximum. The MPO changes, along with the graphite band structure, cannot explain this behavior, and, in particular, the sudden drop in the PE yield detected at eV. Moreover, no enhancements of the linear photoemission, due to final state effects or other band structure mechanisms, are expected in the 4 eV range, from bandstructure analysis Tatar and Rabii (1982).
A possible explanation for this discrepancy can be gained by considering a transient shrinking of the gap between the two saddle points originating from the high density of photoinduced carriers, which at an absorbed fluence of J cm-2, are cm-3, i.e. two orders of magnitude greater than the room temperature carrier density at the Fermi level in graphite McClure (1956). Eq. 2 has been used to estimate carrier densities, and a constant reflectivity for the 3.2-4.5 eV range Greenway et al. (1969) has been considered. It is worth noting that these excitations are in the near-UV region and across the non-dispersive bands saddle point, where the band-induced effective mass cannot be properly defined, and the contribution of the residual many-body interactions between electrons and holes should become important in ”dressing” the quasiparticle. For these reasons, there are no theoretical predictions in the literature for such a case.
Nonetheless, given the proposed role of the hot-e- excitations to the IPS population processes, such a large BGR shift should imply a significant many-body contribution to the IPS properties, such as a deviation of the IPS effective mass and linewidth from the free-electron values.
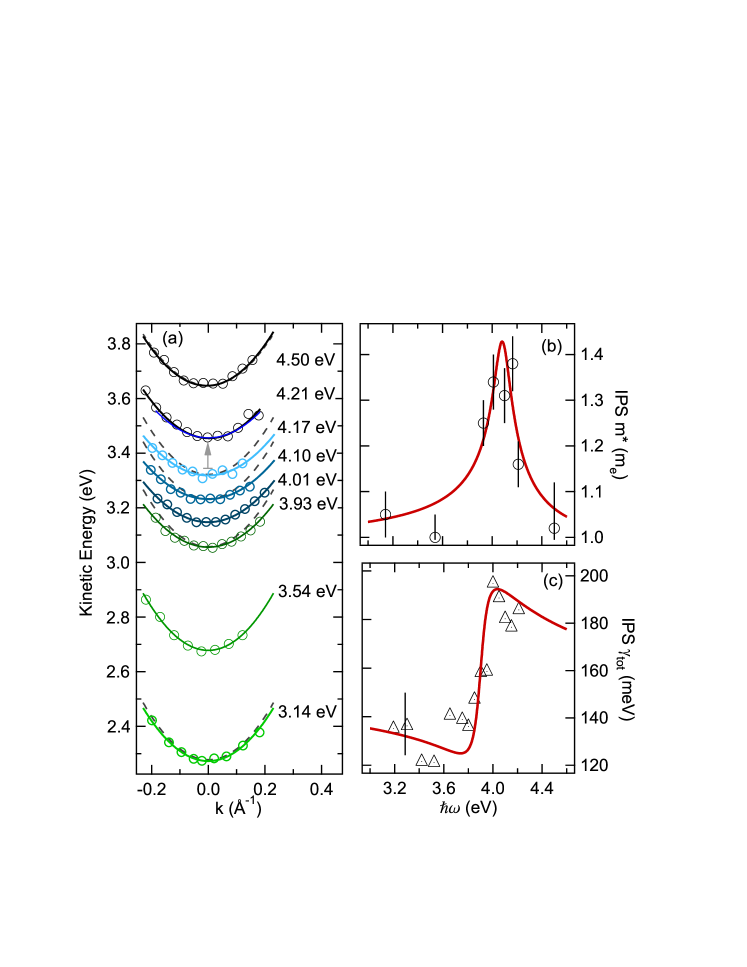
To verify this assumption, the IPS at photon energies between =3.14 eV and =4.50 eV have been measured from dispersions, according to standard procedures. The IPS dispersions are shown in Fig. 3(a), while the resulting versus photon energy is reported in Fig. 3(b). In Fig. 3(c) the IPS linewidth at versus photon energy, obtained from the NE spectra of Fig. 2(a), is shown. The versus the photon energy shows a maximum located at 4.1 eV, and corresponding to an increase of about 34 of the bare electron mass (me), as measured at 3.14 eV.
Noteworthy, the effective mass rising is accompanied by a sudden increase of the IPS NE linewidth, occurring near 4 eV, from the reported value of meV Lehmann et al. (1999) to 180 meV. These experimental evidences strongly point towards a relevant coupling between the surface IPS and the bulk optical excitations in graphite.
The IPS and linewidth dependence on photon energy can be rationalized on the basis of a semi-empirical self-energy formalism, by considering the interaction between the IPS and the photoinduced hot-e- gas in the band as the cause of the observed deviations from the free-electron case. Accordingly, a simple choice for the functional form of the real part of the IPS self-energy explaining the observed frequency-dependent dispersion modifications is the following,
| (1) |
where
| (2) |
is the non-equilibrium photoexcited carrier density in the bands Grosso and Parravicini (2000); here is the renormalization energy related to the BGR shift. and are two parameters of the model: represents the rigid shift of the dispersion, whereas is the positive parameter representing the effective mass increase. From Eq. 1 is possible to obtain the dependence on the photon energy
| (3) |
The contribution to the IPS line-width at =0 from the scattering with hot-e- can be obtained from the using Eq. 1 and the Kramers-Kronig (K-K) relations Lucarini et al. (2005). The total linewidth is given by,
| (4) |
where =130 meV is the equilibrium IPS linewidth, and eV is a Lorentzian broadening. Since experimental data on dielectric constant are affected by a substantial experimental broadening, calculated values of Pedersen (2003) has been used.
Fig. 3(b) shows the comparison of the fitting of Eq. (3) (red curve) to the IPS (open circles), using the coupling constant and the BRG shift as parameters. Instead, the fit of Eq. 4 to the linewidth data is reported in Fig. 3(c), using and as parameters. The best fit value results 0.4 0.1 eV from both and linewidth data. The fact that similar values are obtained from two independent measurements, i.e. and , connected by the K-K relations and that this value is consistent with the energy shift between the IPS intensity and the maximum as measured at equilibrium, i.e. eV are considered as strong evidences of the photoinduced residual interactions between photoinduced excitations and image potential states in graphite.
Their strong interaction can be rationalized considering the low interlayer coupling between graphene layers in graphite that prevents the diffusion of photoexcited carriers in the bulk. Moreover, photoinduced excitations at the -bands saddle point have already proven to strongly deviate from the Fermi-liquid behavior Moos et al. (2001); Spataru et al. (2001)], confirming the peculiar character of the M point of the BZ in graphite. Studying the residual interactions dependence on the photodoping concentration would be important in order to clarify the detailed properties of the many-body interactions. This would require performing fluence-dependent measurements over a substantial (i.e. at least a decade) fluence range. Unfortunately two concurring causes such as space charge effects and low electron statistics, limit the dynamic range of these experiments. However, it is possible to finely tune the absorbed fluence (and hence the carrier concentration) by varying the manipulator angle employing a non-symmetric experimental geometry, in which the plane of incidence of light is orthogonal to the manipulator axis; this induces angle-dependent variations of the absorbed fluence, resulting in a -dependence in the measured IPS effective mass, in accordance with Eq. 3. Pagliara et al. (2009).
In conclusion, we have reported the experimental evidence of the interactions between the photoinduced excitations and the image potential states (IPS) on highly oriented pyrolitic graphite (HOPG) when photoexcited by an intense (at F J cm-2), ultrashort ( fs) coherent light pulses, in the 3.1- 4.5 eV photon energy range. The strong dependence on the photon energy of the IPS photoemission intensity, effective mass, and linewidth, observed by NL-ARPES, when approaches the saddle points absorption has been attributed to many-body effects (residual interactions) originating from the high density of excitations. Finally, these findings bring a clear evidence of a high IPS-bulk coupling in graphite and opens the way for exploiting the IPS as a sensitive, nonperturbing probe for the many-body dynamics in materials.
References
- Chemla and Shah (2001) D. S. Chemla and J. Shah, Nature (London) 411, 549 (2001).
- Berggren and Sernelius (1981) K.-F. Berggren and B. E. Sernelius, Phys. Rev. B 24, 1971 (1981).
- Chemla (1999) D. S. Chemla, Semicond. Semimetals 58, 175 (1999).
- Pagliara et al. (2008) S. Pagliara, G. Ferrini, G. Galimberti, E. Pedersoli, C. Giannetti, C. A. Rozzi, and F. Parmigiani, Surf. Sci. 602, 2983 (2008).
- Posternak et al. (1984) M. Posternak, A. Baldereschi, A. J. Freeman, and E. Wimmer, Phys. Rev. Lett. 52, 863 (1984).
- Bassani and Parravicini (1967) F. Bassani and G. P. Parravicini, Nuovo Cimento 50B, 4259 (1967).
- Paolicelli et al. (2002) G. Paolicelli, A. Fondacaro, A. Ruocco, A. Attili, G. Stefani, G. Ferrini, M. Peloi, F. Parmigiani, G. Banfi, G. Cautero, et al., Surf. Rev. and Lett. 9, 541 (2002).
- Tatar and Rabii (1982) R. C. Tatar and S. Rabii, Phys. Rev. B 25, 4126 (1982).
- Hufner (2005) Hufner, Photoelectron Spectroscopy (Springer, 2005).
- Lehmann et al. (1999) J. Lehmann, M. Merschdorf, A. Thon, S. Voll, and W. Pfeiffer, Phys. Rev. B 60, 17037 (1999).
- Montagnese et al. (2009) M. Montagnese, S. Pagliara, G. Galimberti, S. dal Conte, G. Ferrini, and F. Parmigiani (2009), unpublished.
- Taft and Philipp (1965) E. A. Taft and H. R. Philipp, Phys. Rev. 138, A197 (1965).
- McClure (1956) J. McClure, Phys. Rev. 108, 612 (1956).
- Greenway et al. (1969) D. L. Greenway, G. Harbreke, F. Bassani, and E. Tosatti, Phys. Rev. 178, 1340 (1969).
- Grosso and Parravicini (2000) G. Grosso and G. P. Parravicini, Solid State Physics (Academic Press, New York, 2000), 1st ed.
- Lucarini et al. (2005) V. Lucarini, J. Saarinen, K.-E. Peiponen, and E. vartiainen, Kramers-Kronig Relations in Optical Materials Research, Optical Sciences Series (Springer, Heidelberg, 2005).
- Pedersen (2003) T. G. Pedersen, Phys. Rev. B 67, 113106 (2003).
- Moos et al. (2001) G. Moos, C.Gahl, R. Fasel, M.Wolf, and T. Hertel, Phys. Rev. Lett. 87, 267402 (2001).
- Spataru et al. (2001) C. Spataru, M. Cazalilla, A. Rubio, L. Benedict, P. Echenique, and S. Louie, Phys. Rev. Lett. 87, 246405 (2001).
- Pagliara et al. (2009) S. Pagliara, M. Montagnese, G. Galimberti, F. Zenoni, S. dal Conte, G. Ferrini, and F. Parmigiani (2009), unpublished.