Episodic Post-Shock Dust Formation in the Colliding Winds of Eta Carinae
Abstract
Eta Carinae shows broad peaks in near-infrared (IR) photometry, roughly correlated with times of periastron passage in the eccentric binary system. After correcting for secular changes attributed to reduced extinction from the thinning Homunculus Nebula, these peaks have IR spectral energy distributions (SEDs) consistent with emission from hot dust at 1400–1700 K. The excess SEDs are clearly inconsistent, however, with the excess being entirely due to free-free wind or photospheric emission. One must conclude, therefore, that the broad near-IR peaks associated with Eta Carinae’s 5.5 yr variability are due to thermal emission from hot dust. I propose that this transient hot dust results from episodic formation of grains within compressed post-shock zones of the colliding winds, analogous to the episodic dust formation in Wolf-Rayet binary systems like WR 140 or the post-shock dust formation seen in some supernovae like SN 2006jc. This dust formation in Eta Carinae seems to occur preferentially near and after periastron passage; near-IR excess emission then fades as the new dust disperses and cools. With the high grain temperatures and Eta Car’s C-poor abundances, the grains are probably composed of corundum or similar species that condense at high temperatures, rather than silicates or graphite. Episodic dust formation in Eta Car’s colliding winds significantly impacts our understanding of the system, and several observable consequences are discussed.
keywords:
circumstellar matter — dust, extinction — stars: individual (Eta Carinae) — stars: variables: other — stars: winds, outflows1 INTRODUCTION
As one of the brightest mid-infrared (IR) sources in the sky, Eta Carinae has been a key reservoir of information about dust around massive stars (Chesneau et al. 2005; Smith et al. 1998, 2003b; Aitkin et al. 1995; Robinson et al. 1987; Hackwell et al. 1986). Dust formation by massive stars is of considerable interest regarding the presence of dust in star-forming galaxies at high redshift (e.g., Bertoldi et al. 2003), when the Universe was too young for asymptotic giant branch stars to have contributed significantly (Tielens 1998). The neutral and dusty bipolar Homunculus Nebula, ejected in the 19th century Great Eruption, absorbs most of the ultraviolet and visual-wavelength radiation from the star and re-radiates that luminosity in the mid-IR, providing a handy calorimeter of the central star (Smith et al. 2003b). This paper, however, focusses attention not on the dusty Homunculus, but on the near-IR emission from the very core of the nebula surrounding the central star (Rigaut & Gehring 1995; Smith & Gehrz 2000; Chesneau et al. 2005), which exhibits distinct and peculiar variability in the near-IR.
Whitelock et al. (1983, 1994, 2004) have followed the photometric near-IR variability of Eta Carinae, and noted quasi-periodic peaks every 5 yr. Damineli (1996) proposed that this IR variability and Eta Car’s optical spectroscopic changes were due to an eccentric 5.5 yr binary system, and successfully predicted the time of the next periastron passage in 1998.0. Since then, an intensive multiwavelength campaign has documented Eta Car’s cyclical variability in the X-rays (Corcoran 2005; Corcoran et al. 2001; Ishibashi et al. 1999), optical (Damineli et al. 1998; Davidson et al. 2000), and radio (Duncan & White 2003).
Here we return to the near-IR emission peaks that first heralded the 5 yr variability, which have so far eluded a satisfying explanation. We are interested in the broad 1–2 yr peaks in the light curves, and not the narrow eclipse-like events in the month or so surrounding periastron (Whitelock et al. 2004; Feast et al. 2001), which probably have a different origin and will be the topic of a future paper. In particular, photometry obtained from 1972 to 2004 by Whitelock et al. (1983, 1994, 2004) is used to constrain the spectral energy distribution (SED) of the excess emission that rises above the more steady, secular increase in apparent brightness over recent decades noted by Whitelock et al. (1994). We show that the broad quasi-periodic peaks in the light curves are caused by emission from hot dust grains, and we propose that these grains condense within the dense post-shock gas in the colliding-wind binary system. SEDs of this excess emission are not consistent with photospheric or free-free emission, which was previously assumed to be the origin.
Section 2 reviews the observational data, introducing a correction for the slow increase in apparent brightness caused by the expanding and thinning Homunculus Nebula. Section 3 presents the excess-emission SEDs for several of the past periastron passage events, and discusses possible emission mechanisms and the properties of the dust responsible for the excess near-IR emission. Finally, Section 4 proposes a scenario wherein new dust grains form in post-shock gas around times of periastron in Eta Carinae as a result of compression by the colliding winds.


2 NEAR-IR PHOTOMETRY
This paper investigates near-IR () photometry of Eta Carinae collected at the South African Astronomical Observatory (SAAO) from 1972 to 2004 by Whitelock and collaborators, kindly provided to the author by P.A. Whitelock. The data represent photometry for the entire Homunculus Nebula measured using a 36″-diameter aperture. For details regarding the observations and calibration, see Whitelock et al. (1983, 1994, 2004). According to Whitelock et al., typical photometric uncertainties are of order 0.03 mag at and 0.05 mag at . The data are invaluable for their consistency over a long time baseline of decades. Contamination by extended emission from the large Homunculus Nebula is always a concern in studying Eta Car’s variability. However, high-resolution images show that the -band light is dominated by the central star to a much higher degree than at visual wavelengths (Smith & Gehrz 2000; Rigaut & Gehring 1995). Furthermore, Smith & Gehrz (2000) demonstrated that near-IR variability is localized to the core region.
Figure 1 shows the photometry converted to flux units, where times of periastron passage in the binary system are identified with vertical dashed lines, adopting a period of 2022.7 days and phase 0.0 at 2003.49 (Damineli et al. 2008). One can most clearly recognize the IR peaks associated with the two periastron events in 1981.4 and 1986.9. As noted previously by Whitelock et al. (1994, 2004), a secular increase in flux is also present in all four filters, although to a much lesser degree in the band, presumably due to the reduced effects of extinction at the longer wavelength and a stronger contribution due to thermal emission from the Homunculus. The solid curves in Figure 1 show trends that provide a satisfactory approximation of the slow increase in each filter (see also Whitelock et al. 1994, 2004).
The relative rise in flux in each band represented by these solid curves provides an estimate of the wavelength dependence of the thinning extinction in the foreground polar lobe of the Homunculus. As the extinction continually decreases, the same wavelength-dependent extinction law is used at all epochs to generate the curves in Figure 1. This extinction law is shown in Figure 2, where it is compared to the average near-IR interstellar medium (ISM) extinction (dashed) from Indebetouw et al. (2005). The dust in Car appears to follow a different extinction law than the normal ISM, with much higher opacity in the and bands. This may be a consequence of large grains that can still scatter and absorb efficiently at 1–2 m.111Note, however, that while Figure 2 is an accurate representation of the wavelength dependence of the brightening, attributing it solely to extinction and inferring dust properties should be done with caution, since spatially extended thermal emission from the core of the Homunculus contributes to the -band. There are several other lines of evidence that suggest unusually large grains in the Homunculus, including very gray extinction at visual wavelengths and near-blackbody temperatures (Hillier et al. 2006; Smith & Ferland 2007; Smith et al. 2003b). Note that this extinction law applies to cool dust in the foreground south-east polar lobe, and not to the hot dust proposed to be forming during periastron passages.
The proper correction at the latest times is less certain because of the apparent change in the rate of brightening after 1998 (e.g., Davidson et al. 1999). We therefore interpret the 2003.5 event with caution, and indeed, the SEDs for the most recent events may be a mix of dust emission and wind emission. By contrast, the IR peaks above this trend associated with earlier events — especially 1981.4 and 1986.9 – are well defined and reliable, and are unambiguously due to hot dust as discussed below. We cannot be certain that the secular brightening trend is due entirely to lowered extinction from the thinning Homunculus – it could, for example, be due in part to long-term intrinsic changes in the central star. In any case, we wish to remove this trend from the data in order to focus only on the IR excess peaks associated with the 5.5 yr cycle. The unfilled points in Figure 1 show the same fluxes as the filled points, but divided by the curves noted above, resulting in a baseline flux that appears constant over decades.
Figure 3 shows baseline-corrected lightcurves, produced by dividing the light curves by the smooth secular trend to flatten them, and then scaling their flux. The absolute scaling is chosen so that the most recent epochs have negligible extinction, based on the expectation that Eta Car’s line-of sight extinction is much lower now than 30 years ago, but this choice will not affect our results because our interest is investigating relative changes in the SED during and after the broad peaks on time scales of 1 yr. Therefore, we focus only on the amount of excess emission left after subtracting off the baseline flux, shown by the unfilled points in Figure 3. The SED of this residual emission is the relevant quantity that we investigate in the next section.

3 SEDs OF THE NEAR-IR EXCESS
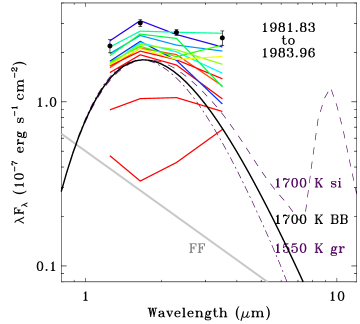
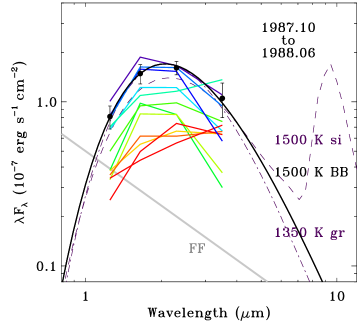
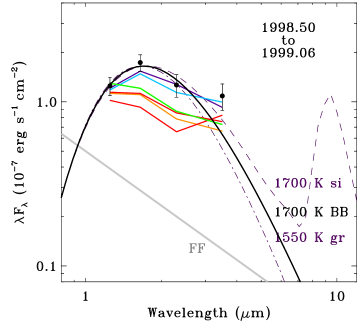
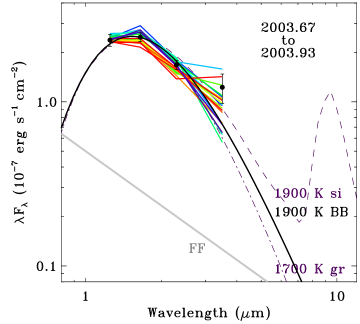
Figures 4 and 5 show the SEDs for residual or excess emission associated with broad IR emission peaks after the baseline flux has been subtracted (unfilled points in Figure 3). Each individual panel shows a different periastron passage event. The solid filled points with error bars correspond to the average flux of the broad IR excess peaks (marked in Fig. 3), while the colored SEDs represent several individual observations for a given event, ordered sequentially in time according to their color from blue (first) to red (last), matching the time interval in the upper right of each plot. For comparison, we also plot representative spectra for optically thin free-free emission (grey), plus emission from single-temperature grains, including a Planck function modified with emissivity proportional to (appropriate for grains smaller than the observed wavelength), as well as emissivities for graphite and silicate dust with 0.3 m from Draine & Lee (1984). These dust SEDs are meant for comparison and are not necessarily fits to the data; the significance and interpretation is discussed further below.
Some mechanism gave rise to the increase in emission above Eta Car’s baseline flux during and after periastron passages, and Figures 4 and 5 show the spectral signature of this excess emission for several events. What caused it? Most of Eta Car’s near-IR continuum flux is dominated by photospheric light from the star plus free-free emission from the dense stellar wind, reddened by dust to produce a smooth power-law spectrum at these wavelengths. However, we have already subtracted out most of this emission and corrected for the wavelength-dependent extinction as described above. Emission lines from the wind and nebulosity make a negligible contribution to the total broad-band flux (Smith 2002).
Instead, the most plausible explanation for the SED shapes in Figures 4 and 5 is excess emission from hot dust. Consider the first and most clearly-defined IR excess peak associated with the 1981 periastron passage. From the time of peak emission and for 1 yr afterward, the SED (Figure 4) has a clear maximum in the band, and its overall shape can be approximated quite well by modified blackbody emission at 1700 K or somewhat cooler graphite. Figure 4 shows that silicate dust at 1700 K can also match the SED shape, but this is highly improbable since silicates have lower condensation temperatures of 1000–1200 K. A similar result was found for the newly formed dust in SN 2006jc (Smith et al. 2008a), as discussed in more detail below. In Figure 4 there is apparently some additional flux in the -band, which is likely to be due to emission from somewhat cooler dust as well. The type of dust which is responsible for the near-IR excess must have a high condensation temperature around 1700 K. Although graphite condenses around 1600 K, the wind of Eta Car is presumed to be C-poor, so some type of dust other than graphite or silicate may be responsible. Implications for the dust composition are discussed further in §4.2. The excess SED shape cannot be explained by free-free emission or photospheric emission, which would rise even more steeply to the blue. After 1 yr, the excess emission fades and the dust cools. By 2 yr after the event (1983.96), when the peak in the light curve rejoins the baseline flux, the hot dust signature disappears and the SED is consistent with free-free emission and cooler dust (Figure LABEL:sed1).
Similarly, the excess IR emission from subsequent events is also consistent with dust at a range of temperatures. The peak associated with the 1986.9 event (Figure 4) shows an SED that is very well-fit by hot 1500 K dust, which then seems to cool to 1000 K as it fades over the subsequent year. The IR excess SEDs from the aftermaths of the next three periastron events in 1992.4, 1998.0, and 2003.5 events are shown in Figure 5. These IR peaks were less pronounced than the previous two events (Figure 3), probably indicating a smaller mass of newly formed dust. The weaker dust signature may also indicate a greater level of contamination from photospheric or free-free wind emission, making the estimated dust temperatures for these events less certain. Nevertheless, the red colors are clearly inconsistent with free-free or photospheric emission alone, so some contribution from dust is required. The SED from the last event in 2003.5 — which by itself would imply very hot dust at 1900 K — may be explained by a mix of variable photospheric or free-free wind emission combined with some hot dust, and as we noted earlier, the baseline correction for the underlying trend is uncertain.
Zanella et al. (1984) also suggested that dust caused the -band excess in 1981, although they did not analyze the SED, and they hypothesized that dust formation was due to the temporary shielding of UV light by a shell ejection in a single-star model. Subsequent studies assumed that free-free emission drove the IR variability. Chesneau et al. (2005) also mentioned the possibility of continuing dust formation in the inner Homunculus, although in a different context.
4 DISCUSSION
4.1 Observed Precedents for Post-shock Dust Formation
Although one may expect hot, X-ray emitting post-shock gas to be hostile to the formation of grains that require temperatures below 2000 K, two different classes of object have revealed strong evidence for the condensation of new dust grains in fast shocks. Both classes, discussed below, share interesting similarities with Eta Carinae.
First, some Wolf-Rayet (WR) binaries of WC type show clear evidence for dust formation in their winds (Gehrz & Hackwell 1974). Perhaps the most relevant example is the episodic dust formation in the eccentric WC binary WR 140 (Monnier et al. 2002; Williams et al. 1990; Hackwell et al. 1979), whose colliding winds give rise to an X-ray light curve that is similar in several respects to that of Eta Car (Pittard & Dougherty 2006). WR 137 and WR 19 are similar examples (Williams et al. 2001, 2009). There are also several cases of WC binaries with more circular orbits that produce the so-called “pinwheel” nebulae. High resolution imaging of these systems (Tuthill et al. 1999; Monnier et al. 1999) provides strong evidence that their IR emission comes from dust forming in post-shock gas as a consequence of their colliding winds. Dust may form in the cone of post-shock gas as it flows away from the central stars and cools below condensation temperatures. The C-rich composition of the winds aids the efficiency of amorphous carbon dust formation (Gehrz & Hackwell 1974).
Second, recent studies of some supernovae (SNe) that interact with dense circumstellar matter also provide clear evidence for the condensation of new dust grains in the post-shock gas. The best case is SN 2006jc, which at only 50 days after explosion, simultaneously showed a fading of its visual light due to extinction, an increase in its IR flux caused by dust at 1600 K, and a systematic blueshift of its emission lines as the far side of the SN was blocked by the new dust. Smith et al. (2008a) first demonstrated these changes and showed that the newly formed dust must be in the post-shock gas. SN 2006jc is particularly relevant to Eta Car, because at the same time that SN 2006jc formed dust and exhibited an IR excess, it also showed a boost in its X-ray luminosity (Immler et al. 2008) and enhanced He ii 4686 emission (Smith et al. 2008a). He ii 4686 in Eta Car is also associated with the periastron passages when dust forms (Steiner & Damineli 2004; Martin et al. 2006), as is enhanced X-ray emission. As noted by Smith et al. (2008a), these similarities implicate common physical conditions in the post-shock cooling zones of Eta Car and SN 2006jc.
While both WC binaries and SN 2006jc have C-rich material that may aid the formation of graphite grains, this is not necessarily a prerequisit for dust formation in post-shock gas. There is now a growing number of additional cases for post-shock dust formation in Type IIn supernovae that are not expected to have C-rich ejecta (Smith et al. 2009, 2008b; Fox et al. 2009; Pozzo et al. 2004). Details of how dust forms in the hot post-shock gas is not yet fully understood, but these observed examples prove that Nature can overcome the difficulties involved. Strong radiative cooling in dense post-shock gas is probably instrumental (Usov 1991), as are density inhomogeneities.
4.2 Post-Shock Grain Condensation in the Colliding Winds of Eta Car
Given the episodic presence of the hot dust in Eta Car, the most promising place for dust to form is in the compressed post-shock primary wind, akin to the episodic dust formation in WR 140 and other colliding-wind binary systems discussed above. Recent hydrodynamic simulations of the colliding winds in Eta Car (Parkin et al. 2009; Okazaki et al. 2008) show dense gas clumps arising from instabilities at the colliding-wind shock, with cm-3 at radii of 2–3 AU around times of periastron. These clumps will cool and become somewhat less dense as they flow down the shock cone, eventually reaching a radius where the radiative equilibrium temperature drops low enough for grains to condense. For sublimation temperatures around 1700 K, this occurs at AU in Eta Car, which is only 2–3 times the orbital separation at apastron, and for which the flow timescale is only a few months at 500 km s-1. Densities of clumps at these radii may drop to 109 cm-3, comparable to minimum densities for grain nucleation (e.g., Smith et al. 2008a and references therein). Grains may form at even smaller radii if high optical depths shield clumps from the primary star’s radiation.
Once the dust grains have formed, they will cool quickly as they expand down the shock cone. Flowing outward at 500 km s-1 from an initial formation radius at 60 AU, for example, the dust equilibrium temperature will fall to 1400 K after 100 days and will drop to 1000 K after 1 yr. This roughly matches the dust cooling indicated by the sequence of SEDs observed in the year following the 1987 periaston event (Fig. 4). The observed dust temperature does not necessarily need to drop however, because new dust may continue to form at the same temperature in the shock cone, replacing the dust that has cooled. Some other events have SEDs showing relatively constant dust temperatures.
Long after the periaston event when the new dust has cooled, it should reside primarily in the complex expanding shells and loop structures created during the 5.5 yr orbit, like those seen in simulations of Eta Car’s colliding winds (Parkin et al. 2009; Okazaki et al. 2008). It would be quite interesting to make a detailed comparison between the geometry of these simulations and dust structures observed in the core of the Homunculus. High-resolution data show an intriguing asymmetric distribution of material around the star (e.g., Smith et al. 2004; Chesneau et al. 2005; Gull et al. 2009), in which high grain temperatures of 400–500 K are observed (Smith et al. 1998, 2003b; Hackwell et al. 1986).
Some evidence suggests that Eta Car’s wind mass-loss rate changes from one cycle to the next (Damineli et al. 1998, 2008; Davidson et al. 2005), so the relevant post-shock density may be different in each cycle. Depending on how efficiently the gas cools, when dust starts to form, and how long the dust formation episode lasts, significantly different IR excess emission may be observed in each successive periastron event, consistent with the somewhat irregular character of the light curves. With peak values of (1–3)10-7 erg s-1 cm-2, the luminosity of the hottest dust that dominates the excess fluxes in Figures 4 and 5 is roughly (4–12)104 (i.e. a small fraction of the star’s radiative energy budget, but far exceeding the X-ray luminosity). At temperatures of roughly 1400–1700 K, the dust mass needed to account for the IR luminosity is at least (1.4–2.8)10-8 (adopting the same simplifying assumptions and methods as Smith & Gehrz 2005). This is a lower bound to the mass formed in a periastron event because cooler dust is also present, as is evident from the SED shapes — the hottest dust cools quickly as it flows downstream in the shock cone and may be replaced by additional hot dust (see Smith et al. 2008a). This is less than 0.1% of the total gas mass entering the shock interaction cone during the year around periastron.
Both the dust mass and the fraction of wind mass converted to dust in one of Eta Car’s periastron events are quite similar to values estimated for WR 140, which are 2.810-8 and 0.2%, respectively (Williams et al. 1990). Broad peaks in the multi-filter IR light curves of WR 140 (Williams et al. 1990) are also similar to those of Eta Car.
In dusty WC binaries and SN 2006jc, gas entering the shock is expected to be C enriched, favoring the formation of amorphous carbon grains. In Figures 4 and 5, we have compared the observed SEDs to graphite and silicates, as well as a Planck function with a more generic emissivity that may be representative of some other grain species. There are problems with attributing the new dust to either graphite or silicate grains. First, the high temperatures implied by the SED shapes are inconsistent with silicates and Fe-dominated grains, which seem to condense at lower temperatures of 1000–1200 K in novae (e.g., Gehrz 1988). While some silicates may form and may be partly responsible for the cooler dust excess seen in the -band, silicates cannot dominate the hottest 1700 K dust seen at . The high temperatures are in principle consistent with graphite, which can condense at temperatures around 1600 K, but that would be surprising given the N-rich but severely O/C-poor abundances observed in Eta Car (Davidson et al. 1986). The dust mass formed in a periastron event is small compared to the available gas mass, so while C should be underabundant, the formation of some small amount of amorphous carbon is not necessarily precluded.
A more straightforward solution, however, may be to attribute most of the newly formed hot dust to another species, such as corundum (Al2O3), which condenses at high temperatures around 1700 K. Indeed, Chesneau et al. (2005) argued that some contribution from corundum was needed to fit the very wide mid-IR “silicate” feature in Eta Car, and they found some spatial variation in the relative corundum abundance in the core of the Homunculus. In particular, Chesneau et al. (2005) found that a clump of dust located 04 southeast of the central star had a higher relative abundance of corundum than dust features in other directions, which they attributed to dust formation in a polar wind. Smith (2006) showed that this SE clump was redshifted and therefore located on the far side of the star in the equatorial plane. The fact that this equatorial clump is enhanced in corundum is quite interesting in the current context, because the orbit orientation favored by Okazaki et al. (2008) places this clump in the direction of the secondary star at periastron passages. In other words, if corundum dust forms preferentially around times of periaston in connection with the IR peaks in the photometry, and it forms in the colliding wind shock cone, then this is the preferential direction in which we would expect the new dust to flow. In WR 140, for example, puffs of episodic dust formed in the shock cone at periaston expand away from the star in that direction in high spatial resolution images (Monnier et al. 2002). This hints that further study of the spatial structure and composition of the dust in the core of Eta Car may prove to be extremely interesting.
4.3 Summary and Further Implications
Following the precendent set by dusty WC binaries that form dust in their colliding-wind shocks and by some SNe that form dust in post-shock gas, this paper proposes that the broad peaks in the light curve of Eta Car are due to the post-shock condensation of new dust in the colliding winds. The dust forms around the time of periastron passage in the eccentric 5.5 yr binary orbit, probably within dense clumps that have expanded far enough from the star that the radiative equlibrium temperature drops below 1700 K, and the dust then cools as it flows down the shock cone. The clearest episodes were associated with with the 1981.4 and 1986.9 periastron events, although later events also show evidence for dust. Episodic formation of dust in the colliding winds of the Eta Car binary system has several additional implications for this complex system:
1) Dust formed recently in this way is near the central star (within 60–500 AU), compared to the dust in the much larger Homunculus Nebula. While it is a relatively small mass of dust, its proximity may cause substantial extinction. This dust may preferentially block our view of the star without obscuring features in the surrounding nebulosity and extended wind, perhaps explaining Eta Car’s mysterious “coronograph” described by Hillier et al. (2006).
2) Absorption and scattering by this localized dust may be highly time variable as the dust expands and thins in the time interval between periastron passages. This dust may block starlight, or may scatter starlight toward us, with different contributions at different times. It may therefore contribute to irregular variability in optical photometry of Eta Carinae. Sterken et al. (1998) noted a drastic reddening of visual colors after several events, which they attributed to (usually slower) S Doradus variations, but perhaps the sudden reddening was from new dust close to the star instead.
3) Combined effects of local scattering and extinction may also influence spectra, even on very small angular scales of 01–02. The asymmetric expanding dust formed in the colliding-wind shock cone could serve as a moving mirror, reflecting some specific lines of sight more than others. This may be a factor in perplexing subtleties of spatially-dependent emission line profiles along our line of sight (e.g., Gull et al. 2009; Davidson et al. 2005), and direction-dependent profiles reflected by the Homunculus (e.g., Smith et al. 2003a). Even line profiles in our direct view of the central star may be affected by time-dependent dust scattering and extinction.
4) Episodic dust formation at small radii may regulate the escape of UV photons that excite emission lines in nearby gas condensations, contributing to the observed nebular spectral variability during the 5.5 yr cycle, and mimicing a shell ejection as described by Zanella et al. (1984).
5) Dust production in successive events every 5.5 yr is not perfectly repeatable, signaling differences in the post-shock densities that may result from longer-term changes in the mass-loss rate of the primary star. This, in turn, may alter the effects discussed above from one cycle to the next.
6) Episodic post-shock dust formation in the colliding winds of Eta Carinae may favor different refractory materials than those which condensed in the polar lobes. The more massive Homunculus may have had much higher densities and lower temperatures following the 19th century Great Eruption, fostering efficient formation of silicates, Fe grains, or other species that require lower temperatures. The transitory nature of the dust formation in colliding winds, however, may only provide sufficiently high densities for a brief time when the temperatures are high, permitting only corundum, amorphous carbon, or other species that condense at high temperatures. The limited duration of dust formation could then preclude the formation of lower temperature condensates. This might lead to spatial variations in dust composition and grain size around Eta Carinae, of which there are some observations signatures (e.g., Robinson et al. 1987; Smith et al. 1998; Chesneau et al. 2005).
It would obviously be interesting to spatially resolve the expanding dust that formed in recent eposides in order to constrain its geometry, as has been done for WR systems mentioned earlier, and to obtain mid-IR spectra of this newly formed dust as it expands and cools. This may prove a difficult challenge amid the bright and spatially complex Homunculus, however. Dust formation now may be less efficient than it was during 1981–1987, due to changes in the primary star’s mass-loss.
ACKNOWLEDGMENTS
I am indebted to P.A. Whitelock for providing electronic tables of the photometry obtained at the SAAO from 1972 to 2004, and I thank the referee, P. Williams, for helpful comments that improved the paper. I was partially supported by NASA through grants GO-10241 and GO-10475 from the Space Telescope Science Institute, which is operated by the Association of Universities for Research in Astronomy, Inc., under NASA contract NAS5-26555.
References
- [] Aitken, D.K., Smith, C.H., Moore, T.J.T., & Roche, P.F. 1995, MNRAS, 273, 359
- [] Bertoldi, F., et al. 2003, A&A, 406, L55
- [] Chesneau, O., et al. 2005, A&A, 435, 1043
- [] Corcoran, M.F. 2005, AJ, 129, 2018
- [] Corcoran, M.F., Ishibashi, K., Swank, J.H., & Petre, R. 2001, ApJ, 547, 1034
- [] Damineli, A. 1996, ApJ, 460, L49
- [] Damineli, A., et al. 1998, A&AS, 133, 299
- [] Damineli, A., et al. 2008, MNRAS, 384, 1649
- [] Davidson, K., Ishibashi, K., Gull, T.R., Humphreys, R.M., & Smith, N. 2000, ApJ, 530, L107
- [] Davidson, K., Dufour, R., Waborn, N.R., & Gull, T.R. 1986, ApJ, 305, 867
- [] Davidson, K., et al. 1999, AJ, 118, 1777
- [] Davidson, K., et al. 2005, AJ, 129, 900
- [] Draine, B.T., & Lee, H.M. 1984, ApJ, 285, 89
- [] Duncan, R.A., & White, S.M. 2003, MNRAS, 338, 425
- [] Feast, M., Whitelock, P.A., & Marang, F. 2001, MNRAS, 322, 741
- [] Fox, O., et al. 2009, ApJ, 691, 650
- [] Gehrz, R.D. 1988, ARAA, 26, 377
- [] Gehrz, R.D., & Hackwell, J.A. 1974, ApJ, 194, 619
- [] Gull, T.R., et al. 2009, MNRAS, 396, 1308
- [] Hackwell, J.A., Gehrz, R.D., & Grasdalen, G.L. 1979, ApJ, 234, 133
- [] Hackwell, J.A., Gehrz, R.D., & Grasdalen, G.L. 1986, ApJ, 311, 380
- [] Hillier, D.J., et al. 2006, ApJ, 642, 1098
- [] Immler, S., et al. 2008, ApJ, 674, L85
- [] Indebetouw, R., et al. 2005, ApJ, 619, 931
- [] Ishibashi, K., Corcoran, M.F., Davidson, K., Swank, J.H., Petre, R., Drake, S.A., Damineli, A., & White, S. 1999, ApJ, 524, 983
- [] Martin, J.C., Davidson, K., Humphreys R.M., Hillier, J.D., & Ishibashi, K. 2006, ApJ, 640, 474
- [] Monnier J.D., Tuthill P.G., & Danchi W.C. 1999, ApJ, 525, L97
- [] Monnier J.D., Tuthill P.G., & Danchi W.C. 2002, ApJ, 567, L137
- [] Okazaki, A.T., Owocki, S.P., Russell, C.M.P., & Corcoran, M.F. 2008, MNRAS, 388, L39
- [] Parkin, E.R., Pittard, J.M., Corcoran, M.F., Hamaguchi, K., & Stevens, I.R. 2009, MNRAS, 394, 1758
- [] Pittard, J.M., & Dougherty, S.M. 2006, MNRAS, 372, 801
- [] Pozzo, M., et al. 2004, MNRAS, 352, 457
- [] Rigaut, F., & Gehring, G. 1995, RevMexAA Ser. Conf., 2, 27
- [] Robinson, G., Mitchell, R.M., Aitken, D.K., Briggs, G.P., & Roche, P.F. 1987, MNRAS, 227, 535
- [] Smith, N. 2002, MNRAS, 337, 1252
- [] Smith, N. 2006, ApJ, 644, 1151
- [] Smith, N., & Ferland, G.J. 2007, ApJ, 655, 911
- [] Smith, N., & Gehrz, R.D. 2000, ApJ, 529, L99
- [] Smith, N., & Gehrz, R.D. 2005, AJ, 129, 969
- [] Smith, N., Gehrz, R.D., & Krautter, J. 1998, AJ, 116, 1332
- [] Smith, N., Davidson, K., Gull, T.R., Ishibashi, K., & Hillier, D.J. 2003a, ApJ, 586, 432
- [] Smith, N., Gehrz, R.D., Hinz, P.M., Hoffmann, W.F., Hora, J.L., Mamajek, E.E., & Meyer, M.R. 2003b, AJ, 125, 1458
- [] Smith, N., Foley, R.J., & Filippenko, A.V. 2008a, ApJ, 680, 568
- [] Smith, N., et al. 2008b, ApJ, 686, 467
- [] Smith, N., et al. 2009, ApJ, 695, 1334
- [] Steiner, J.E., & Damineli, A. 2004, ApJ, 612, L133
- [] Sterken, C., van Genderen, A.M., de Groot, M., & Burki, G. 1999, in Eta Carinae at the Millenium, ASP Conf. Ser. 179, ed. J.A. Morse, R.M. Humphreys, & A. Damineli (San Francisco: ASP), 200
- [] Tielends, A.G.G.M. 1998, ApJ, 499, 267
- [] Tuthill P.G., Monnier J.D., & Danchi W.C. 1999, Nature, 398, 486
- [] Usov, V.V. 1991, MNRAS, 252, 49
- [] Whitelock, P.A., Feast, M.W., Carter, B.S., Roberts, G., & Glass, I.S. 1983, MNRAS, 203, 385
- [] Whitelock, P.A., Feast, M.W., Koen, C., Roberts, G., & Carter, B.S. 1994, MNRAS, 270, 364
- [] Whitelock, P.A., Feast, Marang, F., & Breedt, E. 2004, MNRAS, 352, 447
- [] Willaims, P.M., et al. 1990, MNRAS, 243, 662
- [] Willaims, P.M., et al. 2001, MNRAS, 324, 156
- [] Willaims, P.M., Rauw, G., & van der Hucht, K.A. 2009, MNRAS, 395, 2221
- [] Zanella, R., Wolf, B., & Stahl, O. 1984, A&A, 137, 79