Tidal Heating Models for the Radii of the Inflated Transiting Giant Planets WASP-4b, WASP-6b, WASP-12b, WASP-15b, and TrES-4
Abstract
In order to explain the inflated radii of some transiting extrasolar giant planets, we investigate a tidal heating scenario for the inflated planets WASP-4b, WASP-6b, WASP-12b, WASP-15b, and TrES-4. To do so, we assume that they retain a nonzero eccentricity, possibly by dint of continuing interaction with a third body. We calculate the amount of extra heating in the envelope that is then required to fit the radius of each planet, and we explore how this additional power depends on the planetary atmospheric opacity and on the mass of a heavy-element central core. There is a degeneracy between the core mass and the heating . Therefore, in the case of tidal heating, there is for each planet a range of the couple that can lead to the same radius, where is the tidal dissipation factor and is the eccentricity. With this in mind, we also investigate the case of the non-inflated planet HAT-P-12b, which can admit solutions combining a heavy-element core and tidal heating. A substantial improvement of the measured eccentricities of such planetary systems could simplify this degeneracy by linking the two unknown parameters . Further independent constraints on either of these parameters would, through our calculations, constrain the other.
Subject headings:
planetary systems — planets and satellites: general1. Introduction
The transiting extrasolar giant planets (EGPs), around 60 discovered to date111See J. Schneider’s Extrasolar Planet Encyclopaedia at http://exoplanet.eu, the Geneva Search Programme at http://exoplanets.eu, and the Carnegie/California compilation at http://exoplanets.org., offer the best testbed for theoretical models of the evolution of planetary radii. In the last 14 years, many such theoretical models and tests have been proposed and investigated (Guillot et al., 1996; Burrows et al., 2000; Bodenheimer et al., 2001; Burrows et al., 2003; Baraffe et al., 2003; Bodenheimer et al., 2003; Gu et al., 2003; Burrows et al., 2004; Fortney & Hubbard, 2004; Baraffe et al., 2004; Chabrier et al., 2004; Laughlin et al., 2005; Baraffe et al., 2005, 2006; Burrows et al., 2007; Fortney et al., 2007; Marley et al., 2007; Chabrier & Baraffe, 2007; Liu et al., 2008; Baraffe et al., 2008; Ibgui & Burrows, 2009; Miller et al., 2009; Leconte et al., 2009).
A gas giant planet’s radius is a function of many variables, including the planet’s mass and age; the stellar irradiation flux and spectrum; the composition – in particular, the heavy-element content – of the atmosphere, the envelope, and the core; the atmospheric circulation that couples the day and the night sides; and any processes that could generate an extra power source in the interior of the planet, such as tidal heating. Furthermore, the connection between a planet’s physical radius and its transit radius is complicated by the transit radius effect (Burrows et al., 2003; Baraffe et al., 2003). Since each of these variables can change from one planet-star system to another, only a custom calculation can determine if the measured transit radius of a giant planet matches theoretical predictions.
The first observations of a transiting planet (HD209458b), which found that its diameter is more than 30% greater than Jupiter’s (Henry et al., 2000; Charbonneau et al., 2000), revealed a gap in our understanding of radius evolution. HD209458b’s radius is significantly larger than the standard evolutionary theory would predict for an object of its age (Knutson et al., 2007; Burrows et al., 2007). For this reason it is said to be inflated, or bloated. In the last decade, a number of other inflated planets have been discovered, whose radii are similarly difficult to explain in terms of simple evolutionary theory (CoRoT-1b: Barge et al. 2008; Gillon et al. 2009b, CoRoT-2b: Alonso et al. 2008, HAT-P-1b: Bakos et al. 2007; Winn et al. 2007; Johnson et al. 2008, TrES-2: O’Donovan et al. 2006, TrES-4: Mandushev et al. 2007; Sozzetti et al. 2009, WASP-4b: Wilson et al. 2008; Southworth et al. 2009; Gillon et al. 2009c; Winn et al. 2009a, WASP-6b: Gillon et al. 2009a, WASP-12b: Hebb et al. 2009, WASP-15b: West et al. 2009, XO-3b: Johns-Krull et al. 2008; Winn et al. 2008).
The present paper investigates a stationary heating scenario as a possible explanation of the inflated transiting giant planets recently discovered: WASP-4b, WASP-6b, WASP-12b, and WASP-15b. In addition, we revise the case of TrES-4, already discussed by Liu et al. (2008), and consider HAT-P-12b (Hartman et al., 2009), a planet that is not inflated, but that appears to require a massive, dense core to explain its small transit radius. At the time of the writing of this paper, three other inflated transiting EGPs have been discovered: CoRoT-5b (Rauer et al., 2009), HAT-P-13b (Bakos et al., 2009), and WASP-17b (Anderson et al., 2010). Although we might consider them in detail in a future study, we find it reassuring that preliminary investigations of these objects indicate that the general philosophy of the present paper can be applied to them as well.
Tidal heating as an explanation for inflated close-in EGPs was proposed by Bodenheimer et al. (2001, 2003). This heating being due to a nonzero eccentricity, they suggested the necessity of an excitation mechanism, as for example gravitational interaction with another planetary companion. This possibility was examined by Mardling (2007). Liu et al. (2008) investigated the cases of the inflated planets TrES-4, XO-3b, and HAT-P-1b, while assuming a constant rate of interior heating. Ibgui & Burrows (2009), Ibgui et al. (2009), and Miller et al. (2009) coupled the evolution of the planetary radius with that of the orbit, under the influence of tidal interactions. The interesting feature revealed by this scenario is a possible transient inflation of the planetary radius that temporarily interrupts its monotonic standard shrinking.
Here, we assume a constant heating rate. Such an assumption would be valid, in the context of tidal heating, if there is a stationary scenario such that the orbital eccentricity and semimajor axis of the transiting EGP are quasi-constant and the radius has reached a “quasi-equilibrium” value. This paper is organized as follows. In Section 2, we present the relevant properties of the planet-star systems in our study. In Section 3, we briefly summarize the model assumptions adopted for our planetary radius evolutionary calculations. In Section 4, we present both the details of our extra-heating model and its results. We derive the necessary heating rates for the equilibrium radii to match the measured values. In Section 4.1, we assume that the planets have no heavy-element central core and show that an enhanced planet atmospheric opacity, since this results in a larger radius, requires less internal heating. In Section 4.2, we freeze the planetary atmospheric opacity, and show that the presence of a heavy-element central core, whose effect is to shrink the planetary radius, requires more internal heating. In Sections 4.1 and 4.2, we relate to the ratio , where is the tidal dissipation factor (Goldreich, 1963) and the orbital eccentricity. In Section 4.3 we further show the following degeneracy: a given radius can be matched by a range of values of the couples or . When the measured eccentricities become sufficiently reliable, we could directly relate and . We make a first attempt at such a relation in this paper, while we remain fully aware of the poor constraints on . We conclude and provide a general discussion in Section 5.
2. Observed Properties of the Systems under Consideration
We consider the inflated planets WASP-4b, WASP-6b, WASP-12b, WASP-15b, and TrES-4, and the non-inflated planet HAT-P-12b. The relevant parameters for our study are listed in Tables 1 (planets’ properties) and 2 (host stars’ properties).
For each observational study, the status of these planets, inflated or non-inflated, was determined by comparing the observed radius to tabulated generic radii (Bodenheimer et al., 2003; Fortney et al., 2007; Baraffe et al., 2008). This procedure may be too restrictive, given the multiple variables on which the radius depends – the planet’s mass and age, the stellar irradiation flux and spectrum, the atmospheric composition, the presence of heavy elements in the envelope or in a central core, the atmospheric circulation that couples the day and the night sides, and any effects that could generate an extra power source in the interior of the planet, such as tidal heating. Only a calculation that is customized to the actual planet-star system can provide the most reliable prediction of the transit radius of the planet.
WASP-4b was discovered by Wilson et al. (2008) and its parameters were further refined by (Southworth et al., 2009; Gillon et al., 2009c; Winn et al., 2009a). It has an observed radius of with a mass of for an age of Gyr. Its eccentricity is not well constrained, but Madhusudhan & Winn (2009) derived an upper limit of 0.096.
WASP-6b was discovered by Gillon et al. (2009a), who observe a radius of , and a small mass of . They derive a nonzero eccentricity of . Gillon et al. (2009a) categorize the planet as clearly inflated. However, as we show later, our calculation indicates that the theoretical radius fits the measurement within the 1 limit, without needing to invoke extra heating. It might be a slightly inflated planet; more precise measurements in the future might resolve whether extra heating needs to be invoked to explain its size.
WASP-12b was discovered by Hebb et al. (2009). It has several singular properties. It is the second largest transiting planet discovered to-date with a radius of (WASP-17b, discovered by Anderson et al. 2010, is the largest one with a radius of ). Its mass is . Its estimated eccentricity is . It is also the most heavily irradiated transiting EGP, with a flux at the substellar point of 9.098. This planet has one of the shortest orbital periods, . Finally, and perhaps most interesting, its orbital separation is close to its estimated Roche limit, 0.0221 AU, while its periastron might even be smaller than this limit, depending upon the true values of its semimajor axis and eccentricity. The planet is, therefore, perhaps on the verge of being tidally disrupted. It may also be losing mass by exceeding its Roche lobe (Gu et al., 2003; Li et al., 2009). We do not take this process into account in our model. Miller et al. (2009) suggest a floor on eccentricity in order to fit the radius.
WASP-15b was discovered by West et al. (2009). Its observed radius is ; its mass is , and its eccentricity is .
TrES-4 was discovered by Mandushev et al. (2007). Its latest updated parameters are from (Sozzetti et al., 2009). Its observed radius is , and its mass is . As for the eccentricity, Knutson et al. (2009) report a upper limit for of 0.0058, where is the argument of periastron. We adopt a maximum value of 0.01.
HAT-P-12b, discovered by Hartman et al. (2009) is not an inflated planet. It has a small mass for a radius of . It has an upper limit on eccentricity of . As we will see later, our models require a heavy-element core to fit its radius at its estimated age.
3. Evolutionary Model Assumptions
The giant planet radius evolutionary model has been discussed in detail in Burrows et al. (2003), Burrows et al. (2007), and Ibgui & Burrows (2009). We briefly summarize its principal features.
We model the evolution, with age, of the radii of giant planets with the Henyey code of Burrows et al. (1993, 1997). The boundary conditions (Burrows et al., 2003) incorporate realistic irradiated planetary atmospheres calculated by CoolTLUSTY, a variant of TLUSTY (Hubeny, 1988; Hubeny & Lanz, 1995). In some circumstances, the presence of an extra upper-atmosphere absorber can lead to radiative equilibrium solutions that have thermal inversions in which, above a relative minimum, atmospheric temperatures increase with height (Hubeny et al., 2003; Burrows et al., 2008a, b; Knutson et al., 2008; Fortney et al., 2008; Spiegel et al., 2009). However, in this study, we do not consider such thermal inversion cases. The host star spectrum is calculated by interpolation at its actual effective temperature and gravity, from the Kurucz (1994) models. Such a customized approach should in principle enhance the reliability of the model, in comparison with generic and pre-calculated planetary atmosphere tables. The planet structure consists of an isentropic (convective) gaseous envelope and a possible inner heavy-element core. The envelope consists of a mixture of H2 and He (helium mass fraction ), and is described by the equation of state of Saumon et al. (1995). The possible core (evidence for which is described in Guillot et al. 2006; Burrows et al. 2007; Guillot 2008) is described by the ANEOS equation of state of Thompson & Lauson (1972).
The extra power source is assumed to be entirely in the interior of the planet, i.e. in its convective zone. We do not include any heating in the radiative region. Moreover, the heating rate is assumed to be constant, as a proxy for the more complicated behavior that actually might actually result if a companion excites the eccentricity of the transiting planet. This assumption was made by Burrows et al. (2007) and Liu et al. (2008), who calculated the rate of energy dissipation in several EGPs (HD209458b, TrES-4, XO-3b, and HAT-P-1b) needed to maintain their radii at their observed values. With the hypothesis that this source comes from tidal interactions, this configuration may result from the gravitational influence of a second (or companion) planet that would pump up the eccentricity of the transiting planet (Bodenheimer et al., 2001; Mardling, 2007), preventing it from circularizing.
Specifically, Mardling (2007) has demonstrated that, depending on a system’s architecture, an external pertuber could maintain the eccentricity of a given transiting EGP at quasi-constant values over gigayear timescales, or could excite the transiting planet’s eccentricity so that it oscillates around a mean value on a timescale that is fast compared with the planet’s Kelvin-Helmholtz time, so from a tidal heating perspective the planet responds as though the heating is essentially constant in time. Reproducing Mardling’s calculations in the cases of the planets examined in the current paper is not our focus here. Only such calculations, performed on a case-by-case basis, can provide constraints on the physical and orbital properties of a possible companion capable of sustaining the orbital eccentricity (and the semimajor axis) of a given transiting planet, and can determine the contribution of this companion to the energy budget of the system. However, we note that it is, at the present, plausible that such external perturbers might exist in the systems under consideration herein, for two reasons:
-
•
First, to date, two of the transiting planets have been found to have companions: HAT-P-13b (whose companion is a planet; Bakos et al. 2009), and HAT-P-7b (whose companion might be either a planet or low-mass star; Pál et al. 2008; Winn et al. 2009b). Batygin et al. (2009) have coupled a three-body tidal orbital evolution model with the interior structure evolution of HAT-P-13b. They found that a quasi-stationary solution of the type that we consider is viable in that system.
-
•
Furthermore, the systems we consider in this paper have all been detected fairly recently. Companions could easily remain hidden if their orbital periods are sufficiently long compared with the temporal baseline for which the system has been observed, or if they induce sufficiently low reflex velocities in their host stars. Future observations and theoretical work could rule in or rule out the hypothesis that a companion excites the transiting planet’s eccentricity.
4. Theoretical Models for the Equilibrium Planetary Radius
If a gas giant planet has an additional power source heating its interior, its radius will be larger than theory would otherwise predict. The primary objective of this paper is to provide, for each inflated planet listed in Section 2, the amount of extra power that would be needed, in the steady state, to explain the measured radii.222As Ibgui & Burrows (2009) show, if the steady-state assumption is dropped, earlier episodes of intense heating can result in a state such that the subsequent radius remains inflated despite lower interior heating at the present. This is due to thermal inertia; the convergence towards the non-inflated radius may be on hundreds of megayear timescales. If we assume that the heating is due to tides, the energy dissipation rate within the planet may be be represented as (Peale & Cassen, 1978; Murray & Dermott, 1999; Bodenheimer et al., 2001, 2003; Gu et al., 2004; Mardling, 2007; Jackson et al., 2008; Ibgui & Burrows, 2009):
| (1) |
where is the gravitational constant, is the mass of the star, is the radius of the planet, is the tidal dissipation factor (Goldreich, 1963), and is the orbital eccentricity. Note that the -values of the systems considered here (see Table 1) are small enough that this equation, good to lowest order in eccentricity, is valid. Henceforth, unless otherwise stated, we will assume that the system has reached an equilibrium state, such that the heating can be considered constant. Maintaining tidal dissipation requires a mechanism to sustain a nonzero eccentricity, as Bodenheimer et al. (2001) pointed out. A way to achieve approximately this scenario is via a quasi-stationary orbit with and varying very slowly. If the planet reaches its currently measured position in a timescale that is short compared with the age of the system, typically in less than a few Myr – for example, through interactions with the protoplanetary disk (Lin et al., 1996; Goldreich & Sari, 2003) or by scattering with other planets (Ford et al., 2003; Chatterjee et al., 2008; Ford & Rasio, 2008; Jurić & Tremaine, 2008) – then its early early evolution may be neglected. We also neglect any Kozai interaction (Wu & Murray, 2003; Wu, 2003; Wu et al., 2007; Nagasawa et al., 2008). Once in its current orbit, its eccentricity and semimajor axis may be maintained at quasi-constant values on Gyr timescales through pumping by a third body (a planetary companion, for instance; Mardling 2007). We note that the statistics of the known exoplanet systems suggest that the Mardling mechanism is plausible: about of the discovered exoplanetary systems are known to be multiplanet systems (Wright, 2009)333http://exoplanet.eu. Furthermore, at least two transiting EGPs have companions: HAT-P-13b (Bakos et al., 2009), HAT-P-7b (Pál et al., 2008; Winn et al., 2009b). Since the EGPs we consider are old compared with the timescale for radius evolution (see Table 2), we treat the radius of each planet as constant and equal to the equilibrium radius as defined by Liu et al. (2008). If , , and are (approximately) constant, then, per Equation (1), tidal heating is (approximately) constant as well.
4.1. The Case of No Heavy-Element Central Core; the Effect of the Opacity
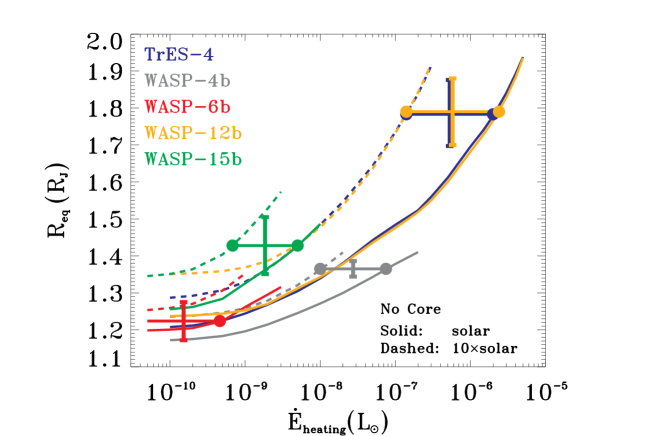
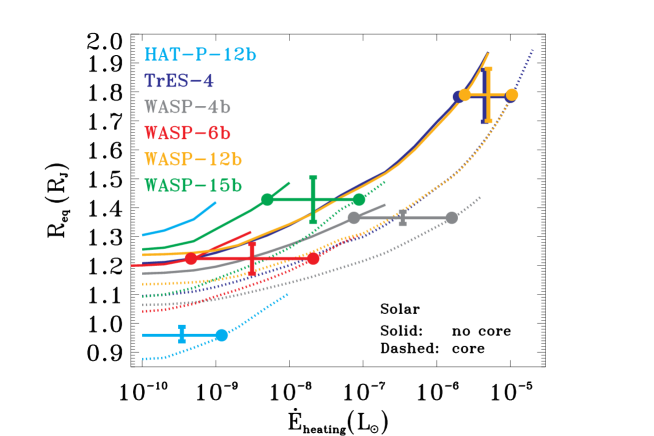
We examine here the evolution of the equilibrium radius as a function of the extra-heating rate , while excluding the presence of a heavy-element core (). We compute the extra-heating rate required to fit the measured radius. The results are summarized in Fig. 1 for each of the considered planets: TrES-4 (blue), WASP-4b (gray), WASP-6b (red), WASP-12b (orange), and WASP-15b (green). HAT-P-12b does not appear here because it requires a core, as we show in Section 4.2. Table 3 lists the extra-heating rate needed to fit the measured radii. It also lists the stellar irradiation444 , where is the stellar irradiation flux. incident upon each planet in our study (including HAT-P-12b). It compares to by displaying the ratio . Finally, it relates the orbital eccentricity to the tidal dissipation factor through the scaled ratio . We explore the effect of enhanced atmospheric opacity on the required heating rate , with our reference opacity corresponding to solar metallicity abundance. As an example of enhanced atmospheric opacity, we consider opacities corresponding to solar abundances, as described in Burrows et al. (2007).
The top left plot of the figure depicts as a function of . The thick horizontal segments are the best measured values of the radii and the thick vertical segments are the tolerances, as listed in Table 1. The intersections between the best measured values and the theoretical are represented by filled circles. Two opacities are employed: solar (solid lines), and solar (dashed lines). As expected, the curves grow with the heating rate: the greater the heating rate, the larger the equilibrium radius. The bottom left parts of these curves are horizontal. These correspond to the regimes where the heating effect is negligible and, therefore, give the equilibrium radius without extra-power. If we assume a solar opacity, we see that TrES-4 and WASP-12b have the largest discrepancy between the standard model radius without extra-power and the measured one (roughly the same discrepancy for both planets). The difference is about , or 33 of the measured radii. They require the highest extra-heating rate (see Table 3) at solar. WASP-6b is the least inflated planet or possibly a non-inflated one. Its theoretical radius without extra heating is , very close to the measured radius (see Table 1) and even within the 1 error. In between, WASP-4b and WASP-15b appear as “moderately” inflated with roughly the same relative gap of between the measurement and the calculation at solar with no tides. Though the relative gap is the same, the required heating at solar is a factor 16 greater for WASP-4b than for WASP-15b. This demonstrates that the amount of heating to increase the radius depends not only on the difference between the radius we want to reach and the radius without heating, but also on the magnitude of the latter 555Extra heating for WASP-15b: ; for WASP-4b: .. The influence of planetary opacity is indicated by the difference between the calculations at solar (solid curves) and those at 10solar (dashed curves). Models with higher atmospheric opacity require less heating, by roughly a factor ten in these examples. This is because enhanced opacity maintains the EGP’s radius at higher values for longer times (Burrows et al., 2007). Note that if WASP-6b has 10solar opacity, then it is “not inflated” (there is no filled circle). A simulation (result not shown here) indicates that 3solar opacity provides a good agreement of the radius within .
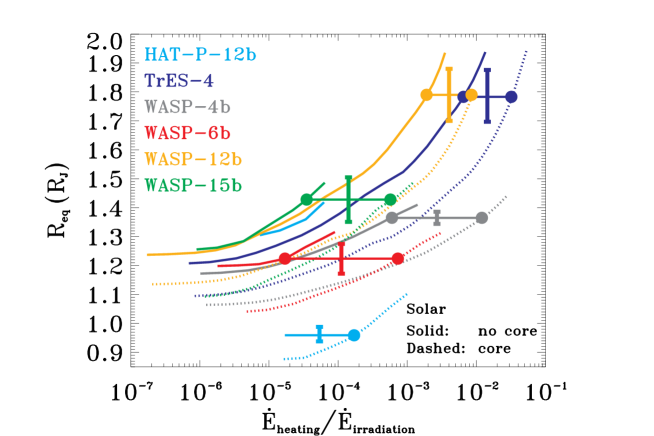
The top right panel of Fig. 1 plots the same ordinate as the top left (), but with the ratio as the x-axis. The main result here is the small amount of extra heating that is required in comparison with the irradiation rates; the ratios range from to . A second issue is shown by the curves depicting the cases of TrES-4 and WASP-12b. Both require roughly the same ( at solar and at solar), but the ratio is 3.5 higher for TrES-4 than for WASP-12b ( for WASP-12b, and for TrES-4). In short, both planets end up with the same equilibrium radius, while subjected to the same tidal heating rate, whereas WASP-12b is 3.75 times more irradiated than TrES-4. Everything else being equal, the more heavily irradiated planet has the larger radius. Here, however, WASP-12b has a larger mass than TrES-4 (the ratio is 1.5), and therefore is less affected by the irradiation than TrES-4.
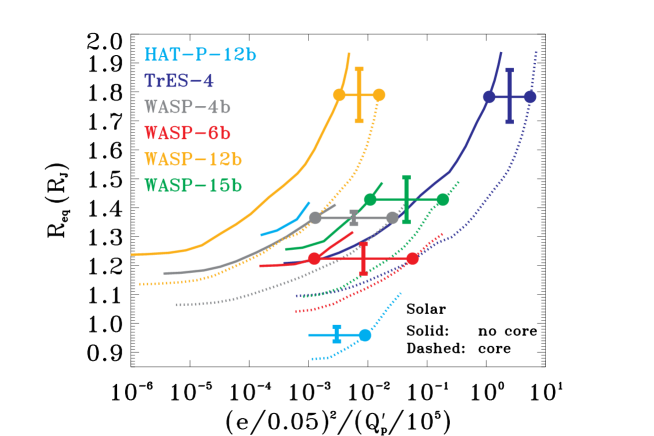
The top two panels of Fig. 1 do not specify the origin of the extra heating. If we assume that it is tidal heating, then using Equation (1) allows us to constrain the ratio . The bottom left side of Fig. 1 plots the equilibrium radius as a function of the scaled ratio . The curves have the same shapes as the ones in the two previously discussed plots, especially the behavior at the small values of this ratio that correspond to negligible tidal heating, either because of very low eccentricity or because of very large tidal dissipation factor . This factor is a poorly known parameter. We suppose that it has a constant value associated with a given planet, though it depends on the tidal period and therefore on the orbital period (Ogilvie & Lin, 2004; Wu, 2005; Goodman & Lackner, 2009; Spiegel et al., 2010). Note that the stationary orbit hypothesis removes the orbital period dependence of , but it does not necessarily result in a constant value, since also depends on other parameters such as (Goodman & Lackner, 2009).
A precise measurement of and the use of these curves would help to determine and, therefore, to constrain the models of tidal dissipation in the structure of the giant planets (Ogilvie & Lin, 2004; Wu, 2005; Goodman & Lackner, 2009). Moreover, we provide in Table 4 the rough estimates of possible values of for the planets while considering the uncertainties in the measured values of listed in Table 1. For WASP-4b, WASP-6b, and WASP-12b, the values are of the order of to , higher than the to more commonly assumed values, whether coming from Jupiter estimates (Goldreich & Soter, 1966; Yoder & Peale, 1981), or from theoretical arguments (Ogilvie & Lin, 2004). On the other hand, the values are very low for TrES-4 ( to ). This suggests that either the planet is extremely dissipative and will challenge theoretical models, or that it has a much larger opacity than the solar considered here (because, as we have seen before, a larger opacity requires less heating and, therefore, a higher ). Finally, for WASP-15b, the range is quite large, from to . The high values of suggest that all these planets, except perhaps TrES-4, probably have a heavy-element core. The presence of such a core decreases the required values of to fit the measured radii.
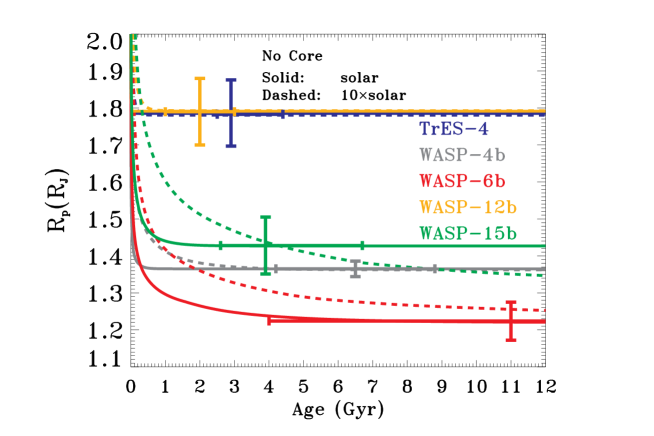
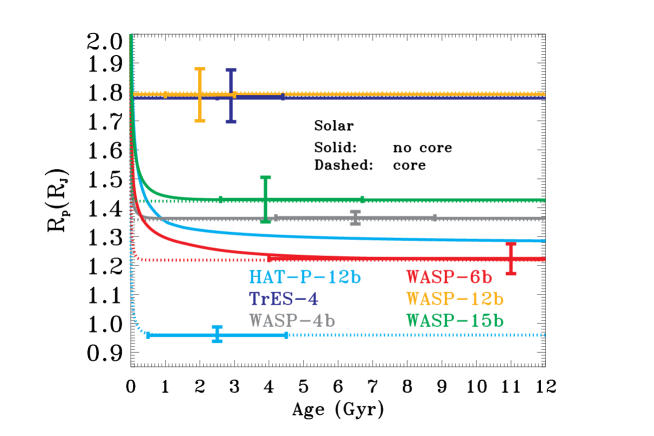
The timescale necessary to reach an equilibrium radius has been studied by Liu et al. (2008), based on generic sets of planets, semimajor axes, and heating rates. Assuming that the planet receives steady heating, their simulations show that the timescales can range from as low as a few Myr for the most heavily irradiated planets to a few Gyr for the less heavily irradiated ones. In the bottom right panel of Fig. 1, we address this issue for the particular cases of the planets considered in this paper. This panel shows the best fitting evolutionary curves, at solar and solar opacities, while maintaining the constant assumption. The corresponding equilibrium radii and are depicted by the thick dots in the three other panels. TrES-4 and WASP-12b reach their equilibrium radius on a timescale that is negligible compared to their estimated ages, even negligible compared to 1 Gyr, at both opacities. Although the equilibrium timescales for the three other planets at solar opacity, WASP-4b, WASP-6b, and WASP-15, are longer, from 0.5 Gyr to a few Gyr, we can reasonably assume that has been reached at their putative ages. A larger opacity results in a longer timescale to reach , again because increased opacity slows down radius shrinkage. As the case of WASP-15b at 10solar opacity shows, the equilibrium radius might not be reached within the age of the planet, if the heating remains constant and equal to the power needed to match the observed radius within its tolerance. One can imagine an initial episode of tidally coupled radius-orbit evolution (Ibgui & Burrows, 2009; Ibgui et al., 2009; Miller et al., 2009) followed by a frozen orbital position due to an interaction with a second planet.
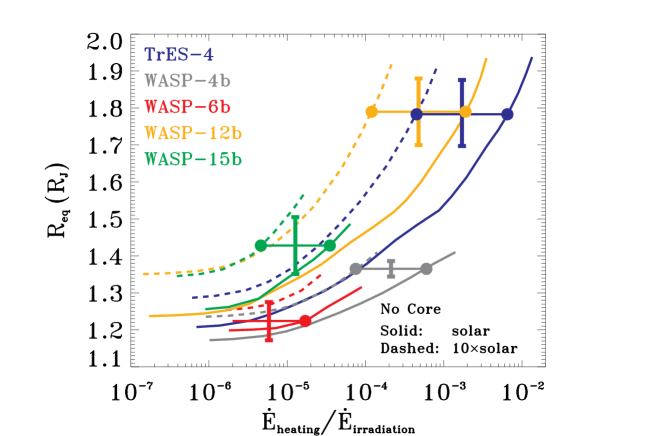
4.2. Effect of a Heavy-Element Central Core at Solar Opacity
In the previous subsection, we explored the effect of interior heating on the equilibrium radius , and we inferred the relationship between and the ratio . In our calculations so far, we have assumed that there is no heavy-element central core in planets. Now, we examine the influence such a core would have on planetary radius and on the required steady-state heating, at a given (solar) opacity. Figure 2 summarizes the results. The four panels are qualitatively similar to the ones in Fig. 1. The difference is that instead of changing the opacity, we change the core content from zero (no core) to an arbitrary but sufficiently high core mass, such that its effect can be appreciated. The solid curves are for the no-core and solar-opacity case. They are exactly the same as in Fig. 1. The dotted curves are for the case with cores, still at solar opacity. In addition to the planets presented in Fig. 1, namely TrES-4 (blue), WASP-4b (gray), WASP-6b (red), WASP-12b (orange), and WASP-15b (green), we have added HAT-P-12b (cyan), which is not inflated, but requires a core. The top left panel represents as a function of . Since the core acts to shrink the radius, a higher heating rate is required to fit the measured radius in the presence of a core.666Greater opacity, which also tends to increase the equilibrium radius, could partially substitute for a higher heating rate in the presence of a core. Note that, for HAT-P-12b, there is a large gap between the theoretical radius without tidal heating () and the measured radius (). As in Fig. 1, we also show as a function of two different abscissae, in the top right panel, and the scaled ratio in the bottom left. The bottom right panel shows the best fitting evolutionary curves, similar to the corresponding panel in Fig. 1, but showing here the effect of a core. This panel makes clear that the presence of a heavy-element core shortens the timescale to reach the equilibrium radius . In fact, the larger the core mass, the higher the value of the heating rate required to fit the radius, and the shorter the timescale to reach equilibrium.
4.3. Models with Compatible Core Mass - Heating Rate Pairs at solar and solar
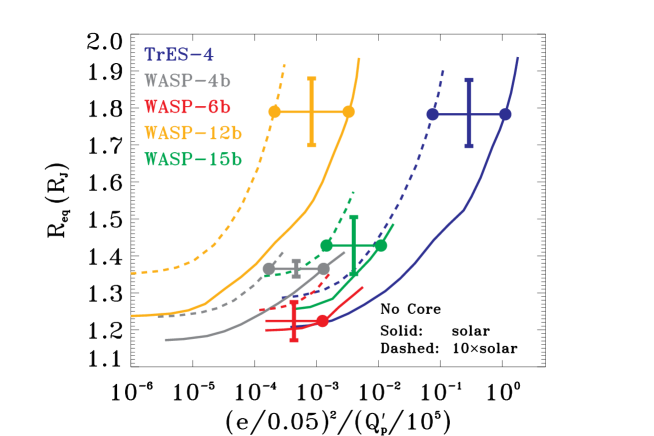
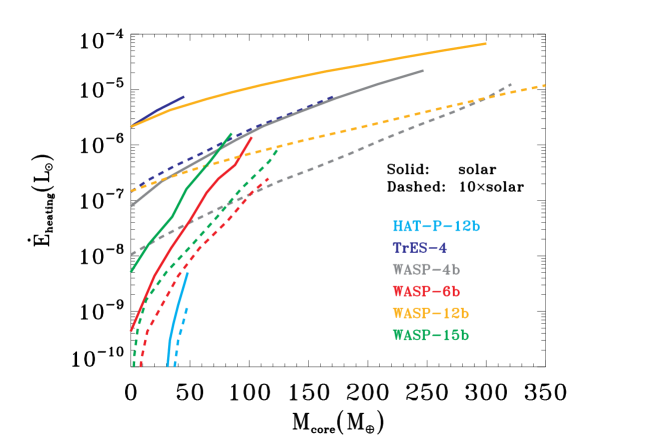
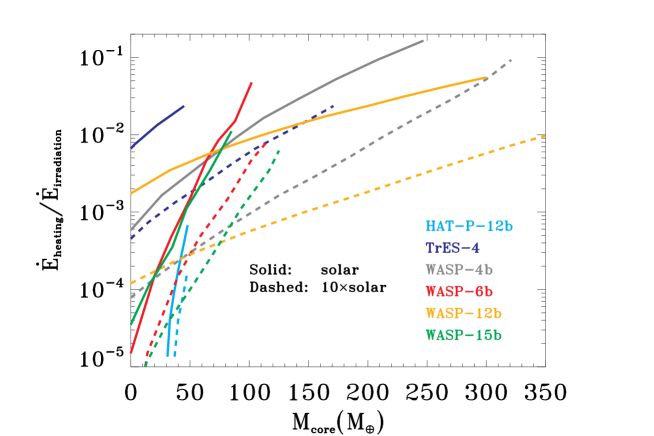
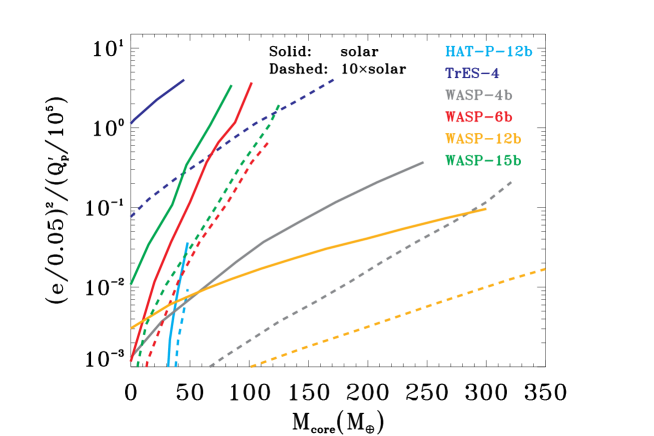
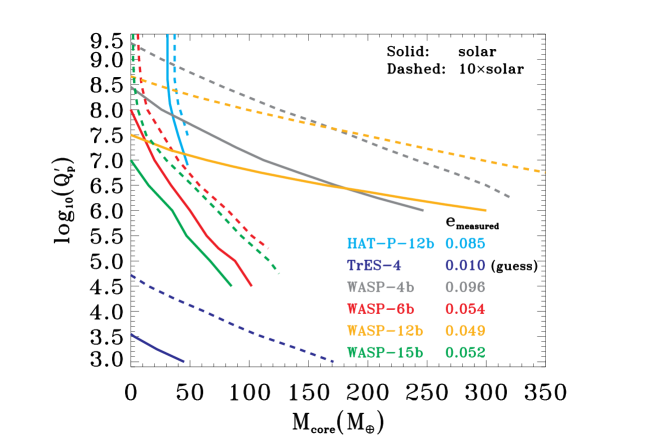
In the calculations so far (Section 4.1 and Section 4.2), we have mainly examined the qualitative effects of atmospheric opacity and of a heavy-element core on the extra interior heating required for steady-state models to match the observed planetary radii. The upshot is that the theoretical radius is increased by a higher heating rate , and by greater atmospheric opacity, but reduced by a larger core mass . Therefore, for each planet, for a given atmospheric opacity, we can find a range of possible couples that allow our model to fit the planetary radius. The objective of this section is to explore these possibilities and to translate this degeneracy in terms of possible couples , at solar or enhanced opacity. Note that our model decouples the opacity of the planetary atmosphere from the core mass. This is an approximation. Since planets originate from the same protostellar, protoplanetary disk as their stars, it is reasonable to assume that there is a correlation between host star metallicity and bulk planetary metallicity – though, as the different bulk metallicities of the planets in our solar system attest, any such correlation involves nonzero scatter. Furthermore, though there is naturally a correlation between atmospheric metallicity and atmospheric opacity, the details of a given planet’s atmospheric chemistry and thermophysics influence how its cocktail of elements translates into radiative opacity. It is important to note that each of these correlations is uncertain. In the same way as in Section 4.1, our reference case is solar opacity and we consider solar as an example of enhanced atmospheric opacity. Figure 3, the central figure of this paper, and both Tables 5 and 6, summarize the results.
The top left panel of Fig. 3 shows the required heating as a function of the core mass , for HAT-P-12b (cyan), TrES-4 (blue), WASP-4b (gray), WASP-6b (red), WASP-12b (orange), and WASP-15b (green), at two atmospheric opacities – solar (solid), and solar (dashed). As expected, increases with , but at rates that differ from one planet to another. HAT-P-12b appears to be the most sensitive with the highest relative slope . This could be explained by the fact that it is by far the lightest planet of the list, with (cf. Table 1), and thus the most sensitive to an extra-heating power. Moreover, the figure shows that it is the only clearly non-inflated planet, since even without heating a significant core mass is necessary to fit the radius (, which is 46 of the total mass of the planet; see Table 5). On the other hand, WASP-12b, the most massive of the planets of the list (), is the least sensitive to an extra-heating power, with , which is ten times smaller than the relative slope for HAT-P-12b. An enhancement of the opacity, for a given , results in the decrease of the required , as already noted in section 4.1 for a planet without a core. WASP-6b at solar would seem a non-inflated planet, since it would then require a small core even without heating (). The WASP-15b radius can be fit without heating and without a core, if its opacity is equal to 10solar. Note also that at this opacity and without a core, the equilibrium radius cannot be reached as shown by Fig. 3 in Section 4.1. Therefore, if WASP-15b has supersolar opacity and a small core (or none), then it has probably not been experiencing steady-state interior heating since the early epochs after its birth. It might, nonetheless, be undergoing quasi steady-state interior heating at the present. Another point emphasized by this panel is the wide range of core masses compatible with the measured radius. For example, we ran simulations for WASP-12b with a core mass up to 300 (67 of the total planet’s mass) at solar, and up to 351 (78 of the total mass) at solar. These masses are quite large, which raises the following question: Is there a theoretical upper limit for the core masses, compatible with the models of planetary formation? Pont et al. (2009), who propose some radius evolutionary models for HD 80606b, state that core masses above 200 might be unrealistic, given the constraints of planetary formation models (Ikoma et al., 2006). In particular, they point out a competition between scattering and accretion of planetesimals (Guillot & Gladman, 2000). In the future, such models might provide upper limits on , which, in combination with our calculations presented in Fig. 3 and Tables 5 and 6, may help to decipher the structures of transiting EGPs.
The top right panel of Fig. 3 shows the ratio as a function of . This ratio generally remains small, from to , as already noticed with the models without core (Section 4.1).
The link between and the poorly known parameters and , through the ratio , are shown in the bottom left panel of Fig. 3. Note that we plot the scaled ratio . This relation (see also tabulated values in Tables 5 and 6) could be used to constrain the models of tidal dissipation in planets in conjunction with the planetary structure models. Indeed, a precise enough measurement of the orbital eccentricity of these planets would result in a direct link between and . We provide such a link, with the best current measured estimations of in the bottom right panel of Fig. 3. It is important to bear this in mind that uncertainties in translate into uncertainties in these curves. For a given planet in the stationary state, the ratio is a constant. We can therefore link the uncertainties and , by writing , which yields:
| (2) |
Note that such a formulation acknowledges that the relative uncertainties, and , can be large. Lower and upper limits of the measured are available for WASP-6b, WASP-12b, WASP-15b (Table 1). We have only upper limits for the other planets. We infer lower and upper limits on : () for WASP-6b, () for WASP-12b, and () for WASP-15b. Given the low precision of , these curves have to be considered with caution. However, they provide some useful information. In particular, the s that allow the radii to be fit fall within a wide range, from to , and appear to be a property that differs from one planet to another. Moreover, for a given , the larger the atmospheric opacity, the larger the . This is unsurprising since, as we have previously seen, an enhanced opacity results in a larger radius. Therefore, less tidal heating is required (hence the larger ). TrES-4 is the most problematic planet. The compatible s at solar opacity are too low, to for at solar opacity. Knutson et al. (2009) derive a upper limit of 0.0058, so is likely to be lower than 0.01, therefore reducing further (in order to maintain the same ratio ). Estimates for Jupiter are around to (Goldreich & Soter, 1966; Yoder & Peale, 1981), and Ogilvie & Lin (2004) provide theoretical motivations for values around . The assumption of solar atmospheric opacity increases roughly by a factor 10 the value of . Perhaps TrES-4 has a higher opacity. Another possibility is that we have misinterpreted the radius of this planet. It might have rings, although icy rings would probably sublimate because of the intense irradiation, and dusty rings would probably plunge quickly into the star under the influence of the Poynting-Robertson drag (Poynting, 1903; Robertson, 1937). It may also be conceivable that its star is smaller than has been inferred, which, if so, would imply that the planet is correspondingly smaller than has been inferred. If we assume that values of span the - range, we can infer possible core masses. We have for WASP-6b an between roughly 50 and 90 if the opacity is solar, and between 80 and 110 if it is solar. For WASP-15b, we have between roughly 30 and 70 at solar, and between 70 and 115 at solar. WASP-12b requires values larger than . Given the lower limit (see above), values of the order or smaller than might be reached, but for a quite large at solar. Note that it could seem surprising that WASP-12b and TrES-4, which have very similar radii and comparable masses (Table 1), fit with so different parameters: the order of magnitude of for WASP-12b is roughly four times greater than the one for TrES-4 (Table 5 and 6, and Figure 3). This can be explained by Equation (1) and by the fact that the heating rates, , necessary to fit the observed radii, are comparable for these two planets (cf. Sections 4.1 and 4.2, and upper left panels of Figures 1 and 2). With comparable host star masses (Table 2) and planetary radii, the ratio of the is given by , which is roughly , assuming for and the values in Table 1. Note that current theories on the mechanisms of tidal dissipation in EGPs suggest that the parameter depends sensitively on the structure and atmosphere of the planet and that it could vary significantly from planet to planet, even though they might otherwise seem structurally similar, as we might think for WASP-12b and TrES-4. Goodman & Lackner (2009) argue that might vary significantly depending on the possible presence of a solid core and its size, completely unconstrained for these two planets. Furthermore, Ogilvie & Lin (2004) and Wu (2005) argue that could depend quite sensitively on the tidal forcing frequency. Since these two planets have very different orbital periods (; see Table 1) there is no reason to expect the Q’s for these two planets to be similar; orders of magnitude ambiguity, even for planets of comparable mass and radius, are entirely possible. In addition, the host stars’ metallicities are different (around 0.30 dex for WASP-12b and 0.14 dex for TrES-4). It is not inconceivable that the atmospheric opacities of the two planets are different from solar (and from each other), which would change the values of that are required, in our model, in order for tidal heating to explain the inflated radii. Finally, the inferred values of for WASP-4b, and even more for HAT-P-12b, might be larger than is realistic. These results are based only on upper limits for , which is too poor a constraint. Lower values of reduce the values of that are required for our model to explain the radii. We note that there is a statistical bias toward overestimating eccentricities from radial velocity measurements (Shen & Turner, 2008). Substantially improved measurements of orbital eccentricity, together with improved knowledge of atmospheric opacity, would allow us to constrain , if the steady-state model is appropriate. As an order-of-magnitude estimate, Equation (2) shows that an error could be achieved with a relative error on of . Planetary data, in Table 1, show that this constraint is satisfied by the observed eccentricities of WASP-6b and WASP-12b only. We stress that tests of the steady-state scenario must be done on a planet-by-planet basis.
5. Conclusions and Discussion
We have proposed in this paper a stationary tidal heating scenario to explain the radii of the inflated transiting EGPs WASP-4b, WASP-6b, WASP-12b, WASP-15b, and TrES-4. A constant heating rate may be achieved with quasi-constant eccentricity and semimajor axis, and after the planetary radius has reached its equilibrium value. Such a scenario might explain the inflated radii of some transiting EGPs. We have calculated the amount of additional interior heating that is required to fit the radius of each planet, and explored how it depends on the planet’s atmospheric opacity and on a heavy-element central core. There is a degeneracy between the required heating rate to fit the radius, the atmospheric opacity, and the heavy-element core mass inside the planet. In terms of tidal heating, there is, for a given opacity, a locus of points that can lead to the same radius. For this reason, a substantial improvement in the precision of measured orbital eccentricities would transform this degeneracy into a reliable degeneracy. Combined with theories of tidal dissipation inside the planets that constrain the values of , and with planet formation models that may also constrain the values of , this scenario could represent an explanation of these inflated radii based on tidal heating.
Our general conclusions are the following:
-
•
The heating rate, , necessary to fit an observed inflated radius is generally small in comparison to the irradiation rate, , with a ratio ranging from to .
-
•
The higher the heating rate, the larger the equilibrium radius. On the other hand, the larger the core mass, the smaller the equilibrium radius, and the higher the required heating rate in order to fit the measured radius. In other words, increases with .
-
•
Tidal heating might provide the extra interior power that inflates some planets. If tides are the extra power source, then the tidal dissipation factor is a decreasing function of core mass , but an increasing function of the atmospheric opacity. It may also be different for different planets.
-
•
The more massive the planet, the less its radius is sensitive to extra heating.
-
•
If the steady-state scenario presented in this paper obtains in a planetary system, the presence and the characterization of a central heavy-element core in that planet can be constrained by a better knowledge of the eccentricity, the planet’s atmospheric opacity, and the tidal dissipation in its interior governed by .
-
•
It would be interesting to revisit the work of Mardling (2007) in the specific instances of the planets under consideration in this paper, so as to characterize what possible companions might cause quasi-constant eccentricity and semimajor axis. Better constraints from radial velocity data will reveal which such companions, if any, might be present.
The applicability of the steady-state scenario should be examined for each planet individually. Assuming the current best measured estimates of the eccentricities, and being fully aware of the poor knowledge of this parameter and, therefore, that the following comments will need to be revised when more accurate measurements are available, we can state more specifically, planet by planet, that:
-
•
TrES-4, for which we assume =0.01, is the most difficult to reconcile with the steady-state scenario. The tidal dissipation parameter might be for a solar atmospheric opacity, lower than theoretical models or empirical determinations would generally suggest. If, as is likely, the actual eccentricity is lower than 0.01, the required value of , in the context of our model, would be even lower. On the other hand, if the atmospheric opacity is greater than solar, the planet would cool more slowly and the required value of , in our model, would be greater (for instance, for a solar opacity). For the purpose of constraining evolutionary models of this planet, it would be useful to study in greater depth both its eccentricity, which is not well constrained, and the composition and opacity of its atmosphere.
-
•
WASP-4b can be fit, but with values of or that are higher than we would expect. Its actual eccentricity might be noticeably lower than the upper limit currently available.
-
•
WASP-6b can be fit within with a solar opacity, without any extra heating. Consequently, a lower opacity involves an extra heating.
-
•
WASP-12b requires either high values of or extremely high core masses, such as 300 . However, such a high might be ruled out by planetary formation models.
-
•
WASP-15b can be fit with ranging in the expected interval and with core masses below .
-
•
HAT-P-12b, the only non-inflated planet, can be fit without invoking tidal heating, and with a core mass smaller than . However, models involving tidal heating and a central core are also compatible with its observed properties, within the steady-state assumption of this paper.
There are several caveats that the reader should bear in mind. Details of tidal dissipation theory remain to be determined, specifically the mechanism and location of heat deposition (in the radiative mantle or in the convective envelope). Also, we need to better understand the difference between day and night cooling. This may require full three dimensional general circulation models with radiative transfer. Finally, we have assumed that the core mass and the atmospheric opacity are independent. Broadly speaking, it seems likely that these properties are somewhat connected, due to a probable correlation of the compositions of the central core, the convective envelope, and the atmosphere. However, the lack of a unique mapping between core mass and atmospheric opacity might limit the extent to which future investigations might be able to treat these variables as coupled.
The fact that some transiting extrasolar giant planets have inflated radii continues to pose a theoretical challenge. The stationary tidal heating scenario described in this paper might explain the puzzle in some cases. Further observational constraints will clarify the viability of this scenario. To conclude, we mention the possibility of an alternative model, that might also be able to explain the inflated radii of some of the planets under consideration in this paper – namely, the coupled evolution of the planetary radius and its orbit, in the case of a two-body gravitational and tidal interaction (Ibgui & Burrows, 2009; Ibgui et al., 2009; Miller et al., 2009). At this stage, both scenarios appear to be plausible.
References
- Alonso et al. (2008) Alonso, R., Auvergne, M., Baglin, A., Ollivier, M., Moutou, C., Rouan, D., Deeg, H. J., Aigrain, S., Almenara, J. M., Barbieri, M., Barge, P., Benz, W., Bordé, P., Bouchy, F., de La Reza, R., Deleuil, M., Dvorak, R., Erikson, A., Fridlund, M., Gillon, M., Gondoin, P., Guillot, T., Hatzes, A., Hébrard, G., Kabath, P., Jorda, L., Lammer, H., Léger, A., Llebaria, A., Loeillet, B., Magain, P., Mayor, M., Mazeh, T., Pätzold, M., Pepe, F., Pont, F., Queloz, D., Rauer, H., Shporer, A., Schneider, J., Stecklum, B., Udry, S., & Wuchterl, G. 2008, A&A, 482, L21
- Anderson et al. (2010) Anderson, D. R., Hellier, C., Gillon, M., Triaud, A. H. M. J., Smalley, B., Hebb, L., Collier Cameron, A., Maxted, P. F. L., Queloz, D., West, R. G., Bentley, S. J., Enoch, B., Horne, K., Lister, T. A., Mayor, M., Parley, N. R., Pepe, F., Pollacco, D., Ségransan, D., Udry, S., & Wilson, D. M. 2010, ApJ, 709, 159
- Bakos et al. (2009) Bakos, G. Á., Howard, A. W., Noyes, R. W., Hartman, J., Torres, G., Kovács, G., Fischer, D. A., Latham, D. W., Johnson, J. A., Marcy, G. W., Sasselov, D. D., Stefanik, R. P., Sipőcz, B., Kovács, G., Esquerdo, G. A., Pál, A., Lázár, J., Papp, I., & Sári, P. 2009, ApJ, 707, 446
- Bakos et al. (2007) Bakos, G. Á., Noyes, R. W., Kovács, G., Latham, D. W., Sasselov, D. D., Torres, G., Fischer, D. A., Stefanik, R. P., Sato, B., Johnson, J. A., Pál, A., Marcy, G. W., Butler, R. P., Esquerdo, G. A., Stanek, K. Z., Lázár, J., Papp, I., Sári, P., & Sipőcz, B. 2007, ApJ, 656, 552
- Baraffe et al. (2006) Baraffe, I., Alibert, Y., Chabrier, G., & Benz, W. 2006, A&A, 450, 1221
- Baraffe et al. (2008) Baraffe, I., Chabrier, G., & Barman, T. 2008, A&A, 482, 315
- Baraffe et al. (2003) Baraffe, I., Chabrier, G., Barman, T. S., Allard, F., & Hauschildt, P. H. 2003, A&A, 402, 701
- Baraffe et al. (2005) Baraffe, I., Chabrier, G., Barman, T. S., Selsis, F., Allard, F., & Hauschildt, P. H. 2005, A&A, 436, L47
- Baraffe et al. (2004) Baraffe, I., Selsis, F., Chabrier, G., Barman, T. S., Allard, F., Hauschildt, P. H., & Lammer, H. 2004, A&A, 419, L13
- Barge et al. (2008) Barge, P., Baglin, A., Auvergne, M., Rauer, H., Léger, A., Schneider, J., Pont, F., Aigrain, S., Almenara, J.-M., Alonso, R., Barbieri, M., Bordé, P., Bouchy, F., Deeg, H. J., La Reza, D., Deleuil, M., Dvorak, R., Erikson, A., Fridlund, M., Gillon, M., Gondoin, P., Guillot, T., Hatzes, A., Hebrard, G., Jorda, L., Kabath, P., Lammer, H., Llebaria, A., Loeillet, B., Magain, P., Mazeh, T., Moutou, C., Ollivier, M., Pätzold, M., Queloz, D., Rouan, D., Shporer, A., & Wuchterl, G. 2008, A&A, 482, L17
- Batygin et al. (2009) Batygin, K., Bodenheimer, P., & Laughlin, G. 2009, ApJ, 704, L49
- Bodenheimer et al. (2003) Bodenheimer, P., Laughlin, G., & Lin, D. N. C. 2003, ApJ, 592, 555
- Bodenheimer et al. (2001) Bodenheimer, P., Lin, D. N. C., & Mardling, R. A. 2001, ApJ, 548, 466
- Burrows et al. (2008a) Burrows, A., Budaj, J., & Hubeny, I. 2008a, ApJ, 678, 1436
- Burrows et al. (2000) Burrows, A., Guillot, T., Hubbard, W. B., Marley, M. S., Saumon, D., Lunine, J. I., & Sudarsky, D. 2000, ApJ, 534, L97
- Burrows et al. (1993) Burrows, A., Hubbard, W. B., Saumon, D., & Lunine, J. I. 1993, ApJ, 406, 158
- Burrows et al. (2007) Burrows, A., Hubeny, I., Budaj, J., & Hubbard, W. B. 2007, ApJ, 661, 502
- Burrows et al. (2004) Burrows, A., Hubeny, I., Hubbard, W. B., Sudarsky, D., & Fortney, J. J. 2004, ApJ, 610, L53
- Burrows et al. (2008b) Burrows, A., Ibgui, L., & Hubeny, I. 2008b, ApJ, 682, 1277
- Burrows et al. (1997) Burrows, A., Marley, M., Hubbard, W. B., Lunine, J. I., Guillot, T., Saumon, D., Freedman, R., Sudarsky, D., & Sharp, C. 1997, ApJ, 491, 856
- Burrows et al. (2003) Burrows, A., Sudarsky, D., & Hubbard, W. B. 2003, ApJ, 594, 545
- Chabrier & Baraffe (2007) Chabrier, G., & Baraffe, I. 2007, ApJ, 661, L81
- Chabrier et al. (2004) Chabrier, G., Barman, T., Baraffe, I., Allard, F., & Hauschildt, P. H. 2004, ApJ, 603, L53
- Charbonneau et al. (2000) Charbonneau, D., Brown, T. M., Latham, D. W., & Mayor, M. 2000, ApJ, 529, L45
- Chatterjee et al. (2008) Chatterjee, S., Ford, E. B., Matsumura, S., & Rasio, F. A. 2008, ApJ, 686, 580
- Ford & Rasio (2008) Ford, E. B., & Rasio, F. A. 2008, ApJ, 686, 621
- Ford et al. (2003) Ford, E. B., Rasio, F. A., & Yu, K. 2003, in Astronomical Society of the Pacific Conference Series, Vol. 294, Scientific Frontiers in Research on Extrasolar Planets, ed. D. Deming & S. Seager, 181–188
- Fortney & Hubbard (2004) Fortney, J. J., & Hubbard, W. B. 2004, ApJ, 608, 1039
- Fortney et al. (2008) Fortney, J. J., Lodders, K., Marley, M. S., & Freedman, R. S. 2008, ApJ, 678, 1419
- Fortney et al. (2007) Fortney, J. J., Marley, M. S., & Barnes, J. W. 2007, ApJ, 659, 1661
- Gillon et al. (2009a) Gillon, M., Anderson, D. R., Triaud, A. H. M. J., Hellier, C., Maxted, P. F. L., Pollaco, D., Queloz, D., Smalley, B., West, R. G., Wilson, D. M., Bentley, S. J., Collier Cameron, A., Enoch, B., Hebb, L., Horne, K., Irwin, J., Joshi, Y. C., Lister, T. A., Mayor, M., Pepe, F., Parley, N., Segransan, D., Udry, S., & Wheatley, P. J. 2009a, A&A, 501, 785
- Gillon et al. (2009b) Gillon, M., Demory, B., Triaud, A. H. M. J., Barman, T., Hebb, L., Montalbán, J., Maxted, P. F. L., Queloz, D., Deleuil, M., & Magain, P. 2009b, A&A, 506, 359
- Gillon et al. (2009c) Gillon, M., Smalley, B., Hebb, L., Anderson, D. R., Triaud, A. H. M. J., Hellier, C., Maxted, P. F. L., Queloz, D., & Wilson, D. M. 2009c, A&A, 496, 259
- Goldreich & Sari (2003) Goldreich, P., & Sari, R. 2003, ApJ, 585, 1024
- Goldreich & Soter (1966) Goldreich, P., & Soter, S. 1966, Icarus, 5, 375
- Goldreich (1963) Goldreich, R. 1963, MNRAS, 126, 257
- Goodman & Lackner (2009) Goodman, J., & Lackner, C. 2009, ApJ, 696, 2054
- Gu et al. (2004) Gu, P.-G., Bodenheimer, P. H., & Lin, D. N. C. 2004, ApJ, 608, 1076
- Gu et al. (2003) Gu, P.-G., Lin, D. N. C., & Bodenheimer, P. H. 2003, ApJ, 588, 509
- Guillot (2008) Guillot, T. 2008, Physica Scripta Volume T, 130, 014023
- Guillot et al. (1996) Guillot, T., Burrows, A., Hubbard, W. B., Lunine, J. I., & Saumon, D. 1996, ApJ, 459, L35
- Guillot & Gladman (2000) Guillot, T., & Gladman, B. 2000, in Astronomical Society of the Pacific Conference Series, Vol. 219, Disks, Planetesimals, and Planets, ed. G. Garzón, C. Eiroa, D. de Winter, & T. J. Mahoney, 475
- Guillot et al. (2006) Guillot, T., Santos, N. C., Pont, F., Iro, N., Melo, C., & Ribas, I. 2006, A&A, 453, L21
- Hartman (2009) Hartman, J. D. 2009, private communication
- Hartman et al. (2009) Hartman, J. D., Bakos, G. Á., Torres, G., Kovács, G., Noyes, R. W., Pál, A., Latham, D. W., Sipőcz, B., Fischer, D. A., Johnson, J. A., Marcy, G. W., Butler, R. P., Howard, A. W., Esquerdo, G. A., Sasselov, D. D., Kovács, G., Stefanik, R. P., Fernandez, J. M., Lázár, J., Papp, I., & Sári, P. 2009, ApJ, 706, 785
- Hebb et al. (2009) Hebb, L., Collier-Cameron, A., Loeillet, B., Pollacco, D., Hébrard, G., Street, R. A., Bouchy, F., Stempels, H. C., Moutou, C., Simpson, E., Udry, S., Joshi, Y. C., West, R. G., Skillen, I., Wilson, D. M., McDonald, I., Gibson, N. P., Aigrain, S., Anderson, D. R., Benn, C. R., Christian, D. J., Enoch, B., Haswell, C. A., Hellier, C., Horne, K., Irwin, J., Lister, T. A., Maxted, P., Mayor, M., Norton, A. J., Parley, N., Pont, F., Queloz, D., Smalley, B., & Wheatley, P. J. 2009, ApJ, 693, 1920
- Henry et al. (2000) Henry, G. W., Marcy, G. W., Butler, R. P., & Vogt, S. S. 2000, ApJ, 529, L41
- Hubeny (1988) Hubeny, I. 1988, Computer Physics Communications, 52, 103
- Hubeny et al. (2003) Hubeny, I., Burrows, A., & Sudarsky, D. 2003, ApJ, 594, 1011
- Hubeny & Lanz (1995) Hubeny, I., & Lanz, T. 1995, ApJ, 439, 875
- Ibgui & Burrows (2009) Ibgui, L., & Burrows, A. 2009, ApJ, 700, 1921
- Ibgui et al. (2009) Ibgui, L., Spiegel, D. S., & Burrows, A. 2009, submitted to ApJ, arXiv:0910.5928
- Ikoma et al. (2006) Ikoma, M., Guillot, T., Genda, H., Tanigawa, T., & Ida, S. 2006, ApJ, 650, 1150
- Jackson et al. (2008) Jackson, B., Greenberg, R., & Barnes, R. 2008, ApJ, 681, 1631
- Johns-Krull et al. (2008) Johns-Krull, C. M., McCullough, P. R., Burke, C. J., Valenti, J. A., Janes, K. A., Heasley, J. N., Prato, L., Bissinger, R., Fleenor, M., Foote, C. N., Garcia-Melendo, E., Gary, B. L., Howell, P. J., Mallia, F., Masi, G., & Vanmunster, T. 2008, ApJ, 677, 657
- Johnson et al. (2008) Johnson, J. A., Winn, J. N., Narita, N., Enya, K., Williams, P. K. G., Marcy, G. W., Sato, B., Ohta, Y., Taruya, A., Suto, Y., Turner, E. L., Bakos, G., Butler, R. P., Vogt, S. S., Aoki, W., Tamura, M., Yamada, T., Yoshii, Y., & Hidas, M. 2008, ApJ, 686, 649
- Jurić & Tremaine (2008) Jurić, M., & Tremaine, S. 2008, ApJ, 686, 603
- Knutson et al. (2008) Knutson, H. A., Charbonneau, D., Allen, L. E., Burrows, A., & Megeath, S. T. 2008, ApJ, 673, 526
- Knutson et al. (2009) Knutson, H. A., Charbonneau, D., Burrows, A., O’Donovan, F. T., & Mandushev, G. 2009, ApJ, 691, 866
- Knutson et al. (2007) Knutson, H. A., Charbonneau, D., Noyes, R. W., Brown, T. M., & Gilliland, R. L. 2007, ApJ, 655, 564
- Kurucz (1994) Kurucz, R. 1994, Solar abundance model atmospheres for 0,1,2,4,8 km/s. Kurucz CD-ROM No. 19. Cambridge, Mass.: Smithsonian Astrophysical Observatory, 1994., 19
- Laughlin et al. (2005) Laughlin, G., Wolf, A., Vanmunster, T., Bodenheimer, P., Fischer, D., Marcy, G., Butler, P., & Vogt, S. 2005, ApJ, 621, 1072
- Leconte et al. (2009) Leconte, J., Baraffe, I., Chabrier, G., Barman, T., & Levrard, B. 2009, A&A, 506, 385
- Li et al. (2009) Li, S., Miller, N., Lin, D., & Fortney, J. 2009, Nature, submitted
- Lin et al. (1996) Lin, D. N. C., Bodenheimer, P., & Richardson, D. C. 1996, Nature, 380, 606
- Liu et al. (2008) Liu, X., Burrows, A., & Ibgui, L. 2008, ApJ, 687, 1191
- Madhusudhan & Winn (2009) Madhusudhan, N., & Winn, J. N. 2009, ApJ, 693, 784
- Mandushev et al. (2007) Mandushev, G., O’Donovan, F. T., Charbonneau, D., Torres, G., Latham, D. W., Bakos, G. Á., Dunham, E. W., Sozzetti, A., Fernández, J. M., Esquerdo, G. A., Everett, M. E., Brown, T. M., Rabus, M., Belmonte, J. A., & Hillenbrand, L. A. 2007, ApJ, 667, L195
- Mardling (2007) Mardling, R. A. 2007, MNRAS, 382, 1768
- Marley et al. (2007) Marley, M. S., Fortney, J. J., Hubickyj, O., Bodenheimer, P., & Lissauer, J. J. 2007, ApJ, 655, 541
- Miller et al. (2009) Miller, N., Fortney, J. J., & Jackson, B. 2009, ApJ, 702, 1413
- Murray & Dermott (1999) Murray, C. D., & Dermott, S. F. 1999, Solar System Dynamics, ed. C. U. P. (MD99)
- Nagasawa et al. (2008) Nagasawa, M., Ida, S., & Bessho, T. 2008, ApJ, 678, 498
- O’Donovan et al. (2006) O’Donovan, F. T., Charbonneau, D., Mandushev, G., Dunham, E. W., Latham, D. W., Torres, G., Sozzetti, A., Brown, T. M., Trauger, J. T., Belmonte, J. A., Rabus, M., Almenara, J. M., Alonso, R., Deeg, H. J., Esquerdo, G. A., Falco, E. E., Hillenbrand, L. A., Roussanova, A., Stefanik, R. P., & Winn, J. N. 2006, ApJ, 651, L61
- Ogilvie & Lin (2004) Ogilvie, G. I., & Lin, D. N. C. 2004, ApJ, 610, 477
- Pál et al. (2008) Pál, A., Bakos, G. Á., Torres, G., Noyes, R. W., Latham, D. W., Kovács, G., Marcy, G. W., Fischer, D. A., Butler, R. P., Sasselov, D. D., Sipőcz, B., Esquerdo, G. A., Kovács, G., Stefanik, R., Lázár, J., Papp, I., & Sári, P. 2008, ApJ, 680, 1450
- Peale & Cassen (1978) Peale, S. J., & Cassen, P. 1978, Icarus, 36, 245
- Pont et al. (2009) Pont, F., Hébrard, G., Irwin, J. M., Bouchy, F., Moutou, C., Ehrenreich, D., Guillot, T., Aigrain, S., Bonfils, X., Berta, Z., Boisse, I., Burke, C., Charbonneau, D., Delfosse, X., Desort, M., Eggenberger, A., Forveille, T., Lagrange, A., Lovis, C., Nutzman, P., Pepe, F., Perrier, C., Queloz, D., Santos, N. C., Ségransan, D., Udry, S., & Vidal-Madjar, A. 2009, A&A, 502, 695
- Poynting (1903) Poynting, J. H. 1903, MNRAS, 64, A1
- Rauer et al. (2009) Rauer, H., Queloz, D., Csizmadia, S., Deleuil, M., Alonso, R., Aigrain, S., Almenara, J. M., Auvergne, M., Baglin, A., Barge, P., Bordé, P., Bouchy, F., Bruntt, H., Cabrera, J., Carone, L., Carpano, S., de La Reza, R., Deeg, H. J., Dvorak, R., Erikson, A., Fridlund, M., Gandolfi, D., Gillon, M., Guillot, T., Guenther, E., Hatzes, A., Hébrard, G., Kabath, P., Jorda, L., Lammer, H., Léger, A., Llebaria, A., Magain, P., Mazeh, T., Moutou, C., Ollivier, M., Pätzold, M., Pont, F., Rabus, M., Renner, S., Rouan, D., Shporer, A., Samuel, B., Schneider, J., Triaud, A. H. M. J., & Wuchterl, G. 2009, A&A, 506, 281
- Robertson (1937) Robertson, H. P. 1937, MNRAS, 97, 423
- Saumon et al. (1995) Saumon, D., Chabrier, G., & van Horn, H. M. 1995, ApJS, 99, 713
- Shen & Turner (2008) Shen, Y., & Turner, E. L. 2008, ApJ, 685, 553
- Southworth et al. (2009) Southworth, J., Hinse, T. C., Burgdorf, M. J., Dominik, M., Hornstrup, A., Jørgensen, U. G., Liebig, C., Ricci, D., Thöne, C. C., Anguita, T., Bozza, V., Novati, S. C., Harpsøe, K., Mancini, L., Masi, G., Mathiasen, M., Rahvar, S., Scarpetta, G., Snodgrass, C., Surdej, J., & Zub, M. 2009, MNRAS, 399, 287
- Sozzetti et al. (2009) Sozzetti, A., Torres, G., Charbonneau, D., Winn, J. N., Korzennik, S. G., Holman, M. J., Latham, D. W., Laird, J. B., Fernandez, J., O’Donovan, F. T., Mandushev, G., Dunham, E., Everett, M. E., Esquerdo, G. A., Rabus, M., Belmonte, J. A., Deeg, H. J., Brown, T. N., Hidas, M. G., & Baliber, N. 2009, ApJ, 691, 1145
- Spiegel et al. (2010) Spiegel, D. S., Goodman, J., Burrows, A., & Ibgui, L. 2010, ApJ, in preparation
- Spiegel et al. (2009) Spiegel, D. S., Silverio, K., & Burrows, A. 2009, ApJ, 699, 1487
- Thompson & Lauson (1972) Thompson, S. L., & Lauson, H. S. 1972, Sandia National Laboratory Report, SC-RR-71,0714
- West et al. (2009) West, R. G., Anderson, D. R., Gillon, M., Hebb, L., Hellier, C., Maxted, P. F. L., Queloz, D., Smalley, B., Triaud, A. H. M. J., Wilson, D. M., Bentley, S. J., Collier Cameron, A., Enoch, B., Horne, K., Irwin, J., Lister, T. A., Mayor, M., Parley, N., Pepe, F., Pollacco, D., Segransan, D., Spano, M., Udry, S., & Wheatley, P. J. 2009, AJ, 137, 4834
- Wilson et al. (2008) Wilson, D. M., Gillon, M., Hellier, C., Maxted, P. F. L., Pepe, F., Queloz, D., Anderson, D. R., Collier Cameron, A., Smalley, B., Lister, T. A., Bentley, S. J., Blecha, A., Christian, D. J., Enoch, B., Haswell, C. A., Hebb, L., Horne, K., Irwin, J., Joshi, Y. C., Kane, S. R., Marmier, M., Mayor, M., Parley, N., Pollacco, D., Pont, F., Ryans, R., Segransan, D., Skillen, I., Street, R. A., Udry, S., West, R. G., & Wheatley, P. J. 2008, ApJ, 675, L113
- Winn et al. (2007) Winn, J. N., Holman, M. J., Bakos, G. Á., Pál, A., Johnson, J. A., Williams, P. K. G., Shporer, A., Mazeh, T., Fernandez, J., Latham, D. W., & Gillon, M. 2007, AJ, 134, 1707
- Winn et al. (2009a) Winn, J. N., Holman, M. J., Carter, J. A., Torres, G., Osip, D. J., & Beatty, T. 2009a, AJ, 137, 3826
- Winn et al. (2008) Winn, J. N., Holman, M. J., Torres, G., McCullough, P., Johns-Krull, C., Latham, D. W., Shporer, A., Mazeh, T., Garcia-Melendo, E., Foote, C., Esquerdo, G., & Everett, M. 2008, ApJ, 683, 1076
- Winn et al. (2009b) Winn, J. N., Johnson, J. A., Albrecht, S., Howard, A. W., Marcy, G. W., Crossfield, I. J., & Holman, M. J. 2009b, ApJ, 703, L99
- Wright (2009) Wright, J. T. 2009, arXiv:0909.0957
- Wu (2003) Wu, Y. 2003, in Astronomical Society of the Pacific Conference Series, Vol. 294, Scientific Frontiers in Research on Extrasolar Planets, ed. D. Deming & S. Seager, 213–216
- Wu (2005) Wu, Y. 2005, ApJ, 635, 674
- Wu & Murray (2003) Wu, Y., & Murray, N. 2003, ApJ, 589, 605
- Wu et al. (2007) Wu, Y., Murray, N. W., & Ramsahai, J. M. 2007, ApJ, 670, 820
- Yoder & Peale (1981) Yoder, C. F., & Peale, S. J. 1981, Icarus, 47, 1
| Planet | a | Roche limit | References | ||||||
|---|---|---|---|---|---|---|---|---|---|
| (AU) | (days) | () | () | () | (AU) | ||||
| HAT-P-12b | b | 0.017 | 1,2 | ||||||
| TrES-4 | c | 0.024 | 3 | ||||||
| WASP-4b | 0.015 | 4,5 | |||||||
| WASP-6b | 0.018 | 6 | |||||||
| WASP-12b | 0.021 | 7 | |||||||
| WASP-15b | 0.022 | 8 | |||||||
| Star | Age | ||||
|---|---|---|---|---|---|
| (K) | (dex) | (Gyr) | |||
| HAT-P-12 | |||||
| TrES-4 | |||||
| WASP-4 | |||||
| WASP-6 | |||||
| WASP-12 | |||||
| WASP-15 | |||||
| ††footnotetext: Notes The references are the same as the ones used for the data in Table 1. The ages are less well constrained and should be taken with caution. |
| Planet | a | ||||||
|---|---|---|---|---|---|---|---|
| solar | solar | solar | solar | solar | solar | ||
| HAT-P-12bb | |||||||
| TrES-4 | |||||||
| WASP-4b | |||||||
| WASP-6bc | |||||||
| WASP-12b | |||||||
| WASP-15bd | |||||||
| Planet | (best-estimate) | |||
|---|---|---|---|---|
| solar | solar | |||
| TrES-4a | ||||
| WASP-4bb | ||||
| WASP-6bc | ||||
| WASP-12b | ||||
| WASP-15b | ||||
| Planet | |||||||||
| solar | solar | ||||||||
| HAT-P-12b | () | ||||||||
| ′′ | |||||||||
| ′′ | |||||||||
| ′′ | |||||||||
| ′′ | |||||||||
| ′′ | |||||||||
| TrES-4 | () | ||||||||
| ′′ | |||||||||
| ′′ | |||||||||
| ′′ | |||||||||
| ′′ | |||||||||
| ′′ | |||||||||
| ′′ | |||||||||
| ′′ | |||||||||
| ′′ | |||||||||
| WASP-4b | () | ||||||||
| ′′ | |||||||||
| ′′ | |||||||||
| ′′ | |||||||||
| ′′ | |||||||||
| ′′ | |||||||||
| ′′ | |||||||||
| ′′ | |||||||||
| ′′ | |||||||||
| ′′ | |||||||||
| ′′ | |||||||||
| ′′ | |||||||||
| ′′ | |||||||||
| Planet | |||||||||
| solar | solar | ||||||||
| WASP-6b | () | ||||||||
| ′′ | |||||||||
| ′′ | |||||||||
| ′′ | |||||||||
| ′′ | |||||||||
| ′′ | |||||||||
| ′′ | |||||||||
| ′′ | |||||||||
| ′′ | |||||||||
| ′′ | |||||||||
| ′′ | |||||||||
| WASP-12b | () | ||||||||
| ′′ | |||||||||
| ′′ | |||||||||
| ′′ | |||||||||
| ′′ | |||||||||
| ′′ | |||||||||
| ′′ | |||||||||
| ′′ | |||||||||
| ′′ | |||||||||
| ′′ | |||||||||
| ′′ | |||||||||
| ′′ | |||||||||
| WASP-15b | () | ||||||||
| ′′ | |||||||||
| ′′ | |||||||||
| ′′ | |||||||||
| ′′ | |||||||||
| ′′ | |||||||||
| ′′ | |||||||||
| ′′ | |||||||||
| ′′ | |||||||||
| ′′ | |||||||||