Suzaku Observations of the Dwarf Nova V893 Scorpii: the Discovery of a Partial X-ray Eclipse
Abstract
V893 Sco is an eclipsing dwarf nova that had attracted little attention from X-ray astronomers until it was proposed as the identification of an RXTE all-sky slew survey (XSS) source. Here we report on the pointed X-ray observations of this object using Suzaku. V893 Sco was in quiescence at the time, as indicated by the coordinated optical photometry we obtained at the South African Astronomical Observatory. Our Suzaku data show V893 Sco to be X-ray bright, with a highly absorbed spectrum. Most importantly, we have discovered a partial X-ray eclipse in V893 Sco. This is the first time that a partial eclipse is seen in X-ray light curves of a dwarf nova. Our preliminary simulations demonstrate that the partial X-ray eclipse can be in principle reproduced if the white dwarf in V893 Sco is partially eclipsed. Higher quality observations of this object have the potential to place significant constraints on the latitudinal extent of the X-ray emission region and thereby discriminating between an equatorial boundary layer and a spherical corona. The partial X-ray eclipse therefore makes V893 Sco a key object in understanding the physics of accretion in quiescent dwarf nova.
1 Introduction
Cataclysmic variables (CVs), in which a white dwarf primary accretes from a Roche-lobe filling, late-type secondary (see Warner 1995 for a comprehensive review), are an excellent laboratory for the physics of accretion. In the subclass of dwarf novae, accretion proceeds via a disk that switches between the low (quiescence) and high (outburst) luminosity states. The visible light of a quiescent dwarf nova is usually dominated by the bright spot, where the accretion flow from the secondary hits the outer edge of the disk, as well as the photosphere of the white dwarf. In outburst, the disk becomes the dominant source of visible light. In contrast, X-ray observations of dwarf novae probe the accretion flow in the immediate vicinity of the white dwarf, such as an optically thin boundary layer (Patterson & Raymond, 1985), since the accretion disk in a dwarf nova is too cool to emit X-rays. Although the disk instability model is a highly successful framework for explaining the dwarf nova outbursts, there are details that defy the prediction of the basic version of the model (Lasota, 2001). In particular, the observed X-ray luminosities of quiescent dwarf nova (often of order 1031 ergs s-1; Baskill et al. 2005) imply an accretion rate onto the white dwarf that is much higher than predicted. Proposed modifications of the disk instability model include the coronal siphon flow (Meyer & Meyer-Hofmeister, 1994), which might lead to accretion over a much wider area of the white dwarf surface than through a boundary layer, and a weakly magnetic white dwarf (Livio & Pringle, 1992). In the latter model, the magnetic field is too weak to control the accretion flow during outburst, but strong enough to do so during quiescence.
V893 Sco is an eclipsing (Bruch et al., 2000) dwarf nova with an orbital period of 1.8 hr (Thorstensen, 1999). According to Kato et al. (2002), V893 Sco has a quiescent magnitude of 14.5, and has an outburst every 30 days during which it reaches magnitude 12.5. Extensive photometry by Warner and collaborators (Warner et al., 2003; Pretorius et al., 2006) have revealed quasi-periodic oscillations and dwarf nova oscillations in V893 Sco, but a strictly periodic signal was never found. Therefore, existing optical data point strongly towards a dwarf nova classification and argue against an intermediate polar (IP, or DQ Her type systems; Patterson 1994) classification. IPs are a subset of magnetic CVs in which the primary’s magnetic field disrupts the inner accretion disk, channeling the flow to the magnetic polar region(s); the spin period of the magnetic white dwarf is a strict clock that characterize IPs. Thus, V893 Sco joins a growing number of eclipsing dwarf novae below the period gap.
Citing the variable shape of the eclipses and the relatively small eclipse amplitude (often less than 0.75 mag), Bruch et al. (2000) argue for a grazing eclipse of the bright spot and the disk, but not of the white dwarf. On the other hand, Matsumoto et al. (2000) argue that the white dwarf is eclipsed, based on the fact that the spectroscopic conjunction of the disk (the red-to-blue crossing of the emission line radial velocities) occurs at mid-eclipse. From the radial velocity curves, they also infer a white dwarf mass of 0.5–0.6 M⊙ and a mass ratio of 0.2–0.3. However, Mason et al. (2001) prefer a higher mass (0.89 M⊙) white dwarf and an inclination angle of 72.5 degrees based on their analysis of the emission line radial velocities, although this value depends in part on the assumed mass-radius relationship for the secondary.
Despite the current lack of a consensus regarding the system parameters, the eclipsing nature of V893 Sco makes it an important target for detailed studies. Moreover, it is a nearby system with parallax-estimated distance of 155 pc (Thorstensen, 2003).
Although the ROSAT detection was already noted by Kato et al. (1998), V893 Sco did not draw the attention of X-ray astronomers until it was listed among the RXTE all-sky slew survey (XSS) sources (Revnivtsev et al., 2004), along with three other dwarf novae (SS Aur, V426 Oph, and SU UMa). The estimated luminosities of these 4 systems are all just under 1032 ergs s-1 in the 2–10 keV band, placing them near the upper end for non-magnetic CVs (– in 0.1–100 keV for the ASCA sample; Baskill et al. 2005). However, the XSS is based on the data taken during slews of the non-imaging RXTE PCA detector. For relatively faint sources such as these dwarf novae, the positional errors are considerable, and misidentification is a possibility. Hence it is important to confirm the proposed identification of XSS dwarf novae. This is particularly true for V893 Sco, which had never been the subject of a pointed X-ray observation above 2 keV. Although V893 Sco is securely detected as a ROSAT all-sky survey (RASS) source, the ratio of XSS (2.38 c/s in the 3–8 keV band) to RASS (0.35) count rates is high, compared to, e.g., SS Aur which has the same RASS count rate but was detected at 0.75 c/s in the XSS 3–8 keV band. This leaves open the possibility that V893 Sco is only a partial contributor to the XSS flux. For this reason and also because of the potential return in studying the X-ray properties of this eclipsing dwarf nova, we performed a pointed observation using Suzaku, along with contemporaneous optical photometry.
2 Observations and Data Reduction
We observed V893 Sco with Suzaku (Mitsuda et al., 2007) between 2006 Aug 26 09:40 and Aug 27 01:20 UT (sequence number 401041010). There are two types of co-aligned instruments on-board Suzaku, which are: 4 units of the CCD-based X-ray imaging spectrometer (XIS), each behind its X-ray telescope (XRT), and the non-imaging hard X-ray detector (HXD). As the source is relatively faint for a non-imaging instrument and the exposure time short, we did not analyze the HXD data, a decision that we justify at the end of §3.1.
We started from data processed using the V2.0.6.13 pipeline. We then updated the energy scale calibration using the 2008 Feb 1 release of the calibration database. Initially we applied the standard screening criteria: attitude control system in nominal mode, pointing within 1.5 arcmin of the mean direction, XIS data rate medium or high, the satellite outside the South Atlantic Anomaly (SAA), at least 436 s after the last SAA passage, elevation above Earth limb , elevation about the bright Earth limb . We then experimented with relaxing some of the standard criteria to maximize the phase coverage of the observation. We found that relaxing the post-SAA passage limit from 436 s to 180 s, and the bright Earth limb limit from 20∘ to 15∘ did not noticeably increase the noise level of our data. With this modification, the total XIS exposure time was 19,174 s, representing a 670 s increase compared to the standard screening. The background level during the screened interval was normal for Suzaku, and varied within 50% of the mean value primarily as a function of the geomagnetic coordinates of the spacecraft.
We found a bright source centered 13.5 arcsec from the precisely known optical position of V893 Sco in the XIS image. Since the current reconstruction of Suzaku attitude results in a 90% error circle of 19 arcsec for bright sources (Uchiyama et al., 2008), we identify the Suzaku source with V893 Sco. Given the statistical quality of the image, the apparent offset is caused predominantly by the attitude reconstruction errors.
We used a 3.5 arcmin radius extraction region for the source and 7.5 and 4 arcmin radius annular extraction region for the background, both centered on the location of V893 Sco as measured on the XIS image. For spectroscopy, we summed the data and the responses of the three XIS units with frontside illuminated (FI) CCD chips, because they have nearly identical responses. The mean net rate of V893 Sco was 0.85 ct s-1 per FI unit, while the estimated background rate was 0.04 ct s-1 in the source region. The data from XIS1 (with the backside illuminated, or BI, CCD chip) have a higher background rate averaging 0.16 ct s-1, although the net source rate was also higher at 0.98 ct s-1. We fit the XIS1 spectrum simultaneously with the sum of FI spectra, after grouping channels so they have a minimum of 25 counts, thus making the statistic an acceptable approximation. For photometry, we added background subtracted light curves from all 4 XIS units over the 0.4 keV (FI)/0.3 keV (BI) to 10 keV bandpass using 8 s bins, preserving the original time resolution of the XIS data. We also extracted light curves below 2 keV, in the 2–4 keV band, and above 4 keV to investigate possible energy dependence.
We also carried out optical photometry of V893 Sco on the nights of 25, 26, and 27 August 2006 using the University of Cape Town CCD Photometer (UCTCCD; O’Donoghue 1995) on the South African Astronomical Observatory (SAAO) 1.9m telescope. The detector is a Wright Instruments Peltier-cooled CCD with a thinned and back-illuminated EEV P86321/T chip. It was used in frame-transfer mode where one half of the CCD is masked and used as a readout area, allowing exposures to be made with essentially no “dead” time between exposures. On the 1.9m telescope, the pixels on the detector correspond to 0.13 arcsec so that it is normal to use 3x3 or greater pre-binning, unless the seeing is better than about 1 arcsec, to ensure optimal data-extraction. Because V893 Sco is relatively bright, integration times of 6 seconds were used on all nights. All observations were made in white light. The CCD was pre-binned at 5x5, 4x4, and 3x3 for the three nights respectively.
Observations were reduced at the telescope using a custom pipeline, which allows the observer to select suitable comparison stars and judge observations. The conventional procedure of reducing observations were followed (bias subtraction, flatfield correction etc.) after which the stellar brightnesses were extracted using the method described in Schechter et al. (1993). Differential corrections were made by using the lightcurve of the brightest nearby star. Due to the small size of the UCTCCD (50x34 arcsec2 on the 1.9m telescope) the only available comparison stars were somewhat fainter than V893 Sco but they were nevertheless used as the differentially corrected lightcurves were deemed to be of better quality than the uncorrected ones. With this set-up, the statistical fluctuation of the data is much less than the intrinsic variability of V893 Sco. Typical number of counts in a 6 s integration was 100,000, and it never dropped below 30,000 even during the eclipse.
3 Results
3.1 X-ray Spectrum
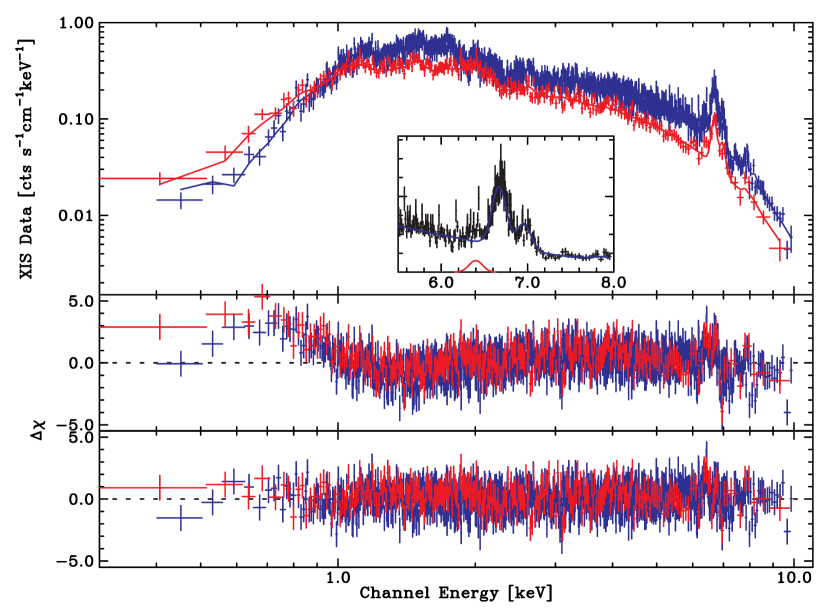
Low resolution X-ray spectra of dwarf novae are generally dominated by an absorbed bremsstrahlung-like continuum and a prominent He-like Fe K at 6.7 keV (Baskill et al., 2005; Pandel et al., 2005). The Suzaku spectrum of V893 Sco is no exception, as shown in Figure 1. The Fe K line indicates the origin in an optically-thin, thermal plasma. Therefore the simplest model consistent with the data is the single temperature plasma model mekal (Mewe et al., 1985, 1986; Liedahl et al., 1995; Kaastra et al., 1996) as implemented in Xspec (Arnaud, 1996). There is a strong reason to believe that this is not a physically correct model for X-ray emission in CVs: the post-shock plasma in CVs loses energy by emitting X-rays and therefore must cool, and cannot remain at a single temperature. However, it is certainly possible for a multi-temperature plasma to have a strong peak in the differential emission measure distribution such that a single-temperature plasma model provides a good fit. For this reason, and to allow easy comparison with other works, we present the results of the mekal model fit in Table 1.
However, as our primary spectral model, we choose the mkcflow model that was originally developed for the cooling flow in clusters of galaxies (Mushotzky & Symkowiak, 1988), but was successfully applied to X-ray emission from CVs (Mukai et al., 2003). In its original context, the cooling flow model assumes a steady-state with a large reservoir of plasma in the outer parts of the cluster at the maximum temperature, kTmax; the plasma cools by emitting X-rays with no additional energy input. This model is applicable to CVs as long as the post-shock region is in a steady state and there are no additional heating or cooling terms beyond X-ray emission.
There are other models of multi-temperature X-ray emission specially developed for magnetic CVs (e.g., Cropper et al. 1999; Suleimanov et al. 2005). However, as Mushotzky & Symkowiak (1988) state (section III): “Assuming that the same mass flow rate pertains throughout the cooling flow, the emission measure for each temperature is determined by the time it takes for the matter to radiate away sufficient energy to cool down to the next temperature shell. The differential emission measure is thus proportional to the reciprocal of the bolometric luminosity at that temperature.” It is therefore unnecessary to solve for the structure of the emission region in order to predict the correct output X-ray spectrum, in the absence of additional heating or cooling terms. Thus, mkcflow serves well a 1st order approximation, both in clusters of galaxies and in CVs.
We present the results of our fit in Figure 1 (for the mkcflow model) and in Table 1 (for both models). Note that we have used a global abundance value in our fits, and in effect it is the Fe abundance we have measured. This is because the only discrete feature evident in the Suzaku spectrum of V893 Sco is the Fe K complex; the abundances of other elements cannot be constrained reliably, in the absence of discrete features. To investigate the Fe K complex further, we fitted an absorbed bremsstrahlung continuum and three Gaussians in the 5–10 keV range. We do not detect any energy shifts or broadening of the Fe lines, although the upper limits are unconstraining due mainly to the modest signal-to-noise ratio of the XIS spectra. In addition to the dominant 6.7 keV (He-like) line with an equivalent width of 40030 eV, we also detected both the H-like line (6.97 keV; 10020 eV) and the fluorescent line at 6.4 keV (4015 eV). The small equivalent width of the 6.4 keV line indicates that optically thick matter (white dwarf surface and an optically thick inner disk; Done & Osborne 1997) covers less than 1 steradian of the sky as seen from the emission region, which would result in an equivalent width in the 100–150 eV range (George & Fabian, 1991). Although we did not include the fluorescent line in the global fit, it is sufficiently weak not to have affected the quality of the fit or the derived parameter values.
We note that the derived abundances depend on our choice of spectral model (Table 1). It is likely that a single temperature mekal model underestimates the Fe abundance, because the best fit temperature is near the peak of He-like Fe K emissivity. In the mkcflow fit, the plasma temperature range extends well outside the peak emissivity of He-like Fe K, hence a higher abundance is required to fit the observed data, and this probably is a more realistic reflection of the true abundances of V893 Sco.
With both mekal and mkcflow models, the use of a single absorber (using the wabs model) resulted in significant residuals particularly below 1 keV (see the middle panel of Figure 1). The fitted NH of cm-2 is too high to be the interstellar column towards V893 Sco at d=155 pc; even the total Galactic column in this direction is only 1.4 cm-2 (Dickey & Lockman, 1990) as reported by the HEASARC Nh tool111http://heasarc.gsfc.nasa.gov/cgi-bin/Tools/w3nh/w3nh.pl. Thus, we conclude that the measured column is dominated by an intrinsic absorber within the V893 Sco binary system. For example, our line of sight to the boundary layer may pass through the inner accretion disk (van Teeseling et al., 1996).
The magnitude of the low energy residuals is far too large to be removed by changing the assumed abundances of the absorber. For example, substituting wabs with phabs model instead, and trying various “solar” abundance values (e.g., those according to Anders & Grevesse 1989 and by Wilms et al. 2000) with the mkcflow model resulted in essentially the same values of reduced (1.32–1.34). One can get an improved fit (reduced =1.09) by changing abundances element by element using the varabs model, but at the expense of non-astrophysical abundances (20 times solar for Na, 0 for Al through Cr, and essentially solar for Fe). On the contrary, the low energy residual was successfully removed by adding an additional partial covering absorber (pcfabs) (see the top and the bottom panels of Figure 1 and Table 1).
We also tried using an additional emission component instead, while keeping just a single wabs absorber. These were not as successful at removing the residuals as the complex absorber: adding a low temperature mekal to mkcflow resulted in =1.08 with residuals below 1 keV, and the addition of a blackbody resulted in =1.04 with residuals below 0.6 keV, compared to =0.766 for the complex absorber fit. Thus, we prefer the partial covering absorber interpretation, also because this is a natural consequence if (as we argue below) the X-ray emission region and the absorber are comparable in size: barring a fine-tuned geometry, an absorber whose size is comparable to that of the emission region cannot completely block our line of sight.
This intrinsic absorber also offers a partial explanation for the high XSS (3 keV, unaffected by absorption) to RASS (2 keV, strongly affected) count ratio. However, source variability must also play a role. Using the best-fit partial-covering mkcflow model, the Suzaku spectrum corresponds to a “predicted” ROSAT PSPC (on-axis) count rate of 0.24 ct s-1. In reality, the vignetting-corrected RASS rate is 0.35 ct s-1, so it was likely brighter during the RASS epoch by a factor of 1.5. For the RXTE PCA, predictions (XSS measurements) are 1.35 ct s-1 (2.38) in the 3–8 keV band for a ratio of 1.7 and 0.51 ct s-1 (0.96) for 1.9 in the 8–20 keV band. This could also be due to source variability. Another possibility is that there was an additional source within the PCA field of view (but outside the Suzaku XIS field of view) during the slew that led to the inclusion of V893 Sco in the XSS catalog.
The 2–10 keV absorbed flux of V893 Sco is 1.7 ergs cm-2s-1, corresponding to a 2–10 keV luminosity of 4.9 ergs s-1 at 155 pc assuming isotropic emission. The 0.4–2 keV absorbed flux is 3.0 ergs cm-2s-1, while the extrapolated flux of V893 Sco above 10 keV is ergs cm-2s-1. This justifies our choice not to analyze the HXD data, since a source at this flux level is undetectable given the current systematic uncertainties in the background reconstruction. The estimated bolometric X-ray luminosity depends on the choice of spectral models (see Table 1), but may be as high as 1.4 ergs s-1, placing V893 Sco among the most X-ray luminous dwarf nova (Baskill et al., 2005).
3.2 Optical Light Curves
We had three purposes in mind for obtaining optical photometry of V893 Sco contemporaneously with the Suzaku observations. First, we wished to ascertain the outburst status of the object. The instrumental white light magnitudes, as measured with the SAAO 1.9 m telescope, were in the range 11.0–11.5, 11.5–12.0, and 11.2–11.8 outside the eclipse, respectively, on the nights of Aug 25, 26, and 27. Since there is a known offset of approximately 3.0–3.2 magnitudes with respect to the standard V band for the typical spectrum of a CV, V893 Sco had V magnitudes of 14.0–15.0 out of eclipse on these nights. That is, V893 Sco was in quiescence during the Suzaku observations.
Our second purpose was to check the orbital ephemeris. We therefore folded the SAAO light curves on the ephemeris of Bruch et al. (2000) and found that the eclipse occurred 0.17 cycles earlier than predicted. There is a narrow, V-shaped core of the optical eclipse lasting 0.03 cycles, presumably indicating the eclipse of a compact light source such as the white dwarf photosphere. We therefore measured the times of the fourth contact, as indicated by the change of slope of the light curve, some 0.015 cycle after the mid-eclipse. We also measured the times of the first contact, indicated by the slight change in slope during ingress, 0.015 cycle before the mid-eclipse, even though there often was ambiguity exactly where this happened. The results for the 6 eclipses (2 were observed on each of the three nights) are listed in Table 2, along with the brightness level relative to the faintest point during that eclipse. On average, we measured a slight steepening of the gradient at Bruch et al. phase 0.80930.005, 0.56 mag above mid eclipse; and the end of the steep part of the egress at Bruch et al. phase 0.83850.0011, 0.47 mag above. We therefore applied a offset of 0.176 to the phases calculated using the Bruch et al. (2000) ephemeris. This is equivalent to adopting a linear ephemeris with a period of 0.075961467 d (cf. 0.075961850.00000012 d of the ephemeris) while keeping the same epoch for cycle 0, although the time gap of 7 years between the Bruch et al. observation and ours is long enough that a quadratic ephemeris may be more realistic.
The final purpose of the optical photometry was a detailed comparison of the X-ray and optical light curves. We will present our analysis of the X-ray light curves in §3.3, and report on our modeling of both the optical and X-ray light curves in §4.3.
3.3 X-ray Light Curves
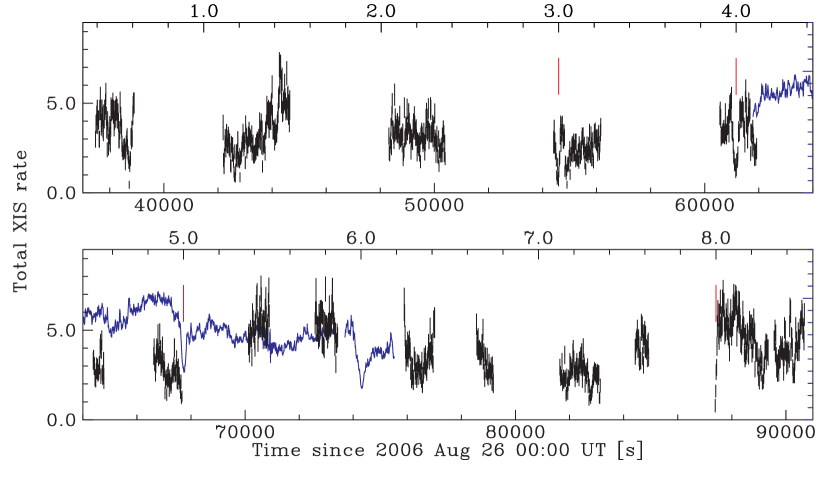
We present the Suzaku light curve of V893 Sco against both time and relative cycle counts (since cycle 34890.0 of Bruch et al. ephemeris, adjusted as described in §3.2) in Figure 2. Due to the restrictions of low Earth orbit satellites, the Suzaku coverage has many gaps, resulting unfortunately in little strict overlap with the SAAO photometry. The phase coverage is highly uneven: it can be seen that phase interval 0.6–0.9, for example, is poorly covered. The Suzaku count rate is variable at all orbital phases, but there are dips whenever the phase of the optical eclipse is covered. The Suzaku data cover the eclipse phase completely twice (at relative cycle count 3.0 and 4.0); in addition, they cover a part of the ingress once (5.0, as the satellite was approaching the night-side limb of the Earth), and the egress once (8.0, as the satellite emerged from the daylight limb of the Earth).
In the folded representation (Figure 3), the X-ray light curve shows a significant dip at the phase of the optical eclipse. It is also clearly variable at other phases, but no other dips of comparable significance are seen. Given the poor phase coverage of the Suzaku data, it is premature to consider any orbital modulations outside the eclipse phase. The apparently greater amplitude of variability during the second half of the orbital cycle (0.5–1.0), in particular, is probably due to the poorer coverage of these phases. Concentrating on the dip at phase 0.0, we investigated its properties in more details to ascertain if it is an eclipse.
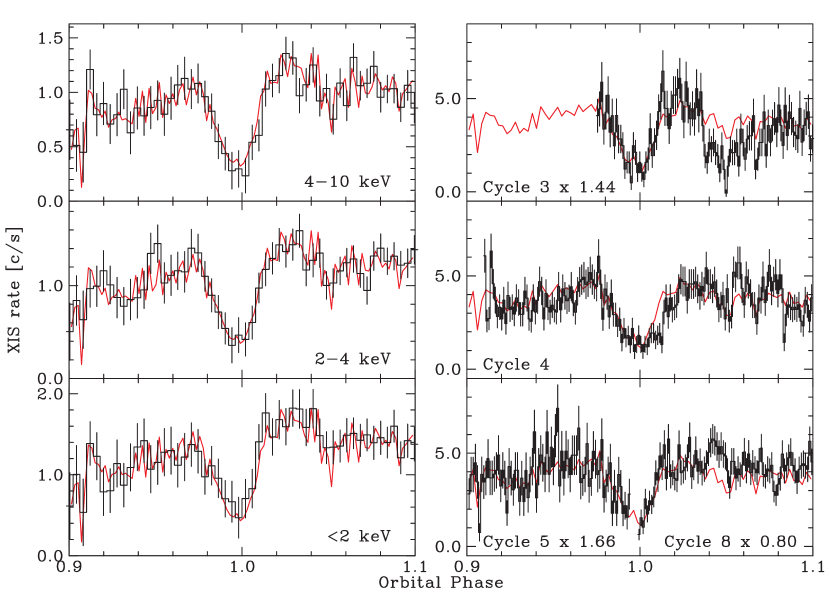
First, we investigated if this dip is energy dependent. In the left half of Figure 4, we show the folded light curve near the eclipse phase in three energy bands, as histograms. Solid lines, repeated in all three panels, are the eclipse profile for the total band. Both the individual and the total-band light curves are simply scaled so that the top of the panel corresponds to 1.2 times the maximum value of all phase bins for that curve. It is clear from these panels that there is little, if any, energy dependence in the depth of this dip. We therefore conclude that this is not an absorption event, e.g., by the outer rim of the disk, or by an extended atmosphere of the secondary.
We also investigated how repeatable the dip was from cycle to cycle. A comparison between the average profile (shown in Figure 3) and individual cycles would be dominated by the slow (1,000 s) variations in the source brightness. For each segment around the eclipse phase, we first calculated the average intensities during phases 0.96–0.98 and 0.02–0.04. We then normalized the individual light curves using the ratio of these “out-of-eclipse” averages, relative to cycle 4. We also calculated the average of the light curves thus normalized. In the right half of Figure 4, we show both the normalized individual profiles (black histogram with error bars) and their average (red line). We confirm that the reduction in count rate is seen every time the eclipse phase is observed. At the same time, there are variations in the light curves from cycle to cycle. This is most apparent in the egress for cycle 4, for which two interpretations are possible. Either the egress was delayed by 0.008 cycle or the total emission was lower by 30–40% during the egress. Given the small number of cycles observed, we must keep in mind the possibility that the ingress is similarly affected by a similar cycle-to-cycle variability.
To summarize, we observe a significant decline in the X-ray count rates during the phase of the optical eclipse (Figure 3). This feature is present every cycle, even though there are variations in the detailed profile from cycle to cycle, and the fractional decrease is independent of the photon energy (Figure 4). We conclude that we have discovered a partial eclipse of the X-ray emitting region by the secondary in V893 Sco.
4 Discussion
4.1 Intrinsic Absorber, Abundances, and Luminosity
The X-ray spectrum of V893 Sco indicates the presence of a partial-covering intrinsic absorber (Table 1) with NH cm-2. Such an absorber reduces the observed count rate in the ROSAT band, but has little effect above 2 keV. Our finding is consistent with the study of van Teeseling et al. (1996), who find that intrinsic absorption in the ROSAT band is a general phenomenon among high inclination non-magnetic CVs. They conclude that this absorber is likely located in the inner disk near the boundary layer. Since the innermost region of the accretion disk has a similar physical dimension as the boundary layer, partial-covering absorption is a likely result.
This interpretation is in conflict with the predictions of the basic version of the disk instability model (see, e.g., Lasota 2001) that typically predicts a surface density of the inner disk of order 1 g cm-2. Viewing the putative boundary layer through such an inner disk should results in NH cm-2. If this is true, the inner disk is optically thick to 7 keV photons, and will produce reflection signatures, including a strong 6.4 keV line (Done & Osborne, 1997). The weakness of the observed 6.4 keV line in V893 Sco excludes the possibility that such a dense (1 g cm-2) disk subtends a large ( steradian) solid angle. Our discovery of a cm-2 partial covering absorber in V893 Sco suggests that the disk may be far less dense than the basic version of the disk instability theory predicts. Note that this same model is already in conflict with other key observations, such as the interoutburst intervals and the quiescent X-ray luminosity (Lasota, 2001).
We note, in passing, that Ramsay et al. (2008) classified three CVs as likely IPs based largely on the complex absorber found in their X-ray spectra. Based on our result on V893 Sco, as well as the similar finding on OY Car (Pandel et al., 2005), we urge caution against using X-ray absorption alone to claim an IP classification.
We infer that the bolometric X-ray luminosity of V893 Sco to be 1.0–1.4 ergs s-1 at the time of the Suzaku observations. V893 Sco therefore appears to be among the most X-ray luminous dwarf novae. Byckling et al. (in preparation) discuss the X-ray luminosity function and temperatures of nearby dwarf novae, including V893 Sco.
4.2 The Partial X-ray Eclipse
The detection of a partial eclipse in a non-magnetic CV is unprecedented. All previous observations of deeply eclipsing, quiescent dwarf novae showed flat-bottomed X-ray eclipses that are consistent with being total, perhaps except for a weak residual contribution from the corona of the secondary (Wood et al., 1995; van Teeseling, 1997; Mukai et al., 1997; Pratt et al., 1999; Ramsay et al., 2001; Wheatley & West, 2003). The transitions into and out of eclipses have been used to constrain the total size of the X-ray emission region to be not much larger than the white dwarf. On the other hand, the partial X-ray eclipse of V893 Sco is also in marked contrast to those of U Gem (Szkody et al., 1996) and WZ Sge (Patterson et al., 1998). These are both lower inclination systems that exhibit a partial eclipse of the outer accretion disk and the bright spot in the optical. There is no X-ray eclipse in these systems, instead showing energy-dependent absorption dips prior to the eclipse. These dips are believed to be caused by photoelectric absorption in an azimuthal structures on the outer accretion disk.
X-ray emission from regions other than the vicinity of the white dwarf and from the corona of the secondary have been considered in the literature. One speculated source is the bright spot region. However, this possibility was comprehensively refuted by Pringle (1977); in particular, the highest shock temperature possible for the bright spot is of order kT1 keV, and therefore this can be discarded for V893 Sco. The other source is the soft X-ray component observed in high accretion rate systems, whose physical origin is unclear. For example, in the XMM-Newton observations of the eclipsing nova-like system, UX UMa, Pratt et al. (2004) found two components of X-ray emission. One is highly absorbed (NH cm-2) thermal (a single temperature mekal fit gives kT=5.5 keV) component and undergoes a total eclipse, and therefore originates from a compact region around the white dwarf. The other component that dominates below 2 keV unabsorbed and does not show total or partial eclipse, and is therefore from a highly extended region. However, this component has the wrong spectral shape and its origin is far too extended to offer an explanation for the partially eclipsed component in V893 Sco. We therefore seek an explanation of the partial X-ray eclipse assuming a compact X-ray emitting region centered on the white dwarf.
We believe that a grazing geometry in which the entire photosphere of the white dwarf is never completely eclipsed can explain both the optical and the X-ray eclipse profiles. To demonstrate that such a geometry is not too contrived, let us consider a plausible set of system parameters and estimate the probability of a partial eclipse of the white dwarf. Given the 1.82 hr orbital period, an assumed mass ratio of 0.25, an empirical mass-radius relationship of the secondary (Patterson, 1984), and a white dwarf mass-radius relationship (Pringle & Webbink, 1975), we estimate a secondary radius R2 of 1.28 cm, a primary radius R1 of 8.86 cm, and a binary separation of 4.73 cm (see Table 3). With these representative numbers, and approximating the Roche-lobe filling secondary as a sphere, the bottom of the white dwarf is just eclipsed at an inclination angle of 73.88∘; the top at =75.88∘, compared to the range of 75.88∘–90∘ for a total eclipse. The key factor is the ratio of the white dwarf diameter to the radius of the secondary, which is 1/7 in this case, and this should be the approximate ratio of systems with partial and total eclipses of the white dwarf photosphere.
All available data are consistent with our interpretation that the white dwarf in V893 Sco is not totally eclipsed. A total eclipse would result in a flat-bottomed optical eclipse. Systems with flat-bottomed light curves are often indicated in catalogs as having a double eclipse: this is the terminology for eclipses that show two episodes of rapid ingress and egress, one caused by the total eclipse of the white dwarf and the second by that of the bright spot, offset in phase because the bright spot is located away from the line of centers of the binary. The white dwarfs in double-eclipsing systems must undergo a total eclipse, because otherwise it would be impossible to separate the ingress of the white dwarf from that of the bright spot. On the other hand, the optical eclipse in V893 Sco is neither flat-bottomed or double (Bruch et al. 2000; this work). Therefore, if the white dwarf is eclipsed at all, it must be a partial eclipse.
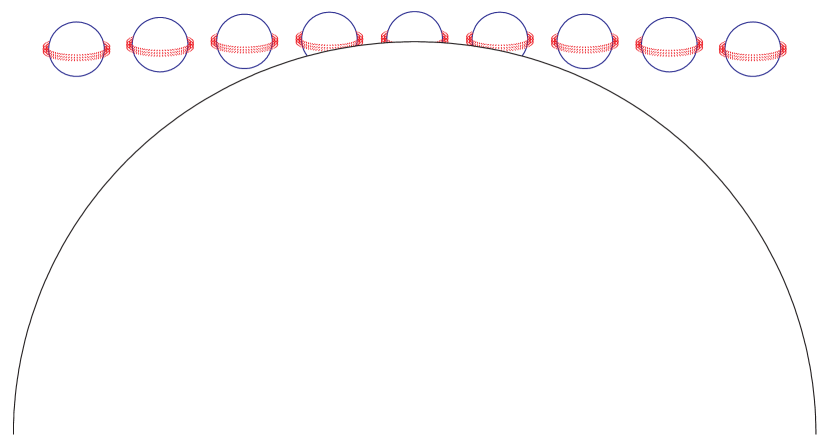
We now consider the X-ray eclipse in such a system assuming three different geometries of the X-ray emission region: Magnetic pole region(s) as appropriate for IPs, a spherical corona that covers the entire white dwarf photosphere, and an equatorial boundary layer. We sketch a possible geometry for the boundary layer case in Figure 5.
The accretion in IPs, by definition, occurs onto an area smaller than the entire surface of the white dwarf. For the IP, XY Ari, Hellier (1997) used the rapidness of the eclipse ingress (2 s) and their phase jitters (individual orbital phases of the third contact varied in the range 0.0543–0.0553) to infer small (0.002 of the total surface area) spots that move on the projected face of the white dwarf as a function of the spin phase. It’s extremely unlikely that such a small spot be partially eclipsed by the secondary. If, on the other hand, two larger spots are located near the rotational poles, a flat-bottomed partial eclipse is a likely result, as we do indeed observe in EX Hya (Rosen et al., 1991). Based on the observed X-ray eclipse profile, and the lack of phase jitters, we believe that an IP or IP-like geometry is highly unlikely for V893 Sco.
Next, we consider a spherical corona surrounding the white dwarf. This simple scenario has the advantage that, if the white dwarf photosphere is partially eclipsed, so must be the corona. Because such a corona is bigger then the white dwarf in every direction, the X-ray eclipse must last longer. The depth of the X-ray eclipse should be similar to that of the white dwarf photosphere, if the latter can be reliably extracted from the optical eclipse. Finally, the X-ray eclipse should be U-shaped, from the limb brightening of an optically thin emission plus the fact that the body of the white dwarf blocks the emission from the far side. Although none of these predicted indicators is seen in V893 Sco, the quality of the current data quality cannot rule out a spherical corona model.
Finally, we consider the boundary layer picture. We must first consider whether a partial eclipse of an equatorial boundary layer is likely. This turns out not to be a severe problem. The reason for this is that, due to the inclination of , the projected equator of the white dwarf is significantly curved, spanning 1/8 of the white dwarf diameter. Thus, even a smallest possible boundary layer of a negligible height and a negligible extent in latitude will suffer a partial eclipse in 1/8 of the partial eclipsing dwarf nova. The probability can only rise with any spatial extent of the boundary layer.
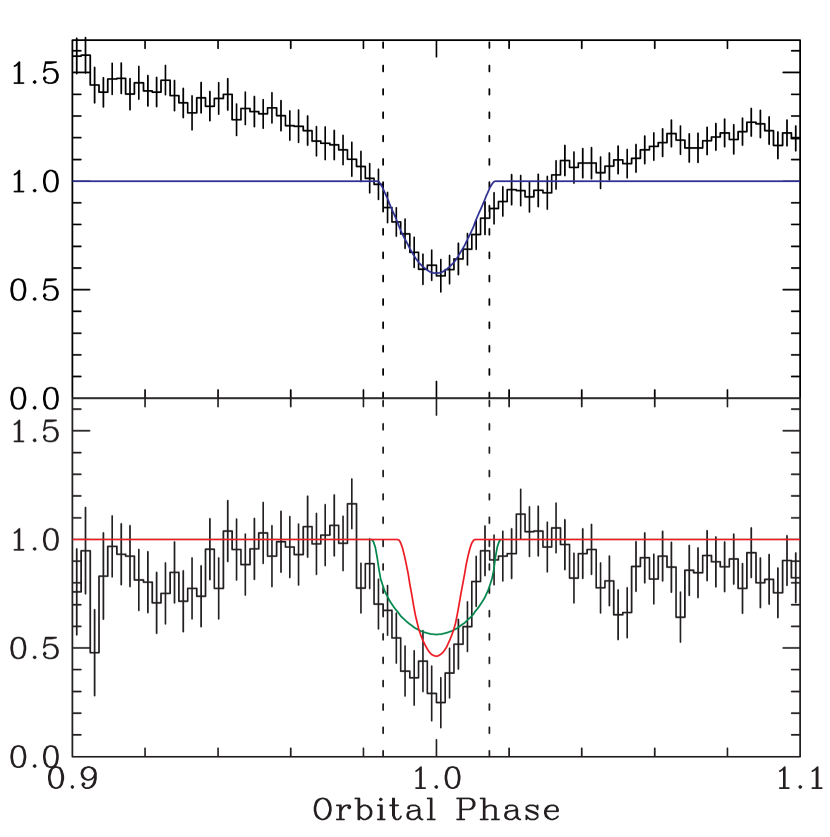
As a pilot study to demonstrate that a partial eclipse interpretation is valid and that future investigations hold the potential to constrain the shape and the size of the X-ray emission region, we have created a numerical model of the optical and X-ray eclipse. We represent the white dwarf photosphere, a boundary layer, or a spherical corona using a set of grid points. We trace the line-of-sight from each point at various orbital phases to determine whether it is visible from Earth, blocked by the body of the white dwarf, or eclipsed by the secondary. We use the same code to produce the schematic diagram (Figure 5) and the model light curves (Figure 6).
For the optical eclipse, we plot the folded optical light curve, normalized to 1.0 at the phase of the first contact of the compact light source (at Bruch et al. phase 0.8093; Table 2). In this initial attempt, we only model the eclipse of the white dwarf photosphere, since there is little information on the location of the bright spot to allow us to construct a reliable model. The eclipse light curve of the photosphere is estimated at 2,000 phase bins. The Earth facing side of the photosphere is divided into 90 zones from the center to the limb, and 360 points in each zone. The parameters of the light curve model are the R1/, R2/, and the inclination angle . These parameters can be narrowed down using astrophysical considerations. For the secondary, we have assumed the empirical mass-radius relationship of Patterson (1984) as before (Table 3). We then assumed a mass ratio = M2/M1 = 0.25, which determines the white dwarf mass, and hence the radius. We then stepped through a range of to reproduce the phases of the first and fourth contacts (Table 2). We find an inclination of =74.2∘ under these assumptions. The model shown reflects the additional assumption that the white dwarf was the dominant light source at first and forth contacts, and that other sources of light are either too faint (likely to be the case for the secondary and possibly also for the accretion disk) or already fully eclipsed. Different conclusions would result if we assume a different value of , or if the narrow eclipse is a combination of white dwarf and bright spot eclipse. As for limb darkening, we have also simulated a case with an extreme limb darkening (=1 following, and using the notation of, Wood & Horne 1990), but this does not make a large enough difference to matter here. The vertical dashed lines in Figure 6 are the ingress and egress timings we measured and used to adjust the orbital ephemeris (§3.2 and Table 2).
For the X-ray light curve, we use the same normalized and averaged version as shown in Figure 4. For the spherical corona model (shown in green), the parameters are R1/, R2/, , and the height of the corona above the white dwarf . The corona is divided into 10 layers in height, 180 degrees of latitude, and 360 degrees of longitude, and assumed to emit uniformly throughout this volume. The system parameter values are the same as those used for the optical eclipse, and we assume a height of 0.2 R1. Changing the height will only affect the width of the X-ray eclipse under the assumption of a spherical corona.
For the boundary layer, we assumed a boundary layer that extends from the equator in latitude (divided into 21 zones), and an X-ray emission region height of 0.2R1 (10 layers), which resulted in the red curve. Both the height and the latitudinal extent affects the depth and the width of the predicted eclipse, but in different directions in the width-depth plane.
These preliminary models reproduce the duration and the depth of both the optical and X-ray eclipses to better than a factor of 2. To proceed to the next level of actually fitting the optical and X-ray light curves, several things must happen. First, the system parameters must be constrained from UV, optical, and IR observations to narrow down the parameter space. The mass ratio is a crucial parameter: once we know , the eclipse light curves will in principle allow us to tightly constrain . It also provides a tight constraint on the white dwarf mass, and hence its radius. Knowing also fixes the initial trajectory of matter leaving the L1 point, hence constrains the possible location of the bright spot. Alternatively, UV spectroscopy has the potential to constrain the white dwarf parameters (Godon et al., 2008). UV photometry may better isolate the white dwarf eclipse from the bright spot eclipse than optical photometry, and allow us to confirm or refute the partial eclipse of its photosphere.
Second, the quality of the X-ray light curve must improve. The statistical quality is one issue, but we also need to observe an increased number of X-ray eclipses to average out cycle-to-cycle variations. Observations from high Earth orbit will help in allowing a better modeling of the longer-term (minutes to hours) variability and to separate that from the eclipse profile.
5 Conclusions
We performed Suzaku observations of the eclipsing dwarf nova, V893 Sco. We confirm that it is an X-ray luminous dwarf nova, and moreover, report the discovery of a partial X-ray eclipse.
In the past, both optical and X-ray observers have concentrated on systems that exhibit a total eclipse of the white dwarf. They provide a strong constraint on the height of the X-ray emission region above the white dwarf. However, eclipse light curves are one-dimensional, and one can only derive one-dimensional constraints from the eclipse analysis. The X-ray emission region, on the other hand, has two dimensions (height and latitudinal extent) assuming azimuthal symmetry. It is therefore necessary to observe an ensemble of eclipsing dwarf novae, in which the limb of the secondary cuts across the emission region from different angles, to be able to constrain the height and the latitudinal extent simultaneously. Inclusion of a partially eclipsing system in such a study will be a huge step forward in our quest to constrain the X-ray emission region size in two dimensions. Future X-ray observations of V893 Sco, together with improved estimates of system parameters from other wavelengths, have the potential to test the boundary layer picture of X-ray emission in quiescent dwarf novae, and furthermore to constrain the latitudinal extent of such a boundary layer.
References
- Anders & Grevesse (1989) Anders, E. & Grevesse, N. 1989, Geochimica et Cosmochimica Acta 53, 197
- Arnaud (1996) Arnaud, k.A. 1996, in “Astronomical Data Analysis Software and Systems V,” ASP Conf. Ser. 101, eds. Jacoby, G. & Barnes, J., p17
- Baskill et al. (2005) Baskill, D. S., Wheatley, P. J. & Osborne, J. P. 2005, MNRAS, 375, 626
- Bruch et al. (2000) Bruch, A., Steiner, J. E. & Gneiding, C.D. 2000, PASP, 112, 237
- Cropper et al. (1999) Cropper, M., Ramsay, G. & Wu, K., 1998, MNRAS, 293, 222
- Dickey & Lockman (1990) Dickey, J.M. & Lockman, F.J. 1990, ARA&A, 28, 215
- Done & Osborne (1997) Done, C. & Osborne, J.P. 1997, MNRAS, 288, 649
- George & Fabian (1991) George, I.M. & Fabian, A.C. 1991, MNRAS, 249, 352
- Godon et al. (2008) Godon, P., Sion, E. M., Barrett, P. E., Hubeny, I., Linnell, A. P. & Szkody, P., ApJ, 679, 1447
- Hellier (1997) Hellier, C. 1997, MNRAS, 291, 71
- Kaastra et al. (1996) Kaastra, J. S., Mewe, R., & Nieuwenhuijzen, H. 1996, in “UV and X-ray Spectroscopy of Astrophysical and Laboratory Plasmas,” Eds. K. Yamashita & T. Watanabe, Tokyo: Universal Academy Press, 1996, 411
- Kato et al. (1998) Kato, T., Haseda, K., Takmizawa, K., Kazarovets, E. V. & Samus, N. N. 1998, IBVS, 4585
- Kato et al. (2002) Kato, T., Matsumoto, K. & Uemura, M. 2002, IBVS, 5652
- Lasota (2001) Lasota, J.-P. 2001, New Astronomy Reviews, 45, 449
- Liedahl et al. (1995) Liedahl, D. A., Osterheld, A. L., & Goldstein, W. H. 1995, ApJ, 438, L115
- Livio & Pringle (1992) Livio, M. & Pringle, J.E. 1992, MNRAS, 259, 23P
- Mason et al. (2001) Mason, E., Skidmore, W., Howell, S.B. & Mennickent, R.E. 2001, ApJ, 563, 351
- Matsumoto et al. (2000) Matsumoto, K., Mennickent, R. E. & Kato, T. 2000, A&A, 363, 1029
- Mewe et al. (1985) Mewe, R., Gronenschild, E. H. B. M., & van den Oord, G. H. J. 1985, A&AS, 62, 197
- Mewe et al. (1986) Mewe, R., Lemen, J. R., & van den Oord, G. H. J. 1986, A&AS, 65, 511
- Meyer & Meyer-Hofmeister (1994) Meyer, F. & Meyer-Hofmeister, E. 1994, A&A, 288, 175
- Mitsuda et al. (2007) Mitsuda, K. et al., 2007, PASJ, 59, S1
- Mukai et al. (1997) Mukai, K., Wood, J. H., Naylor, T., Schlegel, E. M. & Swank, J. H. 1997, ApJ, 475, 812
- Mukai et al. (2003) Mukai, K., Kinkhabwala, A., Peterson, J. R., Kahn, S. M. & Paerels, F. 2003, ApJ, 586, L77
- Mushotzky & Symkowiak (1988) Mushotzky, R.F. & Szymkowiak, A.E. 1988, in “Cooling flows in clusters and galaxies; Proceedings of the NATO Advanced Research Workshop, Cambridge, England, June 22-26, 1987,” Kluwer Academic Publishers, Dordrecht, Netherlands, p53
- O’Donoghue (1995) O’Donoghue, D. 1995, Balt. Astron. 4, 519
- Pandel et al. (2005) Pandel, D., Córdova, F. A., Mason, K. O. & Priedhorsky, W. C. 2005, ApJ, 626, 396
- Patterson (1984) Patterson, J. 1984, ApJS, 54, 443
- Patterson & Raymond (1985) Patterson, J. & Raymond, J.C. 1985, ApJ, 292, 535
- Patterson (1994) Patterson, J., 1994, PASP, 106, 209
- Patterson et al. (1998) Patterson, J., Richman, H., Kemp, J. & Mukai, K. 1998, PASP, 110, 403
- Pratt et al. (1999) Pratt, G. W., Hassall, B. J. M., Naylor, T. & Wood, J. H., 1999, MNRAS, 307, 413
- Pratt et al. (2004) Pratt, G. W., Mukai, K., Hassall, B. J. M., Naylor, T. & Wood, J. H., 2004, MNRAS, 348, 49
- Pretorius et al. (2006) Pretorius, M.L., Warner, B. & Woudt, P.A. 2006, MNRAS, 368, 361
- Pringle & Webbink (1975) Pringle, J. E. & Webbink, R. F. 1975, MNRAS, 172, 493
- Pringle (1977) Pringle, J. E. 1977, MNRAS, 178, 195
- Ramsay et al. (2001) Ramsay, G., Poole, T., Mason, K., Córdova, F., Priedhorsky, P., Breeveld, A., Much, R., Osborne, J., Pandel, D., Potter, S., West, J. & Wheatley, P. 2001, A&A, 365, 288
- Ramsay et al. (2008) Ramsay, G., Wheatley, P.J., Norton, A.J., Hakala, P. & Baskill, D. 2008, MNRAS, 387, 1157
- Revnivtsev et al. (2004) Revnivtsev, M., Sazonov, S., Jahoda, K. & Gilfanov, M. A&A, 418, 927
- Rosen et al. (1991) Rosen, S. R., Mason, K. O., Mukai, K. & Williams, O. R. 1991, MNRAS, 249, 417
- Schechter et al. (1993) Schechter, P.L., Mateo, M. & Saha, A. 1993, PASP, 105, 1342
- Suleimanov et al. (2005) Suleimanov, V., Revnivtsev, M. & Ritter, H. 2005, A&A, 435, 191
- Szkody et al. (1996) Szkody, P., Long, K.S., Sion, E.M. & Raymond, J.C. 1996, ApJ, 469, 834
- Thorstensen (1999) Thorstensen, J. 1999, IBVS, 4749
- Thorstensen (2003) Thorstensen, J. 2003, AJ, 126, 3017
- Uchiyama et al. (2008) Uchiyama, Y., Maeda, Y., Ebara, M., Fujimoto, R., Ishisaki, Y., Ishida, M., Iizuka, R., Ushio, M., Inoue, H., Okada, S., Mori, H. & Ozaki, M. 2008, PASJ, 60, S35
- van Teeseling et al. (1996) van Teeseling, A., Beuermann, K. & Verbunt, F. 1996, A&A, 315, 467
- van Teeseling (1997) van Teeseling A. 1997, A&A, 319, L25
- Warner (1995) Warner 1995, Cataclysmic Variables (Cambridge: Cambridge Univ. Press)
- Warner et al. (2003) Warner, B., Woudt, P.A. & Pretorius, M.L. 2003, MNRAS, 344, 1193
- Wheatley & West (2003) Wheatley, P. J. & West, R. G. 2003, MNRAS, 345, 1009
- Wilms et al. (2000) Wilms, J., Allen, A. & McCray, R. 2000, ApJ, 542, 914
- Wood & Horne (1990) Wood, J. H. & Horne, K. 1990, MNRAS, 242, 606
- Wood et al. (1995) Wood, J. H., Naylor, T., Hassall, B. J. M. & Ramseyer, T. 1995, MNRAS, 273, 772

| Model | NHaaThe equivalent hydrogen column density of the simple absorber | NH,2bbThe column density and the covering fraction of the partial covering absorber | CFbbThe column density and the covering fraction of the partial covering absorber | kT/kTmax | Abund.ccThe global abundance of the plasma, assuming the Solar values of Anders & Grevesse (1989) | LxddExtrapolated X-ray luminosity in the 0.01–100 keV range, which is a good approximation of the bolometric X-ray luminosity, assuming a distance of 155 pc. | |
|---|---|---|---|---|---|---|---|
| (1021 cm-2) | (1022 cm-2) | (keV) | (ergs s-1) | ||||
| mekal | 1.349 | 5.20 | 9.34 | 0.87 | 1.07 | ||
| mekal | 0.951 | 2.86 | 1.96 | 0.51 | 6.85 | 0.61 | 1.15 |
| mkcflow | 1.349 | 6.46 | 32.4 | 1.08 | 1.42 | ||
| mkcflow | 0.928 | 2.68 | 1.85 | 0.60 | 14.5 | 0.73 | 1.28 |
| Eclipse | Transition | HJD | Decline (mag) | Bruch et al. Phase |
|---|---|---|---|---|
| Aug 25-1 | Ingress | 2453973.29557 | 0.63 | 0.81096 |
| Aug 25-1 | Egress | 2453973.29786 | 0.51 | 0.84113 |
| Aug 25-2 | Ingress | 2453973.37131 | 0.54 | 0.80805 |
| Aug 25-2 | Egress | 2453973.37367 | 0.41 | 0.83913 |
| Aug 26-1 | Ingress | 2453974.28288 | 0.55 | 0.80841 |
| Aug 26-1 | Egress | 2453974.28531 | 0.64 | 0.84041 |
| Aug 26-2 | Ingress | 2453974.35892 | 0.56 | 0.80946 |
| Aug 26-2 | Egress | 2453974.36122 | 0.45 | 0.83963 |
| Aug 27-1 | Ingress | 2453975.27046 | 0.57 | 0.80936 |
| Aug 27-1 | Egress | 2453975.27243 | 0.48 | 0.83528 |
| Aug 27-2 | Ingress | 2453975.34644 | 0.40 | 0.80965 |
| Aug 27-2 | Egress | 2453975.34839 | 0.48 | 0.83525 |
| Average | Ingress | 0.560.02 | 0.80930.0005 | |
| Average | Egress | 0.470.04 | 0.83850.0011 |
| Mass RatioaaMass ratio is assumed. Inclination is then derived by assuming that the white dwarf eclipse has a duration from the first contact to the fourth of 0.0292 cycle. | InclinationaaMass ratio is assumed. Inclination is then derived by assuming that the white dwarf eclipse has a duration from the first contact to the fourth of 0.0292 cycle. | SeparationbbSeparation is calculated using the orbital period and the masses of the two components. | M1ccWhite dwarf mass is derived from the secondary mass and the assumed mass ratio; its radius is then derived using the mass-radius relationship. | R1ccWhite dwarf mass is derived from the secondary mass and the assumed mass ratio; its radius is then derived using the mass-radius relationship. | M2ddSecondary mass and radii are derived from the orbital period assuming the empirical mass-radius relationship of Patterson (1984). | R2ddSecondary mass and radii are derived from the orbital period assuming the empirical mass-radius relationship of Patterson (1984). |
|---|---|---|---|---|---|---|
| 0.25 | 74.2 | 4.73 cm | 0.58 M⊙ | 8.86 cm | 0.15 M⊙ | 1.28 cm |