Particle production in collisions at = 17 GeV within the statistical model
Abstract
A thermal-model analysis of particle production of collisions at = 17 GeV using the latest available data is presented. The sensitivity of model parameters on data selections and model assumptions is studied. The system-size dependence of thermal parameters and recent differences in the statistical model analysis of collisions at the super proton synchrotron (SPS) are discussed. It is shown that the temperature and strangeness undersaturation factor depend strongly on kaon yields which at present are still not well known experimentally. It is conclude, that within the presently available data at the SPS it is rather unlikely that the temperature in collisions exceeds significantly that expected in central collisions of heavy ions at the same energy.
pacs:
12.40.Ee, 25.75.DwI Introduction
The statistical model has been used to describe particle production in high-energy collisions for more than half a century fermiheisenberghagedorn . In this period it has evolved into a very useful and successful model describing a large variety of data, in particular, hadron yields in central heavy-ion collisions pbpb ; overview have been described in a very systematic and appealing way unmatched by any other model. It has also provided a very useful framework for the centrality centrality and system-size dependence syssize ; bec of particle production. The applicability of the model in small systems like pp1 and annihilation ee1 has been the subject of several recent publications ee2 ; ee3 ; pppred .
The statistical-model analysis of elementary particle interactions can be summarized by the statement that the thermal parameters show almost no energy dependence in the range of =14 – 900 GeV with the temperature being about 165 MeV and the strangeness undersaturation factor being in the range between 0.5 and 0.7.
In the context of the system-size dependence of particle production, the collisions at = 17 GeV have been analyzed in detail recently. Based on similar data sets, the extracted parameters in different publications deviated significantly from each other: in a previous analysis (Ref. syssize ; pppred ) we derived = 164 9 MeV and = 0.67 0.07, with = 1.7/3, while the authors in Ref. bec obtained = 178 6 MeV, = 0.45 0.02 with = 11/7. These findings motivated different conclusions: In Ref. syssize no system size dependence of the thermal parameters was found, except for which tends to increase when more nucleons participe in the collisions but this rise is weaker than the errors on the strangeness suppression parameter. In Ref. syssize it was therefore concluded that the hadron gas produced in central collisions at = 17 GeV reaches its limiting temperature. Based on Ref. bec on the other hand, it was argued in Ref. na61 that, decreasing and, in particular, increasing temperature towards smaller systems allow for probing QCD matter beyond the freeze-out curve established in Pb-Pb and Au-Au collisions eovern ; wheaton_phd .
The goal of this paper is to understand the origin of these rather different thermal-model results obtained in the analysis of data. We use an up-to-date complete set of data and discuss the sensitivity of the thermal model parameters on their values. We present systematic studies of data used as inputs and the methods applied in their thermal model analysis.
The paper is organised as follows: In Section II we discuss the experimental data on which different analysis are based. In Section III we summarize the main features of the statistical model and present the analysis of the SPS data obtained in collisions. In the final section we present our conclusions and summarize our results.
II Data
The data used throughout this paper for hadron yields in collisions at =17.3 GeV are summarized in Table 1. Data in column Set A were exploit in our previous analysis pppred and the corresponding references are given in the table. If the numerical values deviate in the analysis of Ref. bec , they are listed in column Set B. The relative differences between the particle yields from sets A and B are also indicated in Table 1. The commonly used data in the statistical model description of particles production in collisions at the SPS are displayed below the horizontal line in Table 1.
| Particle | Set A | Set B | Ref | ||
|---|---|---|---|---|---|
| 3.02 0.15 | 3.15 0.16 | 4.4 | 10.5 | dataSPSpi | |
| 2.36 0.11 | 2.45 0.12 | 3.8 | 5.9 | dataSPSpi | |
| 0.258 0.055 | dataSPSK | ||||
| 0.160 0.050 | dataSPSK | ||||
| 0.210 0.021 | 19 | 62 | dataSPSK0s | ||
| 0.130 0.013 | 19 | 74 | dataSPSK0s | ||
| 0.116 0.011 | 0.115 0.012 | 0.9 | 9.1 | dataSPSlam | |
| 0.0137 0.0007 | 0.0148 0.0019 | 8.0 | 171 | dataSPSlam | |
| 0.18 0.04 | dataSPSK0s | ||||
| 0.0400 0.0068 | dataSPSK0s | ||||
| 0.012 0.003 | dataSPSlamstar | ||||
| 0.0120 0.0015 | dataSPSphi | ||||
| 0.0031 0.0003 | na49web | ||||
| 0.00092 0.00009 | na49web | ||||
| 0.00026 0.00013 | na49web | ||||
| 0.00016 0.00009 | na49web | ||||
In Table 2 the experimental data are grouped in sets which are used in Section III to perform the Statistical Model analysis. In the following we motivate the particular choice of data in these sets and discuss how they can influence the model predictions on thermal conditions in collisions.
| Set | Particles | Comment |
|---|---|---|
| A1 | Set of Ref. pppred | |
| A2 | ||
| A3 | ||
| A4 | from Ref. dataSPSK0s | |
| B1 | contribution | |
| B2 | Fit A of Ref. bec | |
| B3 | Fit B of Ref. bec | |
| B4 | Set B1 without |
The data set A1 is most restricted. Firstly, the production yields of and are not included because their numerical values are only preliminary (Ref. na49web ). Secondly, the resonance is also not included so as to restrict the analysis to stable hadrons. Finally, the meson is omitted in Set A1 since this particle is difficult to address in the statistical model due to its hidden strangeness as discussed in Ref. syssize .
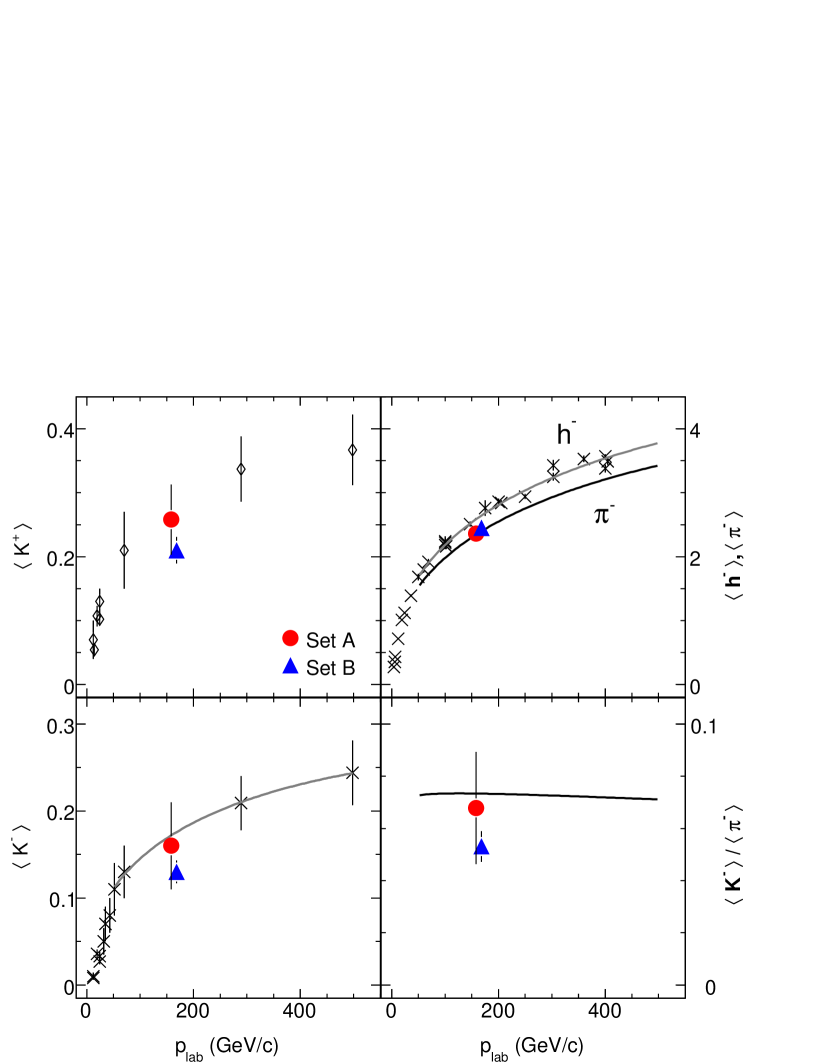
The lower yields of charged kaons in Set B of Table 1 are taken from results published in conference proceedings dataSPSK0s . Such kaon yields are in disagreement with trends from data measured at lower and higher energies as seen in Fig. 1.
The left panels of Fig. 1 show the charged kaon multiplicities from interactions at lower and higher beam momenta compK together with data from Table 1. The lines in this figure are simple parametrizations interpolating to SPS energies. The yield from dataSPSK is seen to be 7% below the expected value from the above parametrization, however agrees within errors. The abundance from dataSPSK0s is by 24% lower and its error is only 10%. As we discuss below, such a low value for the multiplicity of charged kaons influences the statistical model fit in an essential way.
The upper right panel of Fig. 1 shows the negatively charged hadrons from interactions at several beam momenta from Ref. comph . As indicated in Ref. comph the , and supplement the yield. In this case, the ratio / amounts to 91%. Including more sources of feed-down, the / ratio stays at the same level as long as and can be separated. Consequently, to calculate the negatively charged pions from yields one can use the above 91% scaling factor. Figure 1 (top right panel) shows the fit to yields as a function of beam momenta and then by rescaling the expected result for the dependence of the negatively charged pions. The yields of at SPS from Table 1 agree quite well with that expected from an interpolation line shown in Fig. 1. They are only slightly higher, by 1% for yields taken from dataSPSpi and by 5% for yields used in Ref. bec .
The lower right panel in Fig. 1 shows the / ratio at SPS compared to the interpolated data from other beam momenta. The mean value of the / used in pppred is 8% below the interpolated line but agrees within errors, while the corresponding value used in bec is 28% smaller and exhibits an error of only 11%. Clearly, the above differences in the / ratios influence the thermal model fits.
In general, a smaller kaon yield implies a stronger suppression of the strange-particle phase space resulting in a smaller value for the strangeness undersaturation factor . If other strange particles are included, then the strong suppression caused by has to be compensated by a higher temperature. This might be one of the origins for the different thermal fit parameters obtained in Refs. pppred and bec . In order to quantify this we have selected a data set A4 which is equivalent to the Set A1 but with the kaon yields of Ref. dataSPSK being replaced by the values from Ref. dataSPSK0s .
The Set B1 is (besides the ) equivalent to A1 but with numerical values for particle yields from column B in Table 1. The Set B4 is used to demonstrate the influence of the resonance on thermal fit parameters. The Sets A3, B3 and A2, B2 are chosen to study the influence of the meson and the multistrange hyperons on thermal fit parameters.
III Statistical model analysis
The usual form of the statistical model formulated in the grand-canonical ensemble cannot be used when either the temperature or the volume or both are small. As as a rule of thumb one needs for a grand-canonical description to hold hagedornred ; rafeldan . Furthermore, even if this condition is matched but the abundance of a subset of particles carrying a conserved charge is small, the canonical suppression still appears even though the grand-canonical description is valid for the bulk of the produced hadrons. There exists a vast literature on the subject of canonical suppression and we refer to several articles (see e.g. overview ; polishreview ; can1 ).
The effect of canonical suppression in collisions at ultra-relativistic energies is relevant for hadrons carrying strangeness. The larger the strangeness content of the particle, the stronger is the suppression of the hadron yield. This has been discussed in great detail in hamieh .
In line with the previous statistical model studies of heavy-ion scattering at lower energies, the collisions of small ions at SPS revealed syssize that the experimental data show stronger suppression of strange-particle yields than what was expected in the canonical model hotQuarks ; syssize ; lisbon . Consequently, an additional suppression effect had to be included in order to quantify the observed yields. Here we introduce the off-equilibrium factor which reduces densities of hadrons carrying strangeness by rafeldan .
We investigate whether or not all quantum numbers have to be conserved exactly in collisions within a canonical approach by comparing data with two model settings:
-
Canonical (C) Model: all conserved charges, i.e. strangeness, electric charge and baryon number are conserved exactly within a canonical ensemble.
-
Strangeness Canonical (SC) Model: only strangeness is conserved exactly whereas the baryon number and electric charge are conserved on the average and their densities are controlled by the corresponding chemical potentials.
The parameters of these models are listed in Table 3. In the following we compare predictions of the above statistical models with data summarized in different sets discussed above.
| SC model | C model | |||
| Fit parameter | R | S Q R | ||
| Constrained param. | : B/2Q = 0.5 | – | ||
| Fixed param. | – | B = 2 | ||
| Fit / Scan param. | ||||
| No. of parameter | 5 | 6 | ||
| Fit | scan | Fit | scan | |
| No. of free param. | 4 | 2 | 5 | 3 |
| No. of fixed param. | 1 | 3 | 1 | 3 |
III.1 Comparative study of data at SPS
We start from the analysis of data set A1 and modify it stepwise to find out in which way one matches the conclusion of larger temperature in than in central collisions at SPS as indicated in Ref. bec . All numerical values of model parameters are listed in Table 4. A detailed discussion on their choice and correlations is presented in the Appendix based on the systematics.
| SC model results | |||||
|---|---|---|---|---|---|
| Set | R (fm) | ||||
| A1 | 163 5 | 0.68 0.05 | 1.50 0.11 | 208 14 | 1.7/4 |
| A2 | 168 1 | 0.66 0.02 | 1.37 0.03 | 221 8 | 8.6/9 |
| A3 | 190 | 0.5 | 1.1 | 250 | – |
| A4 | 177 5 | 0.59 0.03 | 1.23 0.10 | 233 16 | 5.1/4 |
| B1 | 176 | 0.56 | 1.24 0.01 | 240 12 | 7.7/7 |
| B2 | 179 5 | 0.61 0.02 | 1.19 0.09 | 242 18 | 16/9 |
| B3 | 190 | 0.5 | 1.1 | 250 | – |
| C model results | |||||
| Set | R (fm) | ||||
| A1 | 175 5 | 0.57 0.04 | 1.33 0.09 | – | 0.5/3 |
| A2 | 174 4 | 0.59 0.02 | 1.34 0.08 | – | 6.6/8 |
| A3 | 189 5 | 0.46 0.02 | 1.12 0.09 | – | 23/5 |
| A4 | 181 4 | 0.52 0.03 | 1.22 0.07 | – | 3.5/3 |
| B1 | 177 5 | 0.51 0.03 | 1.30 0.09 | – | 6.8/4 |
| B2 | 180 4 | 0.56 0.02 | 1.23 0.08 | – | 18/8 |
| B3 | 178 5 | 0.45 0.02 | 1.30 0.10 | – | 19/5 |
| B4 | 177 5 | 0.50 0.03 | 1.31 0.09 | – | 4.8/3 |
The fit to data set A1 in the SC model complies with our previous analysis from Ref. pppred , see also Fig. 2 (top). The SC model fit to these data does not change when including hyperons resulting in the same values of thermal parameters and their errors as summarized in Table 4.
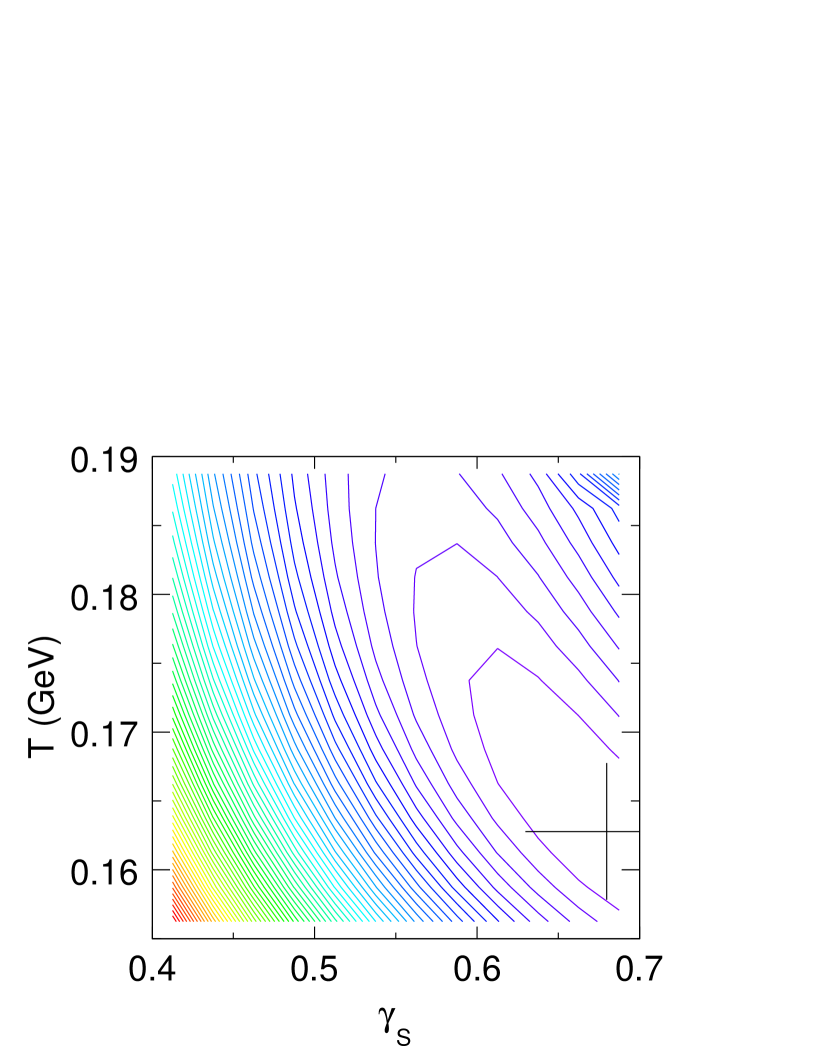
The most striking effect on thermal parameters is expected when replacing the kaon yields in Set A1 (Fig. 3, top) by those from Ref. dataSPSK0s , Set A4, Fig. 2 (bottom). Indeed, smaller kaon yields cause an increase of temperature and a decrease of . These changes come along with a reduced volume and in case of the SC fit with increase of the baryon chemical potential. The kaons from Ref. dataSPSK0s dominate the fit because their errors are 10% while the uncertainties of the and yields, taken from Ref. dataSPSK , are 21% and 31%, respectively. Consequently, the smaller errors dominate the statistical model fit.
In the next step we add , and hyperons resulting in Set A2, see Fig. 3, middle panel. The measured hyperon multiplicities coincide with the model results obtained before, thus within errors the statistical model parameters remain unchanged. We focus on Set A3 and add the meson, Fig. 3 bottom. In this case the temperature is indeed much higher. In the SC model the thermal parameters obtained from the Sets A3 and B3 appear to be meaningless and unphysical due to the meson contribution.
Additional to different kaon data in Sets A and B there are also slightly different values for pions and yields, see Table 1. Compared to results obtained from data Sets A4, in the fit of Set B1 the higher pion yield reduces the strange to non-strange particle ratios resulting in slightly smaller value of . The fit obtained with the Set B4 yields similar results as that obtained from Set B1 indicating that the resonance does not affect the model parameters.
In the canonical (C) model analysis the Sets A1 and A2 tend towards a slightly higher temperature and smaller than that obtained in the SC analysis. The situation is different for Sets A3 and B3 that include the meson. Here in the SC model the temperature is very high and . In the C model the temperature decreases and drops below 0.5. We can conclude that in the case where the meson is included in the fit, one needs to apply the C analysis to get lower temperatures, however with very small values of and a large . For Set B3 the numerical results for and summarized in Table IV coincide with that obtained in Ref bec , however with a larger 111We compare our results to fit B from Ref bec .
IV Discussion and Summary
The statistical-model analysis of hadron yields for collisions at = 17 GeV from Refs. syssize and bec , yield different results and lead to different conclusions on the system-size dependence of thermal parameters syssize ; na61 . In this paper we have reanalyzed the data and studied the sensitivity of the thermal fit to data selection and on model assumptions. We have shown that different conclusions from Refs. syssize and bec are mostly due to differences in data selections.
Slightly different numerical values for charged pions and hyperons used in Refs. syssize and bec as well as the contribution of the resonance altered thermal parameters only within errors. However, the used charged kaon yields in both approaches differ substantially. We have argued that data of kaon yields in Ref. bec deviate from trends seen in data at different energies resulting in a higher temperature.
We have shown that higher kaon yields expected from the systematics in the energy dependence in collisions are in line with data on multi-strange baryons. Unlike the hyperons, when adding the meson the thermal model fit leaves a reasonable range of parameters resulting in a very high temperature exceeding 190 MeV and large . We have quantified the modifications of these results when including an exact conservation of all quantum numbers in the canonical statistical model. We have shown that in the absence of meson the thermal fits are rather weakly influenced by canonical effects due to an exact conservation of the baryon number and an electric charge leading in some cases to a systematic increase of the freezeout temperature. Fits including the meson are sensitive to an exact conservation of all quantum numbers resulting in lower temperatures. However, the thermal model analysis of data sets with hidden strangeness has the largest indicating that this particle cannot be addressed properly in this model.
From our analysis, we conclude that within the presently available data on collisions at SPS energy and uncertainties on thermal parameters obtained from fits within the statistical model, it is rather unlikely that the temperature in collisions exceeds significantly that expected in central collisions of heavy ions at the same energy.
Acknowledgements.
K.R. acknowledges stimulating discussions with P. Braun-Munzinger and support of DFG, the Polish Ministry of Science MEN, and the Alexander von Humboldt Foundation. The financial support of the BMBF, the DFG-NRF and the South Africa - Poland scientific collaborations are also gratefully acknowledged.Appendix A The contours of thermal fits
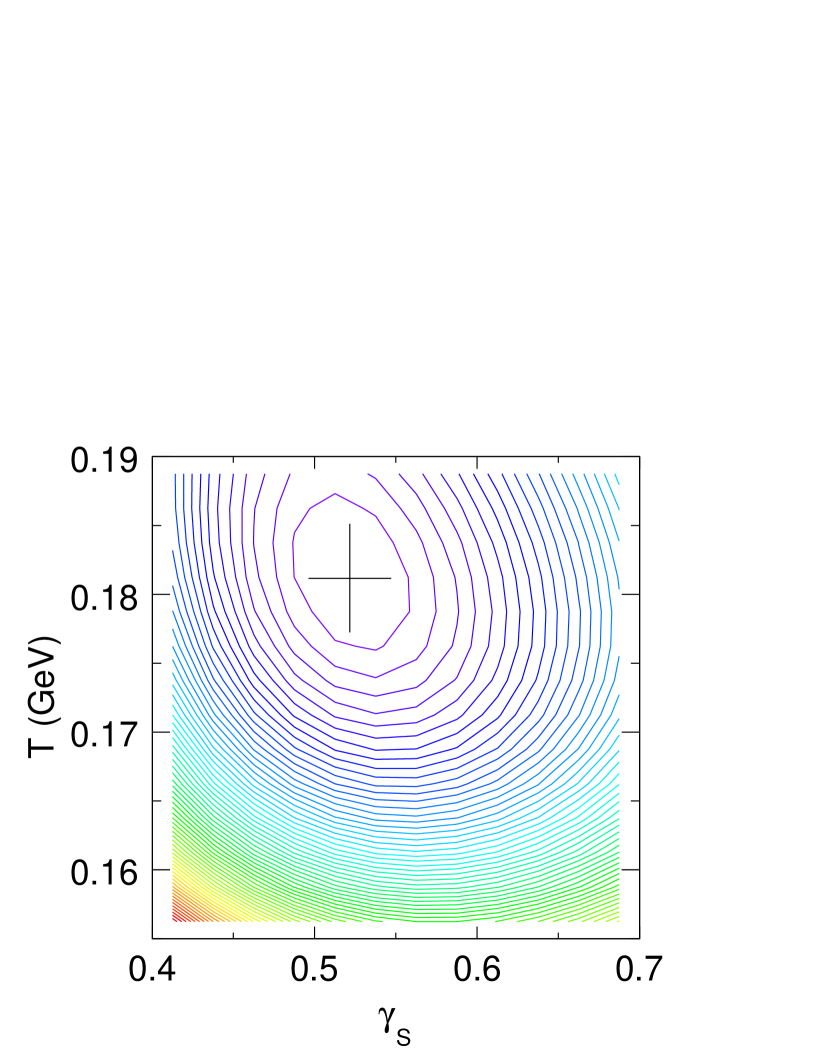
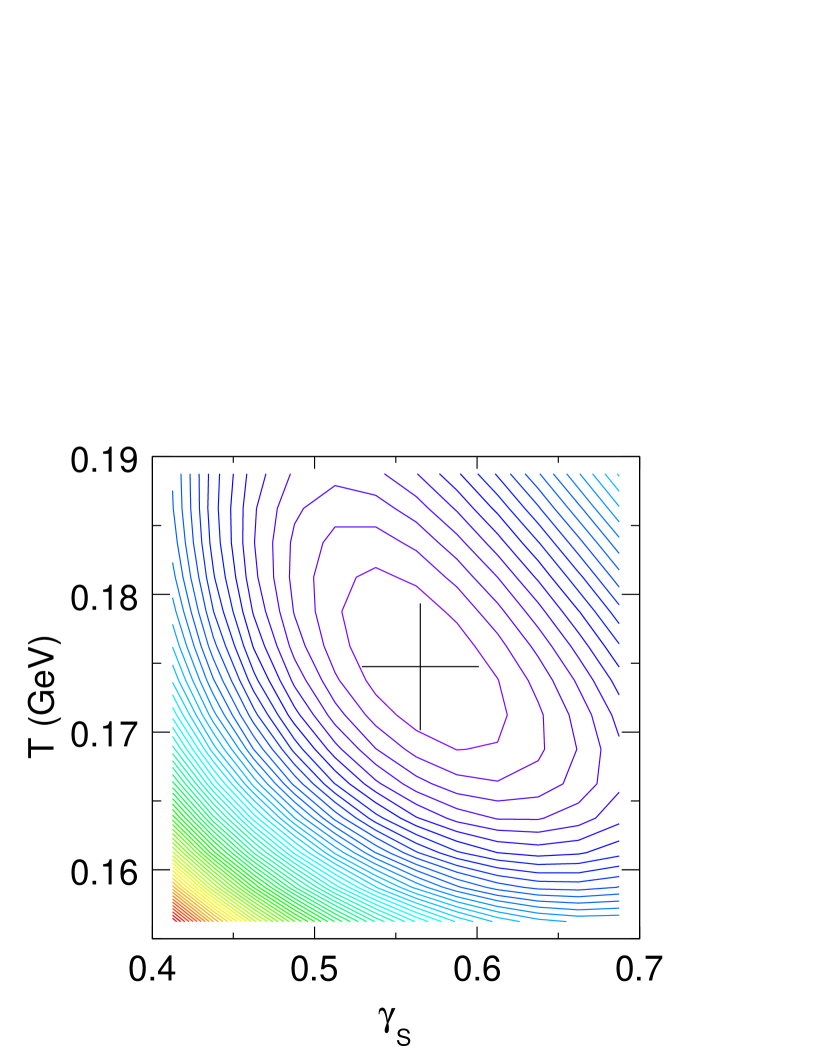
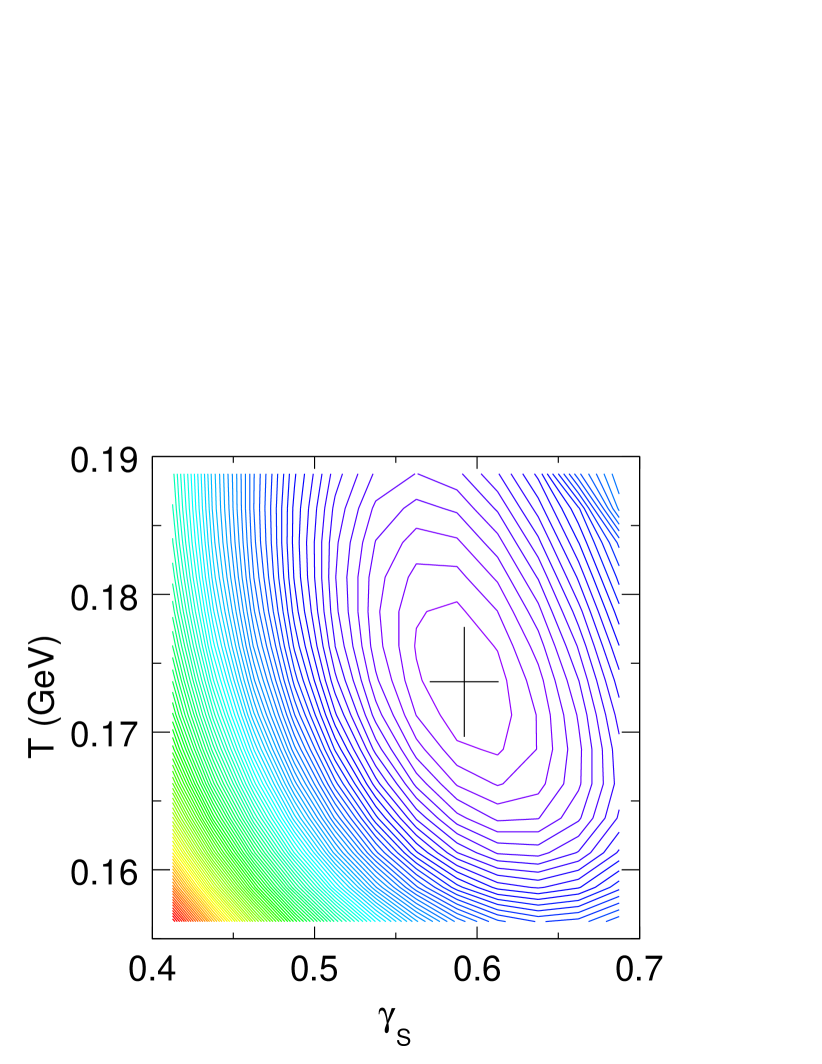
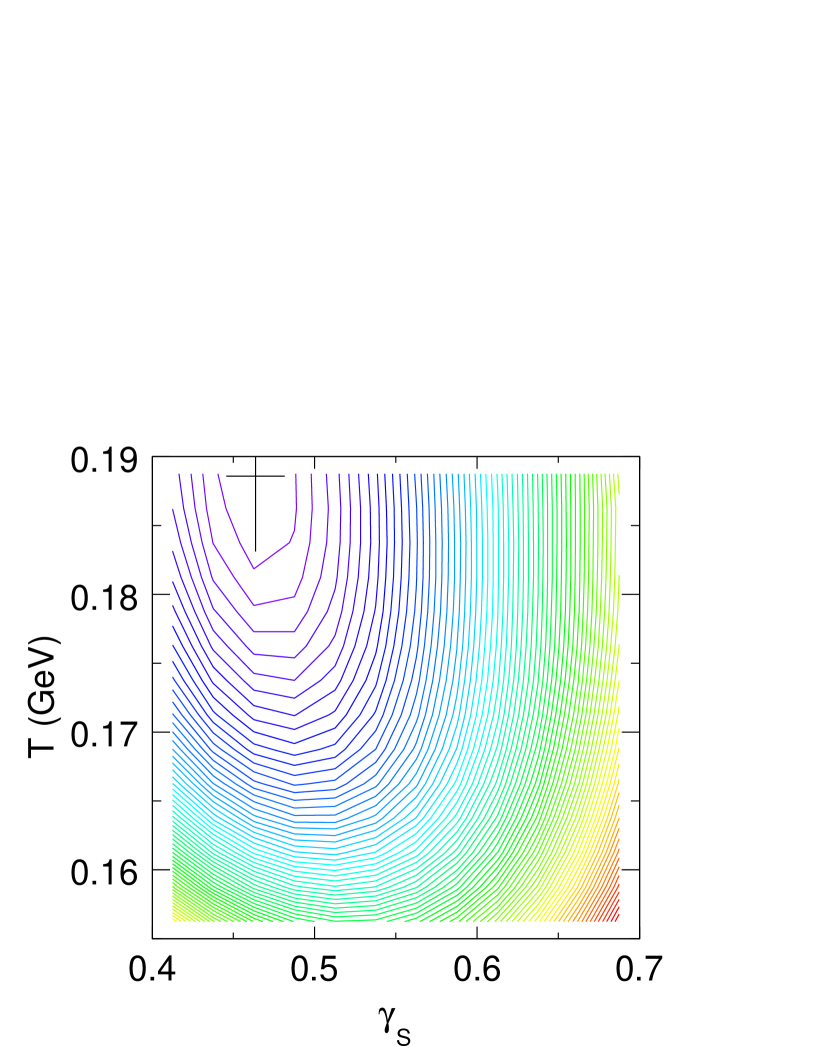
In this appendix we quantify the choice of thermal parameters within the statistical model through -contours in the parameter space. Since the temperature and are of particular interest here the quality of the fits are shown in Figs. 2 and 3 in the -plane. In these figures for fixed -pair the remaining model parameters were fitted and the corresponding was calculated.
Figure 2 (top) shows the analysis of the data Set A1 within the strangeness canonical (SC) model. The analysis in the model with canonical treatment of all conserved charges (C) is shown in Fig. 3 for all data sets besides the Set A4 which is presented in Fig. 2 (bottom).
In the C model description of data Set A1 there is a large region of a very low which manifests the expected anti-correlation of and . Reasonable fits are possible over a large range of parameters. For the Set A2 the minimum is located at the same temperature and slightly higher . The contributions of and baryons disfavor small values of .
The , as seen in Fig. 3, directs fits towards very high temperatures and very strong strangeness suppression. Also the pattern of (–) anti-correlations shows decreasing with increasing temperature at fixed .
References
- (1) E. Fermi, Progress Theor. Phys. 5, 570 (1950); W. Heisenberg, Naturwissenschaften 39, 69 (1952); R. Hagedorn, Nuovo Cimento 35, 395 (1965).
- (2) P. Braun-Munzinger, I. Heppe and J. Stachel, Phys. Lett. B 465, 15 (1999); F. Becattini, J. Cleymans, A. Keranen, E. Suhonen and K. Redlich, Phys. Rev. C 64, 024901 (2001); P. Braun-Munzinger, D. Magestro, K. Redlich and J. Stachel, Phys. Lett. B 518, 41 (2001); N. Xu and M. Kaneta, Nucl. Phys. A 698, 306 (2002); F. Becattini, J. Phys. G 28, 1553 (2002); A. Andronic, P. Braun-Munzinger and J. Stachel, Nucl. Phys. A 772, 167 (2006).
- (3) P. Braun-Munzinger, K. Redlich and J. Stachel, in Quark-Gluon Plasma 3, Eds. R.C. Hwa and X.N. Wang, (World Scientific Publishing, 2004).
- (4) J. Cleymans, B. Kämpfer, M. Kaneta, S. Wheaton and Nu Xu, Phys. Rev. C 71, 054901 (2005); J. Cleymans, B. Kämpfer and S. Wheaton, Phys. Rev. C 65, 027901 (2002).
- (5) I. Kraus, J. Cleymans, H. Oeschler, K. Redlich and S. Wheaton, Phys. Rev.C 76, 064903 (2007).
- (6) F. Becattini, J. Manninen and M. Gazdzicki, Phys. Rev. C 73, 044905 (2006).
- (7) F. Becattini and U. W. Heinz, Z. Phys. C 76, 269 (1997).
- (8) F. Becattini, Z. Phys. C 69, 485 (1996); J. Phys. G 23, 1933 (1997);
- (9) A. Andronic, F. Beutler, P. Braun-Munzinger, K. Redlich and J. Stachel, arXiv:0804.4132 [hep-ph];
- (10) F. Becattini, P. Castorina, J. Manninen and H. Satz, arXiv:0805.0964 [hep-ph].
- (11) I. Kraus, J. Cleymans, H. Oeschler and K. Redlich, Phys. Rev.C 79 014901 (2009).
- (12) M. Gazdzicki, arXiv:0801.4919 [nucl-ex].
- (13) J. Cleymans and K. Redlich, Phys. Rev. Lett. 81, 5284 (1998).
- (14) J. Cleymans and K. Redlich, Phys. Rev. C 60, 054908 (1999); J. Cleymans, H. Oeschler, K. Redlich and S. Wheaton, Phys. Rev. C 73, 034905 (2006).
- (15) C. Alt et al. (NA49 Collaboration), Eur. Phys. J. C 45, 343 (2006).
- (16) A. M. Rossi et al., Nucl. Phys. B 84, 269 (1975).
- (17) T. Anticic et al. (NA49 Collaboration), Phys. Rev. Lett. 93, 022302 (2004).
- (18) J. Baechler et al. (NA49 Collaboration), Nucl. Phys. A 661, 45 (1999).
- (19) S. V. Afanasiev et al. (NA49 Collaboration), J. Phys. G 27 367 (2001).
- (20) S. V. Afanasiev et al. (NA49 Collaboration), Phys. Lett. B 491, 59 (2000).
- (21) These numbers were taken from a compilation of NA49 data available on their web page http://na49info.web.cern.ch/na49info/na49/. They are preliminary, unpublished data taken from a PhD thesis. For a detailed discussion see section II.
- (22) M. Gazdzicki and D. Roehrich, Z. Phys. C 71 55 (1996).
- (23) M. Gazdzicki and D. Roehrich, Z. Phys. C 65 215 (1995).
- (24) R. Hagedorn and K. Redlich, Z. Phys. C 27, 541 (1985).
- (25) J. Rafelski and M. Danos, Phys. Lett. B 97, 279 (1980); B. Müller and J. Rafelski, Phys. Lett. B 116, 274 (1982).
- (26) J. Cleymans, K. Redlich, H. Oeschler and A. Tounsi, Acta Physics Polonica B 33, 1609 (2002).
- (27) J. Cleymans, H. Oeschler and K. Redlich, Phys. Rev. C 59, 1663 (1999); Phys. Lett. B 485, 27 (2000). P. Braun-Munzinger, J. Cleymans, H. Oeschler and K. Redlich, Nucl. Phys. A 697, 902 (2002). J. Cleymans, A. Forster, H. Oeschler, K. Redlich and F. Uhlig, Phys. Lett. B 603, 146 (2004).
- (28) S. Hamieh, K. Redlich and A. Tounsi, Phys. Lett. B 486, 61 (2000).
- (29) I. Kraus, H. Oeschler and K. Redlich, Eur. Phys. J. C 49, 109 (2007).
- (30) I. Kraus, H. Oeschler, K. Redlich, PoS(HEP2005)140 (web only, http://pos.sissa.it/), arXiv:hep-ph/0604242.