Stellar population and dust extinction in an ultraluminous infrared galaxy at
Abstract
We present the detailed optical to far-infrared observations of SST J1604+4304, an ULIRG at . Analyzing the stellar absorption lines, namely, the CaII H & K and Balmer H lines in the optical spectrum, we derive the upper limits of an age for the stellar population. Given this constraint, the minimum method is used to fit the stellar population models to the observed SED from 0.44 to 5.8µm. We find the following properties. The stellar population has an age 40 - 200 Myr with a metallicity 2.5 . The starlight is reddened by . The reddening is caused by the foreground dust screen, indicating that dust is depleted in the starburst site and the starburst site is surrounded by a dust shell. The infrared (8-1000µm) luminosity is . This is two times greater than that expected from the observed starlight, suggesting either that 1/2 of the starburst site is completely obscured at UV-optical wavelengths, or that 1/2 of comes from AGN emission. The inferred dust mass is . This is sufficient to form a shell surrounding the galaxy with an optical depth . From our best stellar population model - an instantaneous starburst with an age 40 Myr, we infer the rate of 19 supernovae(SNe) per year. Simply analytical models imply that 2.5 in stars was reached when the gas mass reduced to 30% of the galaxy mass. The gas metallcity is at this point. The gas-to-dust mass ratio is then . The inferred dust production rate is per SN. If 1/2 of comes from AGN emission, the rate is per SN. We discuss the evolutionary link of SST J1604+4304 to other galaxy populations in terms of the stellar masses and the galactic winds, including optically selected low-luminosity Lyman -emitters and submillimeter selected high-luminosity galaxies.
keywords:
cosmology: observations — dust, extinction — galaxies: individual: SST J1604+4304 — galaxies: evolution — galaxies: stellar content — galaxies: starburst — galaxies: high-redshift — infrared: galaxies1 Introduction
(Infrared Astronomical Satellite) observations discovered numerous infrared galaxies. At bolometric luminosities , infrared galaxies are the dominant population in the local Universe, being more numerous than optically selected starbursts, AGNs, and quasars (Sanders & Mirabel, 1996). By luminosity, infrared galaxies are classified into luminous infrared galaxies(LIRGs) with , ultraluminous infrared galaxies(ULIRGs) with , and hyperluminous infrared galaxies(HyLIRGs) with . The ratio of infrared to visible luminosity, increases with (Soifer et al., 1989). Although there is evidence that an optically buried AGN may exist in LIRGs, there is similarly strong evidence that enhanced star formation is ongoing (Armus et al. 1995; Sanders & Mirabel 1996). Heckman, Armus, & Miley (1990) found that their optical spectroscopic data support the superwind model in which the kinetic energy provided by supernovae (SNe) and winds from massive stars in starburst site drives a large-scale outflow.
The Infrared Space Observatory (ISO) source counts in the mid- and far-infrared extended our knowledge of infrared galaxies up to (Taniguchi et al. 1997;Oliver et al. 1997;Kawara et al. 1998; Puget et al. 1999; Elbaz et al. 1999;Serjeant et al. 2000; Sato et al. 2003; Kawara et al. 2004),and revealed the number of ULIRGs rapidly grew with increasing redshift(Genzel & Cesarsky 2000; Chary & Elbaz 2001; Héraudeau et al. 2004; Oyabu et al. 2005).
The next large advance was made by the Spitzer Space Telescope with the sensitivity to probe infrared galaxies at (see review in Soifer et al. 2008 reference therein). Reddy et al. (2006), using deep Spitzer 24µm observations, examined star formation and extinction in optically selected galaxies, near-infrared-selected galaxies, and submillimeter-selected galaxies (SMGs) at . Spitzer provided a powerful probe to measure redshifts of SMGs, the most luminous infrared galaxy population as HyLIRGs (Pope et al., 2008a). Based on Spitzer mid-infrared data, the diagnostic diagram to separate starburst- and AGN-dominated infrared galaxies has been developed(e.g., Stern et al. 2005; Pope et al. 2008b; Polletta et al. 2008), and it is suggested that in SMGs as well as ULIRGs at is dominated by star formation(Pope et al., 2008a), while many SMGs contain an AGN as evidenced by their X-ray properties. Dey et al (2008) uncovered a new population of dust-obscured galaxies (DOGs). These galaxies have comparable to ULIRGs. However, their is greater than local ULIRGs. DOGs and SMGs as well as high-redshift () ULIRGs are generally considered to be young and massive galaxies, although the nature of the stellar populations is far from being understood. To understand the evolutionary link of these infrared galaxies to optically selected and near-infrared-selected galaxies, it is crucial to observe stellar absorption lines which indicate the age of the stellar populations.
During the course of searching for distant objects in a cluster field, SST J1604+4304 drew our attention with its red optical-3.6µm color. Follow-up study revealed this object is an ULIRG at and its energy source is young stars with an age Myr.
We present the data consisting of optical spectroscopy and photometry from the optical to far-infrared in section 2. We derive an age and metallicity of the stellar population, and show a foreground dust screen is plausible in Section 3. In Section 4, mid- and far-infrared emission by dust and energetics are discussed. In Section 5, we discuss the inferred size of a dust shell surrounding the galaxy, the SN rate and metallicity expected from the broad-band SED analysis, and the dust production rate per SN. The evolutionary link of infrared galaxies to optically selected galaxies is discussed based on the galactic wind models of elliptical galaxies.
We adopt = 70 km s-1 Mpc-1, , and throughout this paper. In this cosmology, the luminosity distance to the object is 7520 Mpc. The flux density is used in units of Jy, which is converted to AB magnitudes through the relation + 23.9.
2 Observations and data analysis
This work is based on the archival data taken by the Spitzer Space Telescope, the Hubble Space Telescope (HST), and the Telescope and new photometric observations performed on the United Kingdom Infrared Telescope(UKIRT) and the 111This telescope is dedicated to the Multicolor Active Galactic Nuclei Monitoring (MAGNUM) project and is installed at the Haleakala Observatories in Hawaii (Yoshii, 2002). telescope. In addition, the Gemini Telescope North was used to do optical spectroscopy.
2.1 Target
SST J1604+4304 has been found at
R.A. 16h 04m 25538
decl. +43°04′2655,
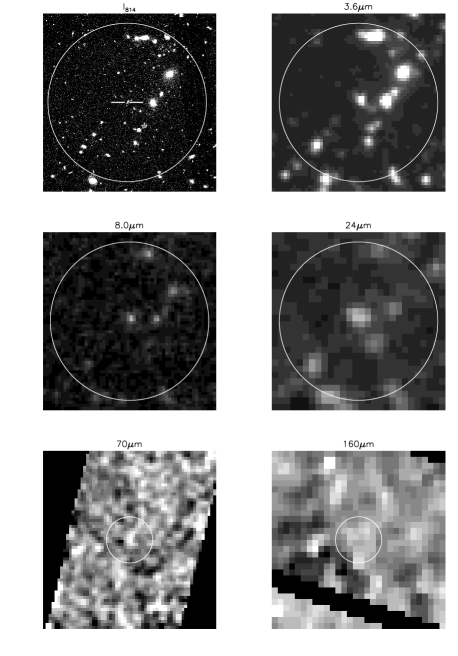
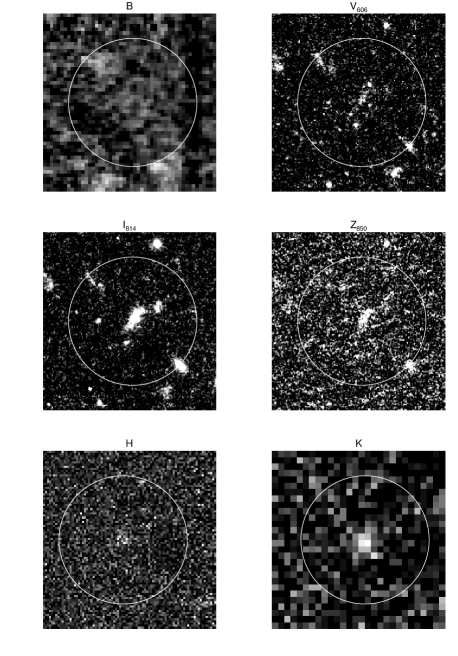
in the J2000 system in a field observed with the IRAC instrument. The optical counterpart in the data is located within the 04 offset accuracy requirements of (Werner et al., 2004). Images of SST J1604+4304 are given in Figures 1 and 2. The broad-band fluxes are given in Table 1.
SST J1604+4304 is only 32″away from the center of the massive galaxy cluster CL 1604+4304 at (Gal & Lubin, 2004). Based on a weak-lensing analysis, Margoniner et al. (2005) find the mass contained within projected radius is , corresponding to an inferred velocity dispersion 1004 199 km s-1. Thus, using a singular isothermal sphere, we obtain the magnification for SST J1604+4304 (Schneider,P., Ehlers,J., & Falco, 1992).
2.2 data
All IRAC and MIPS data sets were retrieved from the public archive. The IRAC data consist of four broadband images at 3.6, 4.5, 5.8, and 8.0 µm. The field-of-view is nearly 52 52 with a linear scale of approximately 122 pixel-1. The reader is referred to Fazio et al. (2004) for a complete report on the in-flight performance of IRAC. In the pipeline processing, ten BCD FITS images were co-added into a single mosaic image per band with a technique similar to ’drizzle’. The total effective exposure time is 1936 sec pixel-1 per band. Photometry was performed using a 3 pixel (37) radius aperture. As can be seen in the 3.6µm image in Figure 1, there are two sources which can contribute to the flux within the photometric aperture; a faint source is at 65 to the southwest and a bright source 10″to the west. Using the point-spread function which is available on the IRAC website, their contributions were estimated to be 3.1 - 4.3 % of the flux of SST J1604+4304 depending on the photometric band. The total fluxes after applying the aperture correction are given in Table 1. The quoted errors include 5% absolute calibration uncertainty that SSC222See Infrared Array Camera Data Handbook recommends for general observers. Note that the color correction is very small and ignored.
The MIPS data were taken at 24, 70, and 160 µm in 2004 March. In the pipeline processing, the mapped BCD data were rebinned and coadded to a single image with a linear pixel scale of 245, 40, and 40 pixel-1 for 24, 70, and 140 µm, respectively. The total integration times are 93, 53, and 84 sec pixel-1. In the following analysis, we use the following post-BCD products, namely, mosaic images for 24µm and filtered mosaic images for 70 and 160µm. 24µm photometry was performed using a 7″radius aperture. The contributions, to the flux within the photometric aperture, from the two sources (see the 24µm image in Figure 1), located approximately at 15″to the west-northwest and 13″to the southwest, were estimated using the point-spread function on the MIPS website. Their contributions are 9% of the flux within the aperture. Then, the color correction for 500K blackbody and the aperture correction were applied.
MIPS 70 and 160 µm photometry was performed using 16″and 32″radius apertures, respectively. As seen in Figure 1, SST J1604+4304 is faint in the far-infrared. We measured sky fluxes with the same aperture at 10 or 11 positions along the annulus with radii of 36″- 72″at 70µm and 96 - 150″at 160µm. The flux averaged over these sky fluxes was subtracted from the flux measured within the object aperture centered at SST J1604+4304. The aperture correction and the color correction for 30K were applied. The detections are 2.5 and 5.0 at 70 and 160µm, respectively. As seen in the 24µm image in Figure 1, there are several 24µm sources within the 160µm photometry aperture. Judging from their [3.6µm]-[24µm] color and 70 and 160 µm brightness at their respective positions, the source at 135 to the west-northwest, the only source as red as SST J1604+4304, may contribute 1/3 of the flux within the aperture at most. The 160 µm flux is 38.4 7.65 mJy if the contributions from this source can be ignored, while the flux is 25.6 7.65 mJy if this source contributes 1/3 of the flux within the aperture. The real flux of SST J1604+4304 should be between them, and thus the flux is 32 14 mJy. The aperture correction and the color correction for 30K blackbody were applied. Note that the 24µm error in Table 1 includes 4% absolute calibration uncertainty333Multiband Imaging Photometer for Spitzer (MIPS) Data Handbook.
2.3 Optical imaging data
The , , and image data were retrieved from the public archive, where , , and denote the , , and , respectively. The Advanced Camera for Surveys (ACS) Wide Field Camera (WFC) was used, which covers a field of 34 34 with a scale of 005 pixel-1. Four image data were combined into a single co-added image per band. The total exposure times are 4840 sec pixel-1 for and and 6000 sec pixel-1 for . The image in Figure 2 shows that SST J1604+4304 has irregular morphology extending 16 in the NW direction with a 06 width. To determine the total flux of this object, photometry was performed using 08, 10, 12, and 20 radius apertures. The flux grows from 08 to 12, while it barely increase from 12 to 20. Note that contributions from the two nearest sources were subtracted from the flux measured with the 20 radius aperture. Thus, the flux measured with the 12 radius aperture represents the total flux of SST J1604+4304. The ratio of the flux with a 08 aperture to a 12 aperture is 1.24 0.05. and photometry was performed using a 08 aperture. The resultant fluxes were converted to the total fluxes by multiplying 1.24 0.05, because we did not measure significant changes in optical colors across the target. The total fluxes are given in Table 1. The errors in Table 1 include the error of aperture conversion from 08 - 12 and the correction for correlated noise in drizzling.
data were retrieved from the SMOKA science achieve. The data were taken with Suprime-Cam (SUP) imager which has a field-of-view of 34′ 27′with a scale of 02 pixel-1. The total exposure time is 2880, 2520, 3600, 1680, 3300 sec pixel-1 after co-adding 4 to 11 image frames, using the standard SUP script (Yagi et al., 2002). Flux scaling was performed observing 11 standard stars given by Majewski et al. (1994). photometry were performed using three apertures with a radius of 10, 12, and 20, and it was confirmed the brightness distribution is identical to that measured at the photometry band. Thus, we use the 12 radius aperture centered on SST J1604+4304 to obtain the fluxes given in Table 1. The errors in Table 1 include 5% photometric uncertainty.
2.4 H/K imaging observations
The -band image was taken with the UIST (1-5 micron imager spectrometer) on in February 2006. UIST was used in the imaging mode with a field-of-view of 2′ 2′and a scale of 012 pixel-1. The total exposure time is 1800 sec pixel-1 after co-adding individual image data with a integration time of 60 sec. The sky condition was photometric with 06 seeing. The K-band image was taken with the multicolor imaging photometer (MIP) on the 2 m telescope (Kobayashi et al. 1998;Minezaki et al. 2004) in August 2006. MIP has a field-of-view of 15 15 with a linear scale of 0346 pixel-1. The total integration time is 2340 sec pixel-1 after co-adding individual image data. The weather condition was photometric with 1″seeing. Flux calibration was performed using 2MASS 16042631+4303413 (H=14.36, K= 14.39) observed simultaneously with SST J1604+4304. Photometric uncertainty is 5% and 9% for H and K, respectively.
| Filtera | Total flux | b | Instrument | UT |
|---|---|---|---|---|
| band | Jy | arcsec | yy/mm | |
| 0.224 0.062 | 1.2 | ACS | 03/08 | |
| 1.2 | ACS | 03/08 | ||
| 1.2 | ACS | 07/02 | ||
| 3.6µm | 3.7 | IRAC | 04/03 | |
| 4.5µm | 3.7 | IRAC | 04/03 | |
| 5.8µm | 3.7 | IRAC | 04/03 | |
| 8.0µm | 3.7 | IRAC | 04/03 | |
| 24µm | 7.0 | MIPS | 04/03 | |
| 70µm | 16 | MIPS | 04/03 | |
| 160µm | 32 | MIPS | 04/03 | |
| 1.2 | SUP | 00/06 | ||
| 1.2 | SUP | 05/05 | ||
| 1.2 | SUP | 01/04,05 | ||
| 1.2 | SUP | 01/04 | ||
| 1.2 | SUP | 01/06 | ||
| 1.2 | UIST | 06/02 | ||
| 1.2 | MIP | 06/08 | ||
| 20cm | mJyc | 2.7 | e | 1995 |
| 0.2-2 keV | d | 15 | f | 02/02 |
| 2-10 keV | d | 15 | f | 02/02 |
a denote F606W,F814W,& F850LP, respectively.
b The radius of the photometric apertures which were used to obtain the total fluxes.
c To 3 .
d To 3 in units of erg cm-2 s-1.
e From the FIRST survey (White et al., 1997).
f Observed by Lubin, Mulchaey, & Postman (2004). The FLIX online server was used to derive the upper limit.
2.5 Optical spectroscopy
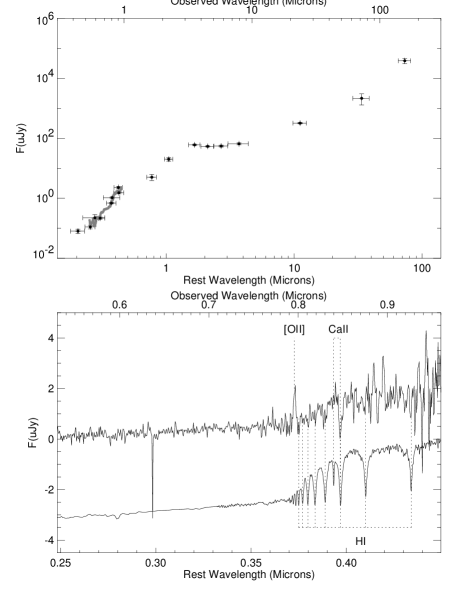
Optical spectroscopy was carried out using the Gemini Multi-Object Spectrograph (GMOS) on the Gemini-North telescope in 2007 August. The R150_G5306 grating was used along with the OG151_G036 filter, covering 5,000 - 10,000 Å simultaneously with 6.96 Å/pixel after binned by 4 in the dispersion direction. The different wavelength centers (8,200 and 8,250 Å) were set to fill the CCD gaps. A 10 width slit was set so that the dispersion direction is perpendicular to the long axis of the target. Seven 1800 sec exposures were taken in the Nod & Shuffle mode. Data were reduced in a standard manner using the IRAF GEMINI.GMOS package. The sky subtraction was made with the GNSSKYSUB routine. Wavelengths were scaled with CuAr spectra and the relative photometric calibration was performed using the standard star (HZ44). The results are shown in the bottom panel of Figure 3. The spectrum which is median-smoothed with a width of 40 pixles (i.e., 280 Å), is compared with the photometry from the images in the top panel of Figure 3. The two measurements agree with each other.
3 stellar populations and dust extinction
3.1 Spectroscopic diagnosis
The redshift of SST J1604+4304 is 1.135, as identified in Figure 3. The synthetic spectrum is also shown for comparison. This spectrum was made using the instantaneous-burst model (Bruzual & Charlot, 2003) at an age 400 Myr, reddened by E(B-V) = 0.6. The UV-optical spectrum is characterized by stellar absorption lines, which are Hϵ at 3970 Å, Hζ at 3889 Å, and probably higher order lines in the HI Balmer series as well as possible presence of the CaII HK absorption lines at 3968 and 3934 Å. The emission line of [OII] at 3727 Å is detected. No lines indicating the presence of an AGN, such as MgII2798 and [NeV]3346,3426, are detected. The 3 upperlimit of the MgII EW (equivalent width) is 22 Å, assuming a FWHM 6000 km s-1 for the line width. This upper limit is small compared to 52 Å which is the MgII EW of the composite spectrum obtained from 184 quasi-stellar object by Telfer et al. (2002). There are no signs indicating AGN emission at other wavelengths including X-ray and radio as shown Table 1. Thus, we assume that the UV-optical spectrum is dominated by starlight.
The amplitude of the 4000 Å discontinuity is known as a useful tool to measure the age of stellar populations(eg., Bruzual 1983; Matsuoka et al. 2008). However, it is not simple to correct for the reddening for heavily obscured objects like SST J1604+4304. Alternatively, the equivalent widths of CaII K and Balmer H lines are used to scale ages of star clusters (Rabin 1982; Santos & Piatti 2009). Here We use the index which is defined as D(CaII) = 2 EW(CaII K)/[EW(Hζ)+EW(CaII H + Hϵ)], where EW(CaII K) is the equivalent width for the CaII K line, EW(Hζ) for the Hζ line, and EW(CaII H + Hϵ) for the blends of the CaII H & Hϵ lines. The equivalent width is obtained by integrating across the line as EW = , where . in Å is (3871, 3909), (3926, 3940) and (3951, 3990) for Hζ, CaII K, and CaII H + Hϵ, respectively. is the observed flux density and is the continuum across the line, which is derived by fitting a linear function to assumed continuum points on either side of the line profile. Thus, we have D(CaII) = 0.03 0.11 for SST J1604+4304. where EW(CaII K) = 0.4 1.4 Å, EW(Hζ) = 7.6 2.1 Å, and EW(CaII H + Hϵ) = 16.7 2.2 Å.
Figure 4 shows D(CaII) measured in synthetic spectra for various metallicities as a function of ages of stellar populations. The synthetic spectra were obtained based on the instantaneous-burst models (Bruzual & Charlot, 2003) for metallicities = 0.005, 0.02, 0.2, 0.4, 1, and 2.5 . The horizontal line shows the constraint from the observed D(CaII) at 1, 2, & 3 upper limits. This diagram indicates that the inferred age of SST J1604+4304 depends on the metallicity; the 3 constraint is 1,000 Myr for , 750 Myr for 0.4 ,600 Myr for 1.0 ,and 400 Myr for 2.5 .
The [OII]3727 line flux is ergs cm-2 s-1. Its implications for the star formation rate (SFR) will be discussed later.


3.2 Analysis of the UV to near-infrared SED
We explore the nature of stellar populations and interstellar material in SST J1604+4304, by fitting model spectra of stellar population models to the observed SED from the to 5.8µm band. The 8.0µm band is not included in this analysis, because emission from hot dust would be significant in this band. The evolutionary synthesis codes, BC03 (Bruzual & Charlot, 2003) are used to generate synthetic spectra of evolutionary stellar population models. The initial mass function (IMF) by Chabrier (2003)(his table 1) is adopted with a lower and upper mass cutoff at 0.1 and 100 , respectively.
We use two extinction laws, namely, the starburst extinction curve by Calzetti (2001) and the Milky way (MW) extinction curve by Draine (2003). The starburst extinction curve was derived from the data in the UV and optical wavelength range of local starbursts and blue compact galaxies (Calzetti, Kinney, & Storchi-Bergmann, 1994). We consider two extreme cases of geometrical distribution of dust, namely, a foreground dust screen and internal dust model. In case of the foreground dust screen, dust is uniformly distributed in the screen which is physically distant from star clusters, so we observe where is the optical depth of the dust screen and is unextincted radiation. In the internal dust model, dust and stars are uniformly mixed and the model schematizes the situation in which dust is purely internal to the staburst site, so we observe , where is the albedo. Note that we assume the isotropic scattering.
Calzetti (2001) gives the extinction curve in a narrow range from 0.12 - 2.2 µm. To analyze multi-wavelemgth data from the UV to infrared, the extinction curve should be extended to wavelengths 2.2 µm. The analytical expression given by Calzetti (2001) cannot be used for this extension, because the expression makes extinction values sharply drop beyond 2.2 µm. The Calzetti’s extinction curve is almost identical to the Draine (2003) MW curve from 0.6 -1.6 µm. We thus extend the Calzetti’s curve to longer wavelenths by adopting the MW extinction curve for wavelengths 1.6 µm. In addition, because Calzetti (2001) does not provide the albedo, we adopt the albedo given in Draine (2003) for the Calzetti’s extinction law with removing the dip in the albedo which is attributed to the familiar 2175 Å feature.
We start with instantaneous-burst models where all stars formed at once. The best model fit was searched for the observed SED by simultaneously optimizing the parameters, i.e., flux-scales, ages of stellar populations , extinction intrinsic to SST J1604+4304, and metallicities of the stellar populations(). The ranges of the parameters are = 0.01 - 6 Gyr, = 0.0 - 2.0 for the foreground dust screen and = 0.0 - 12.0 for the internal dust model, and = 0.005 - 2.5 .
The results are summarized in Figures 5 and 6. The best-fit was obtained for = 40 Myr, E(B-V) = 0.8, and with the foreground dust screen combined with the Calzetti (2001) extinction law, resulting in a reduced chi square of 5.2. This is the minimum among all the models analyzed in this work. We thus refer to this minimum as , and the increment relative to is represented as (Avni, 1976). The approximate values of are 1.15, 1.83, and 2.77 for 68%, 95%, and 99.6% confidence in this case(i.e., the degree of freedom is = 10).
The foreground dust screen with the MW extinction law is ruled out, because of the too large . The internal dust models are ruled out either for two reasons: (1)inferred ages of the stellar populations are too large to be fit within the range allowed by the D(CaII) index; (2) is too large, i.e., for the models and for . For example, the best model for the internal dust geometry is obtained for . As can be seen in the bottom panel of Figure 6, the inferred age is = 0.7 - 0.8 Gyr. This age is not allowed because the age range must be 400 Myr, corresponding to the 3 D(CaII) limit for , as indicated in Figure 4. Figure 5 shows that models with a rich metallicity give better fit to the data than those with a low metallicity. The sensitivity to metallicity arises from the broad concave feature around rest 7000Å, as shown in Figure 7. This feature is very weak in low metallicity spectra and becomes outstanding toward the high metallicity.

We also examined models with the exponentially declining star formation rate, which is represented by , where is the e-folding timescale and is the time after the onset of the first star formation. ranges from 0.01 - 5.0 Gyr in a step of 0.5 dex and from 0.01 - 7 Gyr. The Calzetti’s extinction law was used in the uniform dust screen geometry. All models with are rejected because they have . The D(CaII) index allows 2.5 models to have 500 Myr, corresponding to 3 D(CaII) limit for exponentially declining star formation444For a given age of galaxies, D(CaII) is smaller in exponentially declining star formation than in instantaneous-burst, because in exponentially declining star formation stars are continuously forming.. When is fixed and the other parameters are changed, the smallest values of are obtained for . In addition, correlates well with . Using this correlation, we found 1000 Myr. Applying another constraint , corresponding to the 1 deviation, we find that 90 Myr and 200 Myr are allowed for the exponentially declining star formation models.
4 Dust emission and Energetics
4.1 Infrared luminosity
As shown in Figure 8, dust emission is prominent at the 24, 70, and 160µm bands. Because no data are available longward of 160µm we fit the Arp 220 template to these data points to estimate the bolometric infrared luminosity. The template is made based on Carico et al. (1990), Rigopoulou, Lawrence,& Rowan-Robinson (1996), and Klaas et al. (1997). In Figure 8, the upper dashed line represents the template which is fitted to the three data point at 24, 70 and 160 µm, while the lower dashed line shows the template fitted to the two data points at 70 and 160 µm. The former seems to overestimate the luminosity, while the latter could underestimate the luminosity. We adopt the average of these two values for the real luminosity. Then, the 8-1000µm bolometric luminosity is , classifying SST J1604+4304 as an ULIRG. Note that includes the correction for the flux magnification by cluster Cl 1604+4304, which is estimated to be 1.17.
4.2 Energetics
The stellar luminosity, which is inferred from the best instantaneous-burst model, is , accounting for only 1/2 of . If star formation activity dominates the bolometric output, the significant part of the starburst site is hidden by very opaque dust extinction which we cannot observe at UV to near-infrared wavelengths, implying the dust distribution in the foreground screen is clumpy. Otherwise, 1/2 of is fueled by AGN emission.
The X-ray 0.2-10 keV and radio 20cm data listed in Table 1 do not support the AGN emission in SST J1604+4304. However, it should be noticed that the X-ray and radio observations are not deep enough to rule out a significant contribution from the AGN to the bolometric luminosity . Mid-infrared data are widely used to search for obscured AGNs, because these wavelengths are much less affected by extinction and can penetrate through the dusty atmospheres surrounding the AGNs(Park et al., 2008). Using the versus AGN diagnostic, Ivison et al. (2004) and Pope et al. (2008a) showed that infrared galaxies having are starburst dominated in the mid-infrared. SST J1604+4304 having is thus starburst dominated. SST J1604+4304 has bluer mid-infrared colors than those of obscured AGNs and type1 QSOs studied by Polletta et al. (2008). Stern et al. (2005) showed a versus color-color diagram for identifying AGNs. SST J1604+4304 with and lies on the edge of the region which empirically separates AGNs from normal galaxies. Yan et al. (2007) performed mid-infrared spectroscopy of infrared luminous galaxies at with the sample selection criteria . SST J1604+4304 having does not meet the criteria of their sample. In conclusion, it is likely that mid- and far-infrared emission is starburst-dominated in SST J1604+4304, however we are unable to rule out the presence of AGN emission.
We compare the UV to far-infrared SED of SST J1604+4304 with those of three starburst-dominated galaxies, namely, M82(local starburst), Arp220(local ULIRG), and MIPS J142824.0+352619( HyLIRG) in Figure 9. MIPS J142824.0+352619 with lacks any trace of AGN activity and has large PAH features and rich molecular gasses, indicating starburst-dominated mid-infrared emission (Desai et al 2007;Borys et al. 2006;Iono at al. 2006). As seen in Figure 9, there is a striking similarity between SST J1604+4304 and MIPS J142824.0+352619 in the overall SEDs from the UV to far-infrared.
4.3 Dust mass
The dust mass is related to the flux density as in the rest frame, where is the distance to the source and is the absorption cross section per unit dust mass(e.g., Oyabu et al. 2009). When a modified blackbody spectrum is applied, and should be used together as a set, because depends on , but not on alone. To derive , we will use the dust model for the Milky Way in the far-infrared (Draine, 2003) in which or . Assuming , we obtain 32.5 K for the Arp 220 template and 35K for MIPS J142824.0+352619. This range of temperatures implies for SST 1604+4304, where the uncertainty is dominated by the error in the 160 µm flux.

| Quantity | Instantaneousa | E-decliningb |
|---|---|---|
| 0.83 | 0.79 | |
| 2.5 | 2.5 | |
| – | 90 | |
| 40 | 200 | |
| 28 | 14 | |
| 0.0 | 0.98 |
a Instantaneous-burst models where stars form all at once.
b Exponentially declining star-formation models with SFR , where is the time after the onset of the initial star formation and is the e-folding timescale.
c The Calzetti (2001) extinction law is used in a foreground dust screen.
d Metallicity of the stellar populations.
e -folding timescale for SFR.
f Time after the onset of the initial star formation.
g Luminosity to mass ratio in solar units, where is a stellar mass at = 0.

5 Discussion
For simplicity, we temporarily assume that SST J1604+4304 is purely powered by star formation and at the end we will discuss the impact if SST J1604+4304 is AGN-dominated.
5.1 Stellar mass
The stellar mass can be estimated as , where is the luminosity to mass ratio for the stellar population models. Thus, we have at as listed in Table 2. If this stellar mass was constantly built up during 40 - 200 Myr, the star formation rate is = 600 - 1650 M☉ yr-1. Using the calibrations of SFR in terms of the [OII] luminosity (Kennicutt 1998), after dereddening the [OII] flux, implies 13 - 500 yr-1. Considering that we are only looking at 1/2 of the starburst activity in the the optical, we obtain SFR = 26 - 1000 yr-1, in good agreement with the previous estimate.
5.2 Comparison with other infrared galaxy populations
SST J1604+4304 is a dusty, super metal-rich, young galaxy at with = 0.8, metallicity 2.5 , and an age 40 - 200 Myr. The age is comparable to young, optical-selected populations like Lyman- emitters (LAEs) and Lyman break galaxies (LBGs). Studying the LAE sample, Gawiser et al. (2006) inferred ages of the order of 100 Myr with stellar masses and no dust extinction. Pirzkal et al. (2007) showed LAEs had very young ages a few Mys with stellar masses . Sawicki & Yee et al. (1998), studying LBGs, found that their LBGs were dominated by young stellar populations with ages 200 Myr with stellar masses several and moderate dust extinction typically . The sample of LBGs by Papovich, Dickinson, & Ferguson (2001) has ages of 30 Myr to 1 Gyr with stellar masses with = 0.0 - 0.4. SST J1604+4304, having a stellar mass 6 - 13 , is more massive and more dusty than these optically selected galaxies.
SST J1604+4304 having meets the criteria for 24µm-selected high-redshift () dust-obscured galaxies (DOGs). DOGs and submillimeter-selected galaxies (SMGs) have extremely large which cannot be accounted for by redshifting local ULIRGs (Dey et al 2008;Pope et al. 2008b). Dey et al (2008) found nearly all of DOGs are ULIRGs with and more than half of these have . The infrared luminosity of radio-identified SMGs ranges (Chapman et al., 2005). A SFR 1000 , which corresponds to (Kennicutt, 1998), builds up a stellar mass of in 100 Myr. Thus, it is considered that DOGs and SMGs are progenitors of present-day massive galaxies. If ages of stellar populations in DOGs and SMGs are derived, as we did for SST J1604+4304 by measuring the stellar absorption lines, the evolutionary link of DOGs and SMGs to normal ULIRGs and optically selected galaxies will be better understood.
5.3 SNe for dust and metal production
In SST J1604+4304 with an age 40 - 200 Myr, most of the dust would be formed by type II supernovae (SNe II), because low-mass stars had not evolved to form dust in the expanding envelope. This may be the reason why our best model results in poor goodness of fit . The Calzetti’s extinction law may not be applicable to such young galaxies, because dust grains in local starbursts would be dominated by those formed in the outflows of low-mass stars and not by SNe II dust. In this regard, it is of great interest to use the SED of SST J1604+4304 to test extinction laws such as those calculated by Hirashita et al. (2005, 2008) that are predicted for dust formed in SNe II ejecta (Nozawa et al., 2003).
Our best model is the instantaneous-burst model with an age 40 Myr with a stellar mass at . The metallicity is 2.5 and the dust mass is . Until 40 Myrs after the onset of the starburst, stars with a mass died with a SN explosion. The number of stars evolved into SNe in 40 Myr is or 19 SNe per year. Adopting the nucleosynthesis models by Nomoto et al. (2006), the total yield is 0.09 - 0.11 and the metal yield is 0.016 - 0.020 for the Chabrier IMF.555The original yields are given for the Salpeter IMF. These are converted to the Chabrier IMF by simply multiplying 1.64 to adjust the difference in the mass fraction of stars from 8 - 100 to those from 0.1 -100 . The gas and stetllar metallicities can be estimated applying simply analytical models based on the instantaneous recycling approximation. The gas metallicity is expressed as = where is the ratio of the gas mass to the galaxy mass, and is the ratio of the rate at which the metal is produced by the events of nucleosysnthesis and ejected into the interstellar gas to the rate at which hydrogen is removed from the interstellar gas by star formation (Searle & Sargent, 1972). The stellar metallicity is derived from and , where is the total mass of stars born up to a time when the metal abundance reached to the value , and denote , respectively (Pagel & Patchett, 1975). In our case, is a time when the stellar metallicity reached to . When the gas mass is reduced to , we have and . The inferred galaxy mass is the stellar mass at , because the total mass ejected from stars at the events of SN explosions into the interstellar gas is 0.1 per unit stellar mass at . The total gas mass is . The gas-to-dust mass ratio is then , which is comparable to the value obtained in a HyLIRG () by Iono at al. (2006).
The dust production rate is per SN. This is consistent with the numerical results of dust formation in SNe; for progenitor masses ranging 13 - 30 , 2 - 5% of the progenitor mass is locked into dust grains at SN explosions (Nozawa et al., 2003), 20 - 100% of which is destroyed by processing through the collisions with the reverse shocks resulting from the interaction of SN ejecta and with the ambient medium (Nozawa et al., 2007).
5.4 Foreground dust screen
As demonstrated in Section 3.2, a foreground dust screen geometry is plausible for SST J1604+4304. This indicates that dust is depleted in the starburst site and the stellar spectra are reddened by the foreground dust screen which enclosed the starburst site. Let’s suppose a spherical shell with a radius for the dust distribution, then we observe in the rest-frame, where the thickness of the shell is which is 0.0074 at rest 80µm corresponding to = 0.83 with = 4.05 (Draine, 2003), is the distance from the observer to SST J1604+4304, and . Converting this relation into the observer’s frame, we obtain the radius = 4.5 - 5.5 kpc or 0.56 - 0.65″. This is comparable to the optical size of SST J1604+4304 which is approximately 1.2″ 0.5″in the band. This supports the view that the galaxy is surrounded by the shell. Further support is the fact that there are no significant color gradients across the galaxy in the images.
5.5 Evolutionary link to other galaxy populations
As discussed by Calzetti (2001), starburst environments are rather inhospitable to dust; dust grains in the starburst site can be transported to a large distance in a relatively short time by radiation pressure(Ferrara et al. 1991; Venkatesan et al. 2006), as well dust grains that formed at SN explosions are processed and evolve in SN remnants (Nozawa et al., 2007) - small size grains are quickly destroyed in SN remnants by sputtering. Thus, a cavity-shell structure is a natural geometry for the dust distribution in star-forming galaxies; the starburst site is inside the cavity where dust is depleted, and the opaque dust shell is surrounding the cavity. The shell is observed as a foreground screen. Such foreground screens were found in local starburst galaxies (Calzetti, Kinney, & Storchi-Bergmann 1994; Meurer et al. 1995). In the foreground screen of SST J1604+4304, the dust would be unevenly distributed; we are only looking at part of the starburst site at UV and optical wavelengths through relatively transparent holes with = 0.8, and the other part is completely obscured at these wavelengths. This explains that is two times greater than the stellar luminosity derived from the broad-band SED analysis.
Venkatesan et al. (2006) and Nozawa et al. (2007) suggest that dust created in the first SN explosions can be driven through the interior of the SN remnants and accumulated in the SN shells, where second-generation stars may form in compressed cooling gases. Hence, galaxies may be observed as dust-free objects at the very beginning. When much dust formed in SN ejecta, the starburst site would become completely obscured by dust at UV to near-infrared wavelengths. This stage would correspond to extremely dusty objects like DOGs and SMGs. Then, the galactic winds would turned on. Heckman, Armus, & Miley (1990) discussed that the galactic winds or superwinds frequently observed in starbursts and ULIRGs will sweep out any diffuse interstellar matter from the starburst site. Such galactic winds will turned on when the thermal energy of the gas heated by SN explosions exceeds the gravitationally binding energy of the gas. According to the models for chemical evolution of elliptical galaxies by Arimoto & Yoshii (1987), galactic winds turn on later in more massive galaxies. The onset of a galactic wind is 350 Myr for a galaxy, and the metallicity increases up to more than the solar value. These predictions seem to agree well with the age and the metallicity observed in SST J1604+4304, in which the galactic wind would just turn on and dust grains in the opaque shell are pushed and moved outward, creating partially transparent holes in the shell. This picture is consistent with the fact that dusty objects are deemed to be more abundant in massive galaxies than in less massive galaxies, although mid- and far-infrared observations are strongly biased to IR-luminous objects. This observational trend is expected, because galactic winds turn on later and thus the dust shell becomes more opaque for more massive galaxies, resulting in longer time of the dust-obscured stage. This may be the reason why DOGs and SMGs are so infrared-luminous and massive.
5.6 Impact by an obscured AGN
What would happen if the missing 1/2 of the bolometric luminosity comes from an AGN? In this case, the stellar mass ranging 0.1 - 8 is reduced to one half of that for the pure star formation. The number of SNe is also reduced by the same amount, while the dust mass does not change. Thus, the dust production rate is increased by a factor of 2, i.e., per SN. This is within a range consistent with the model predictions(Nozawa et al. 2003; Nozawa et al. 2007). The metallicity is the same as derived for pure star formation, because the SN ejecta mass is also reduced by a factor of 2. If the AGN shines at the Eddington rate, the mass of the AGN is .
Acknowledgments
We are grateful to Y. Tsuzuki for assisting the observation and to the anonymous referee for very useful comments. This work has been supported in part by Grants-in-Aid for Scientific research (17104002, 20340038) and Specially Promoted Research (20001003) from JPSP.
References
- Arimoto & Yoshii (1987) Arimoto, N. & Yoshii, Y. 1987. A&A, 173, 23.
- Armus et al. (1995) Armus, L., Neugebauer, G., Soifer, B.T., & Matthews, K. 1995, AJ, 110, 2610.
- Avni (1976) Avni, Y. 1976, ApJ, 210, 642.
- Borys et al. (2006) Borys, C., et al. 2006, ApJ, 636, 134.
- Bruzual (1983) Bruzual, G. 1983, ApJ, 273, 105.
- Bruzual & Charlot (2003) Bruzual, G. & Charlot, S. 2003, MNRAS, 344, 1000.
- Calzetti et al. (2000) Calzetti, D., Armus, L., Bohlin, R.C., Kinney, A.L., Koornneef, J., & Storchi-Bergmann, T. 2000, ApJ, 533, 682.
- Calzetti, Kinney, & Storchi-Bergmann (1994) Calzetti, D., Kinney, A.L., & Storchi-Bergmann, T. 1994, ApJ, 429, 582.
- Calzetti (2001) Calzetti, D. 2001, PASP, 113, 1449.
- Carico et al. (1990) Carico, D.P., Sanders, D.B., Soifer, B.T., Matthews, K., & Neugebauer, G. 1990, AJ, 100, 70.
- Chabrier (2003) Chabrier, G. 2003, PASP, 115, 763.
- Chapman et al. (2005) Chapman, S.C., Blain, A.W., Smail, I., & Ivison, R.J. 2005, ApJ, 622, 772.
- Chary & Elbaz (2001) Chary, R. & Elbaz, D. 2001, ApJ, 556, 562.
- Dale et al (2001) Dale, D.A., et al. 2007, ApJ, 655, 863.
- Desai et al (2007) Desai, V., et al. 2006, ApJ., 641, 133.
- Dey et al (2008) Dey, A., et al. 2008, ApJ, 677, 943.
- Draine (2003) Draine, B. T. 2003, ARA&A, 41, 241.
- Elbaz et al. (1999) Elbaz, D., et al. 1999, A&A, 351, L37.
- Fazio et al. (2004) Fazio, G. G., et al. 2004, ApJS, 154, 10.
- Ferrara et al. (1991) Ferrara, A., Ferrini, F., Barsella, B., & Franco, J. 1991, ApJ, 381, 137.
- Gal & Lubin (2004) Gal, R.R. & Lubin, L.M. 2004, ApJ, 607, L1.
- Gawiser et al. (2006) Gawiser, E. et al. 2006, ApJ, 642, L13.
- Genzel & Cesarsky (2000) Genzel, R. & Cesarsky, C.J. 2000, ARA&A, 38, 761.
- Heckman, Armus, & Miley (1990) Heckman, T.M., Armus, L., & Miley, G.K. 1990, ApJS, 74, 833.
- Héraudeau et al. (2004) Héraudeau, Ph., et al. 2004, MNRAS, 354, 924.
- Hirashita et al. (2005) Hirashita, H., Nozawa, T., Kozasa, T., Ishii, T.T., & Takeuchi, T.T. 2005, MNRAS, 357, 1077.
- Hirashita et al. (2005) Hirashita, H., Nozawa, T.,Takeuchi, T.T. & Kozasa, T. 2008, MNRAS, 384, 1725.
- Hughes, Gear, & Robson (1994) Hughes, D.H., Gear, W.K., & E.I. Robson, 1994, MNRAS, 270, 641.
- Iono at al. (2006) Iono, D., et al., 2006, PASJ, 58, 957.
- Ivison et al. (2004) Ivison, R.J., et al. 2004, ApJS, 154, 124.
- Kawara et al. (1998) Kawara, K., et al., 1998, A&A, 336, L9.
- Kawara et al. (2004) Kawara, K., et al., 2004, A&A, 413, 843.
- Kennicutt (1998) Kennicutt, R.C., 1998, ARA&A, 36, 189.
- Klaas et al. (1997) Klaas, U., Haas, M., Heinrichsen, I., & Schulz, B. 1997, A&A, 325, L21.
- Kobayashi et al. (1998) Kobayashi, Y., et al. 1998, Proc. SPIE, 3352, 120.
- Leeuw & Robson (2009) Leeuw, L.L. & Robson, E.I. 2009, AJ, 137, 517.
- Lubin, Mulchaey, & Postman (2004) Lubin, L.M., Mulchaey, J.S., & Postman, M. 2004, ApJ, 601, L9.
- Matsuoka et al. (2008) Matsuoka, Y., Peterson, B.A., Oyabu, S., Kawara, K., Asami, N., Sameshima, H., Ienaka, N., Nagayama, T., & Tamura, M. 2008 ApJ, 685, 767.
- Majewski et al. (1994) Majewski,S.R., Kron, R.G., Koo, D.C., & Bershady, M.A. 1994, PASP, 106, 1258.
- Margoniner et al. (2005) Margoniner, V.E., Lubin, L.M., Wittman, D.M., & Squires, G.K. 2005, AJ, 129, 20.
- Meurer et al. (1995) Meurer, G.R., et al. 1995, AJ, 110, 2665.
- Minezaki et al. (2004) Minezaki, T., Yoshii, Y., Kobayashi, Y., Enya, K., Suganuma, M., Tomita, H., Aoki, T., & Peterson, B. A. 2004, ApJ, 600, L35.
- Nomoto et al. (2006) Nomoto, K., Tominaga, N., Umeda, H., Kobayashi, C., & Maeda, K. 2006, Nuclear Physics A, 777, 424.
- Nozawa et al. (2003) Nozawa, T., Kozasa, T., Umeda, H., Maeda, K., & Nomoto, K. 2003, ApJ, 598, 785.
- Nozawa et al. (2007) Nozawa, T., Kozasa, T., Habe, A., Dwek, E.,Umeda, H., Tominaga, N., Maeda, K., & Nomoto, K. 2007, ApJ, 666, 955.
- Oliver et al. (1997) Oliver, S.J., et al. 1997, MNRAS, 289, 471.
- Oyabu et al. (2005) Oyabu, S. et al. 2005, AJ, 130, 2019.
- Oyabu et al. (2009) Oyabu, S., Kawara, K., Tsuzuki, Y., Matsuoka, Y., Sameshima, H., Asami, N., & Ohyama, Y. 2009, ApJ, 697, 452.
- Pagel & Patchett (1975) Pagel, B.E.J. & Patchett, B.E., 1975, MNRAS, 172, 13.
- Papovich, Dickinson, & Ferguson (2001) Papovich, C., Dickinson, M., & Ferguson, H. C. 2001 ApJ, 559, 620.
- Park et al. (2008) Park, S.Q., et al., 2008, ApJ, 678, 744.
- Pirzkal et al. (2007) Pirzkal, N., Malhotra, S., Rhoads, J.E., & Xu, C., 2007, ApJ, 667, 49.
- Polletta et al. (2008) Polletta, M., Weedman, D., Hönig, S., Lonsdale, C.J., Smith, H.E., & Houck, J. 2008, ApJ, 675, 960.
- Pope et al. (2008a) Pope, A., et al., 2008a, ApJ, 675, 1171.
- Pope et al. (2008b) Pope, A., et al. 2008b, ApJ, 689, 127.
- Puget et al. (1999) Puget, J.L., et al. 1999, A&A, 345, 29.
- Rabin (1982) Rabin, D. 1982, ApJ, 261, 85.
- Reddy et al. (2006) Reddy, N.A., et al. 2006, ApJ, 644, 792.
- Rigopoulou, Lawrence,& Rowan-Robinson (1996) Rigopoulou,D., Lawrence,A., & Rowan-Robinson, M. 1996, MNRAS, 278, 1049.
- Sanders & Mirabel (1996) Sanders, D.B. & Mirabel, I.F. 1996, ARA&A, 34, 749.
- Santos & Piatti (2009) Santos, J.F.C. & Piatti, A.E. 2004, A&A, 428, 79.
- Sato et al. (2003) Sato, Y., et a. 2003, A&A, 405, 833.
- Sawicki & Yee et al. (1998) Sawicki, M. & Yee, H.K. 1998, AJ, 115, 1339.
- Searle & Sargent (1972) Searle, L. & Sargent, W.L.W., 1972, ApJ, 173, 25.
- Serjeant et al. (2000) Serjeant, S. et al. 2000, MNRAS, 316, 768.
- Stern et al. (2005) Stern, D., et al. 2005, ApJ, 631, 163.
- Schneider,P., Ehlers,J., & Falco (1992) Schneider,P., Ehlers, J., & Falco, E.E. 1992, Gravitational Lenses, pp.243.
- Soifer et al. (1989) Soifer, B.T., Boehmer, L., Neugebauer, G., & Sanders, D.B. 1989, AJ, 98, 766.
- Soifer et al. (2008) Soifer, B.T., Helou, G. & Werner, M. 2008, ARA&A, 46, 201.
- Taniguchi et al. (1997) Taniguchi, Y., et al. 1997 A&A, 328, L9.
- Telfer et al. (2002) Telfer, R.C., Zheng, W., Kriss, G.A., & Davidsen, A.F. 2002, ApJ, 565, 773.
- Venkatesan et al. (2006) Venkatesan, A.,Nath, B.B., & Shull, J.M. 2006, ApJ, 640., 31.
- Weedman, Charmandaris, & Zezas (2004) Weedman,D., Charmandaris,V., & Zezas, A. 2004, ApJ, 600, 106.
- Werner et al. (2004) Werner, M. W., et al. 2004, ApJS, 154, 1.
- White et al. (1997) White, R.L., Becker, R.H., Helfand, D.J., & Gregg, M.D. 1997, ApJ, 475, 479.
- Willner et al. (1977) Willner, S.P., Soifer, B.T., Russell, R.W., Joyce, R.R., & Gillett, F.C. 1977, ApJ, 217, L121.
- Yagi et al. (2002) Yagi, M., Kashikawa, N., Sekiguchi, M., Doi, M., Yasuda, N., Shimasaku, K., & Okamura, S. 2002, AJ, 123, 66.
- Yan et al. (2007) Yan, L., et al. 2007, ApJ, 658, 778.
- Yoshii (2002) Yoshii, Y. 2002, New trends in Theoretical and Observational Cosmology, ed. by Sato, K. & Shiromizu, T., (Tokyo: Universal press), 235.