A C18O study of the origin of the power-law nature in the IMF
Abstract
We have performed C18O (=1–0) mapping observations of a area of the OMC-1 region in the Orion A cloud. We identified 65 C18O cores, which have mean radius, velocity width in FWHM, and LTE mass of 0.180.03 pc, 0.400.15 km s-1, and 7.24.5 , respectively. All the cores are most likely to be gravitationally bound by considering the uncertainty in the C18O abundance. We derived a C18O core mass function, which shows a power-law-like behavior above 5 . The best-fit power-law index of is consistent with those of the dense core mass functions and the stellar initial mass function (IMF) previously derived in the OMC-1 region. This agreement strongly suggests that the power-law form of the IMF has been already determined at the density of cm-3, traced by the C18O (=1–0) line. Consequently, we propose that the origin of the IMF should be searched in tenuous cloud structures with densities of less than 103 cm-3.
1 Introduction
One of the most important observational features of the stellar initial mass function (IMF) is its power-law-like nature above 1 , as . In the solar neighborhood, the power-law index seems to be greater than 2 (Salpeter, 1955; Kroupa, 2001), which characterizes the statistical properties of stars. In particular, both the total number and mass of stars are dominated by those of low-mass stars of 1 . It is natural to consider that the origin of the IMF shape is related to the mass distribution of its natal gas in molecular clouds. Many authors have investigated dense gas ( cm-3) in molecular clouds by using (sub)millimeter dust continuum emission and/or molecular line emissions having high critical densities such as the H13CO+(=1–0) and N2H+(=1–0) lines (e.g., Motte et al., 1998; Reid & Wilson, 2006; Nutter & Ward-Thompson, 2007; Ikeda et al., 2007; Walsh et al., 2007; Enoch et al., 2008). They identified numerous cores that have typical sizes of 0.05 – 0.1 pc and masses of 1 – 10 in nearby ( 500 pc) star forming regions such as Orion, Ophiuchus, Perseus, and Serpens. The molecular line studies showed that the cores are gravitationally bound and are likely to produce stars. Moreover, they found that the core mass functions (CMFs) derived by using the dense gas tracers, referred to as DCMFs hereafter, seem to have power-law-like behaviors in high-mass parts, whose values are very similar to that of the IMF. One exception is that Kramer et al. (1998) found a significatly smaller value of 1.7 for the S140 and M17SW regions by using the C18O(=2–1) line with a high critical density comparable to that of H13CO+(1–0). Considering that the power-law form of the IMF has been already determined at the formation stage of the cores with the densities of cm-3, it is likely that more tenuous structures of molecular clouds have a key to understanding the origin of the power-law nature of the IMF.
It has been suggested that the mass functions in the tenuous gas structures are different from the DCMFs. Kramer et al. (1998) carried out a systematic study of the mass functions in the tenuous gas structures of 103 cm-3 or less by using the 12CO(2–1), 13CO(1–0; 2–1), and C18O(1–0) lines in various molecular clouds. They showed that their mass functions seem to have a common power-law form, and the value of 1.70.1 is significantly smaller than those of the DCMFs and the IMF. Heithausen et al. (1998) derived 12CO(=1–0, 2–1) mass functions in the MCLD 123.524.9 and Polaris Flare regions and found that = . Wong et al. (2008) found = 1.7 in the C18O(=1–0) mass function of RCW 106. These facts mean that the power-law index of the IMF may be originated in the formation process of the dense gas of cm-3 from the tenuous gas of cm-3. However, one should be careful in comparing the value of the tenuous gas mass function to those of the DCMFs and the IMF. This is because the tenuous gas mass functions described above were derived by the spatial resolutions larger than 0.1 pc, which cannot resolve star-forming cores, and/or by using optically-thick tracers such as 12CO and 13CO. To fairly compare the tenuous gas mass function with the DCMFs and the IMFs, one should achieve higher spatial resolutions than 0.1 pc and use optically-thin tracers.
In this paper, we present a CMF derived by C18O(=1–0) mapping observations of the OMC-1 region, which is located at the center of the Orion A Giant Molecular Cloud. The aim of this study is to examine whether or not the common power-law form between the DCMFs and the IMF has been already determined in the tenuous gas of cm-3 by focusing on the power-law index in the high-mass part of the CMF. The C18O(=1–0) molecular line emission is suitable for deriving the CMF (e.g., Tachihara et al., 2002) because the line has a relatively small critical density of 103 cm-3 (Ungerechts et al., 1997) and is typically optically thin (see §3.2). The OMC-1 region is one of the best regions to investigate the CMF, because the IMF of the associated Orion Nebula Cluster (ONC) has been derived (Hillenbrand, 1997; Muench et al., 2002), and because the power-law form of the H13CO+ DCMF is shown to be quite similar to that of the ONC IMF by Ikeda et al. (2007). Furthermore, at the distance to the Orion A cloud of 480 pc (Genzel et al., 1981) we can easily resolve the cores with radii of 0.1 pc. As described in §2, the mapping observations have been done with the effective spatial resolution of 26′′.4 ( 0.06 pc), which is high enough to resolve the dense cores in the OMC-1 region (Ikeda et al., 2007).
2 Observations
The mapping observations were carried out in the period from January to February 2008 by using the Nobeyama 45 m radio telescope. The mapping covered a central area of the OMC-1 region. The position of the Orion-KL object (5h35m14s.2, -5∘22′22′′; J2000) was taken to be the center of the mapping region. Note that the region was selected to be the same as that in the H13CO+ DCMF study by Ikeda et al. (2007). Using the On-The-Fly method (Sawada et al., 2008), we swept the mapping region by raster scan with a scan speed of the telescope of 52 arcsec s-1. To reduce scanning effects, we scanned in both the RA and Dec directions. At the frequency of the C18O(=1–0) emission (109.782182 GHz; Ungerechts et al., 1997), the half power beam width, , and main beam efficiency, , of the telescope were 14′′ and 0.4, respectively. At the front end, we used the 25-BEam Array Receiver System (BEARS) in double-sideband mode, which has 55 beams separated by 41′′.1 in the plane of the sky (Sunada et al., 2000; Yamaguchi et al., 2000) . The 25 beams have beam-to-beam variations of about 10% in both beam efficiency and sideband ratio. To correct for the beam-to-beam gain variations, we calibrated the intensity scale of each beam using a 100 GHz SIS receiver (S100) with a single-sideband filter. At the back end, we used 25 sets of 1024 channel autocorrelators (ACs), which have a velocity resolution of 0.104 km s-1 at 110 GHz (Sorai et al., 2000). Since the data dumping time of the ACs was 0.1 s, the spatial data sampling interval on the sky plane was 5.2′′. The interval corresponds to 0.35, and satisfies the Nyquist theorem. The telescope pointing was checked every 1.5 hours by observing the SiO (=1, =1–0; 43.122 GHz) maser source Orion KL. The pointing accuracy was better than 3′′. To construct an -- data cube, we used a Gaussian function as a gridding convolution function (GCF) to integrate the spectra which were taken with a very high spatial sampling rate of 5.2′′. We adopted 22′′.5 as the size of the GCF in full width at half maximum. The resultant effective spatial resolution of the cube, , becomes 26′′.4. During the observations, the system noise temperature ranged from 295 to 429 K with a mean value of 351 K. Therefore, we have an RMS noise level of the data cube of 0.18 K in .
3 Results
3.1 C18O(=1–0) Total Map
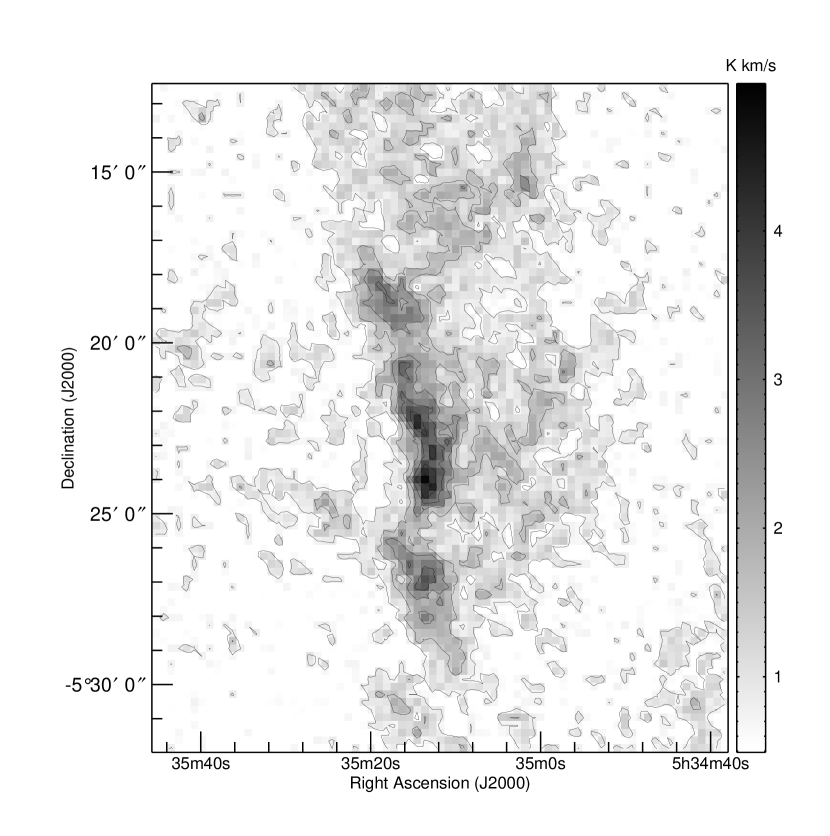
Figure 1 shows the total integrated intensity map of the C18O(=1–0) emission. The map shows that the OMC-1 region is elongated along the north-south direction. This elongated structure is a part of the Integral Shaped Filament (ISF; Bally et al., 1987), which is a global structure of the northern part of the Orion A cloud. Previously, Dutrey et al. (1991) obtained the C18O(=1–0) map of the ISF with a spatial resolution 6 times coarser than ours. Although the overall feature of our map is consistent with theirs, our map reveals a number of 0.1 pc-scale sub-structures owing to our higher spatial resolution. Such a clumpy structure is also seen in the H13CO+ map of the OMC-1 region (Ikeda et al., 2007), which traces the dense gas of cm-3, one order of magnitude higher than cm-3 traced by the C18O line.
One distinct difference between the C18O and H13CO+ maps is that the C18O map seems less clumpy than the H13CO+ one, though the overall features of the two maps are similar to each other. In the H13CO+ map, the ISF seems to mainly consist of the 0.1 pc-scale cores and the large-scale diffuse component seems minor. On the contrary, the diffuse component dominates the C18O map, and the clumpy structure seems less distinct than that in the H13CO+ map. In addition, the diffuse component of the C18O map appears to be more extended than that of the H13CO+ one. Actually, the total mass of the C18O emission above the 2 level is estimated to be 1500 (see §3.2 for the mass estimate) and is 1.5 times larger than that of the H13CO+ emission in the same region ( 1000 ; Ikeda et al., 2007). These facts support that the C18O emission traces more tenuous gas of the cloud than the H13CO+ emission.
3.2 Identification of C18O Cores and Estimation of the Core Properties
Following the H13CO+ DCMF study in the OMC-1 region (Ikeda et al., 2007), we applied the clumpfind algorithm (Williams et al., 1994) to the C18O three-dimensional (--) data. For the input parameter for the algorithm, in Williams et al. (1994), we adopted 0.36 K, i.e., the 2 noise level of the cube data. Since the algorithm treats the contour levels of with = 1, 2, 3, , the threshold level is equal to the lowest contour level of . Williams et al. (1994) showed that the 2 noise level is optimal for to extract clump and/or core structures from the cube data and to recover the physical properties of them, including the CMF. Recently, Pineda et al. (2009) examined more wider ranges of (from 3 to 20 ) than Williams et al. (1994) did and found that the mass functions of cloud sub structures specific to the adopted have power-law indices depending on , especially for higher ( 5 ), suggesting the hierarchical nature of a molecular cloud. In this study, however, we focus our attention on the cores, corresponding to the 0.1 pc-scale hierarchical level directly related to star formation. Therefore, we prefer to use the clumpfind algorithm with the optimal of the 2 noise level confirmed by Williams et al. (1994) (see also §4). Note that we adopted the grid spacing of the cube data of 26′′.4, equal to , i.e., full-beam sampling. This is because Williams et al. (1994) determined the optimal of the 2 level for the full-beam sampling case. We also followed the additional criteria introduced in Ikeda et al. (2007) to reject ambiguous or fake core candidates whose size and velocity width are smaller than the spatial and velocity resolutions, respectively. As a result, we identified 65 cores. The total number of the C18O cores is comparable to that of the H13CO+ cores of 57 in the same region.
We estimated the radius , velocity width in FWHM , LTE mass , virial mass , and mean density of the C18O cores. The definitions of these parameters are the same as those in Ikeda et al. (2007). In this study, and km s-1. In the mass estimate, we adopted and K (Cesaroni & Wilson, 1994). For the fractional abundance of C18O relative to H2, , we adopted (Frerking et al., 1982). In addition, we confirmed that the C18O(=1–0) emission is optically thin. We observed the 13CO(=1–0) emission (110.201 GHz) toward 25 positions in the OMC-1 region including the most intense C18O peak at the Orion-S object (5h35m13s, 24′30′′). We derived the optical depth of the C18O emission by considering the terrestrial abundance ratio of [13C16O]/[12C18O] of 5.5, and found that at all the 25 positions. Therefore, assuming the C18O emission is optically-thin all over the observed area, we have
| (1) |
where is the total integrated intensity of the core.
The mean values with standard deviation of , , and are 0.180.03 pc, 0.400.15 km s-1, and 7.24.5 , respectively. These are consistent with those of the H13CO+ cores of 0.150.04 pc, 0.580.23 km s-1, and 1516 . The mean value of of (4.81.6) cm-3 is comparable to the critical density of the C18O(=1–0) line and is one order of magnitude smaller than that of the H13CO+ cores of (3.31.8) cm-3. The total mass of the C18O cores is 468 , 30% of the total mass traced by the C18O emission (see §3.1). This fraction is a half of that for the H13CO+ case of 60 % (Ikeda et al., 2007, 2009), supporting that the C18O emission is dominated by the diffuse component, compared with the H13CO+ emission.
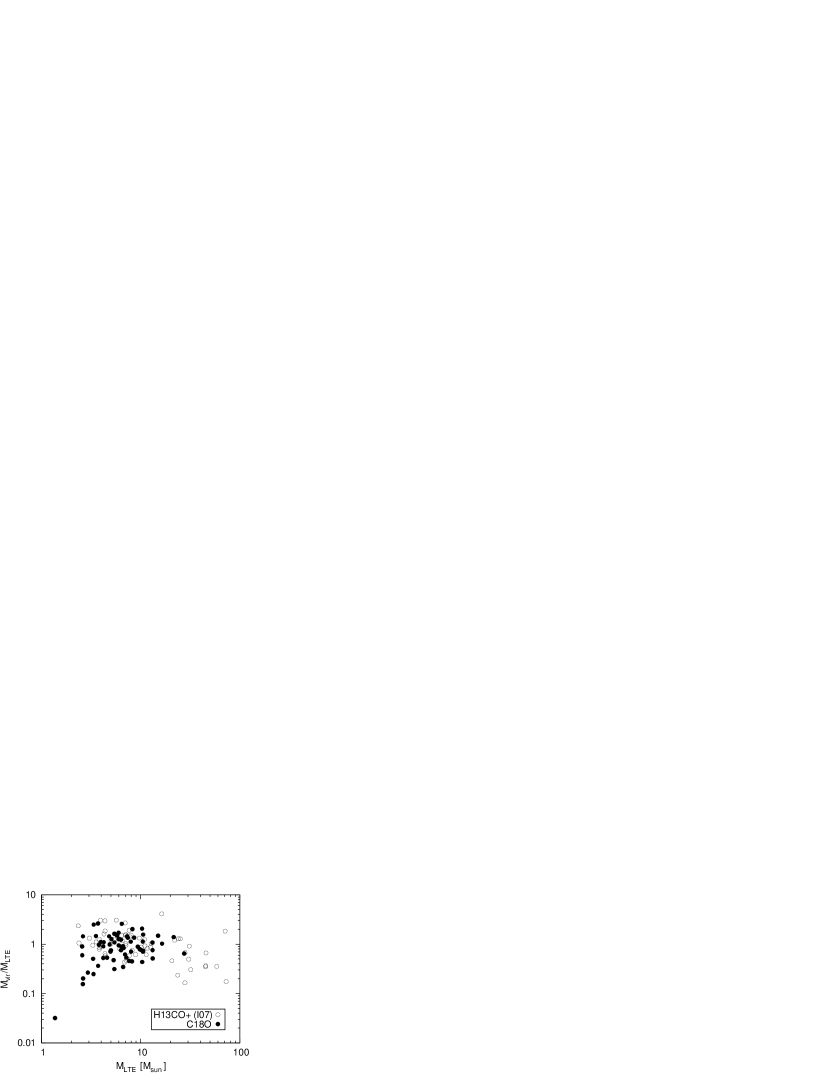
All the C18O cores are likely to be gravitationally bound and have the potential for forming stars as well as the H13CO+ cores. Figure 2 shows that the C18O cores, except for one core with the smallest mass of 1.3 , are distributed around the line of as well as the H13CO+ cores. The virial ratio, , has a mean value of 1.10.8 and the maximum value of 2.6. Even if we take the maximum value, the C18O cores can be under virial equilibrium by considering the uncertainty in of a factor 3. On the other hand, the minimum-mass core has the smallest virial ratio of 0.03, indicating certainly self-gravitating. Although the core is located around the map center of 5h35m13s, , the core is just on the border of the core identification (see §3.2 and Ikeda et al., 2007) and might have large uncertainties in its physical parameters. Even if the core would be an unresolved one, it never affects our discussion on the power-law nature in the high-mass part of the CMF, as in §4.
4 C18O CMF and Comparison with the DCMFs and the IMF
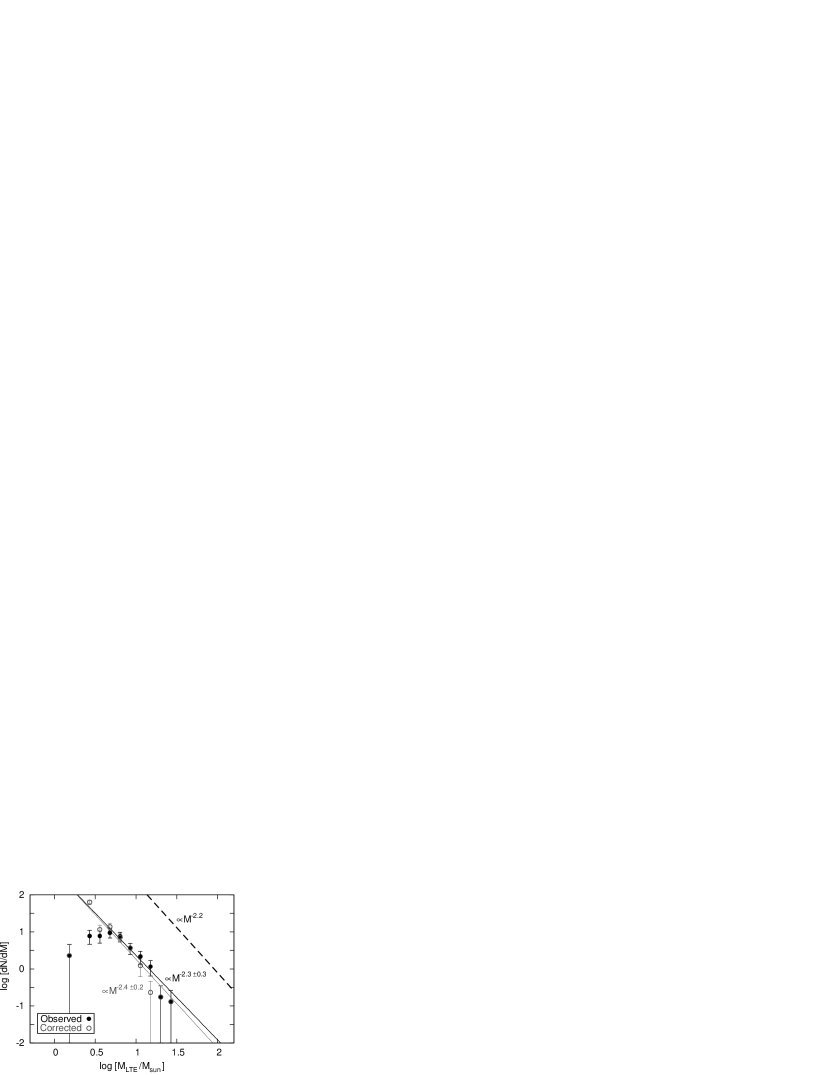
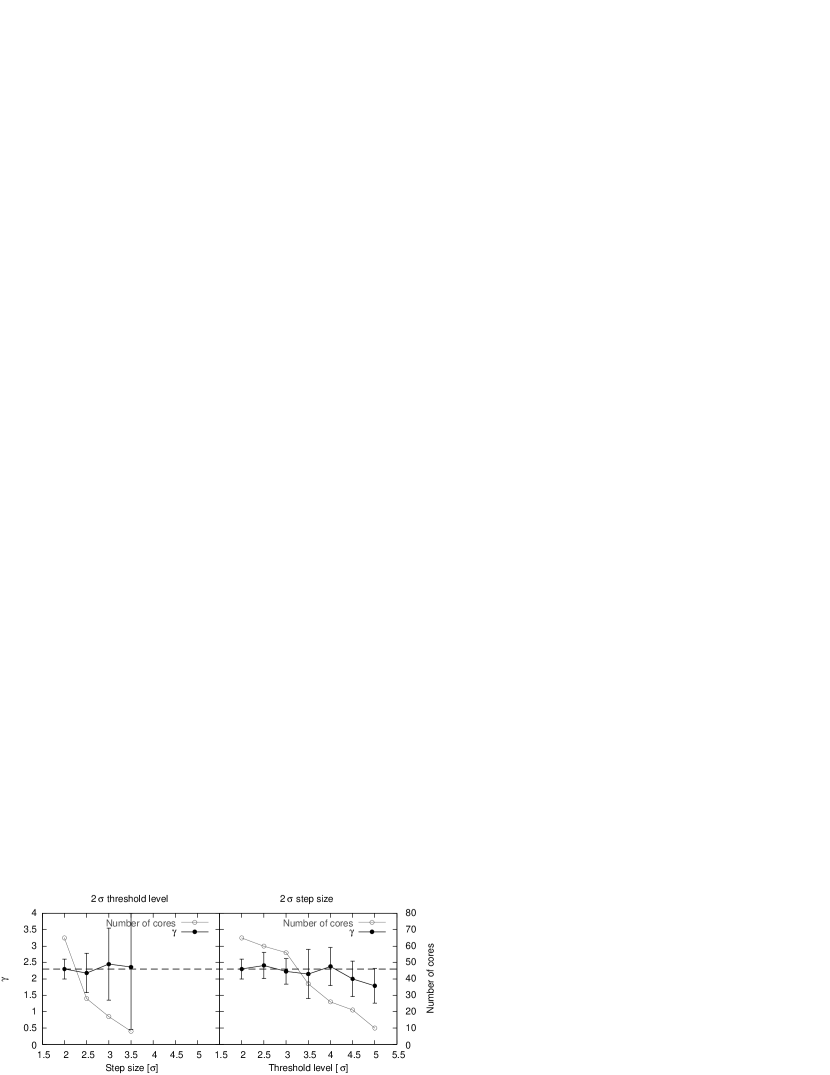
Figure 3 shows the C18O CMF. The CMF has a turnover at around 5 , and a power-law like shape in the high-mass part above the turnover. Above 5 , we applied a single power-law function by considering the statistical uncertainties and found that the best-fit power-law index is 2.30.3. Furthermore, we confirmed that the value is insensitive to the input parameter of the clumpfind, . We checked the algorithm by changing the step size (i.e., the contour interval) and the threshold level (i.e., the lowest contour level) independently, as shown in Figure 4. Note that the parameter ranges were limited so that the number of the identified cores could be large enough to construct the CMF. Figure 4 clearly shows that all the values are consistent with the best-fit value of 2.3 within the uncertainties.
Before the comparison with the DCMFs and the IMF, we correct the C18O CMF for the confusion effect using the model by Ikeda et al. (2009). The mass density of the low-mass cores of , , in the C18O cube data is a key parameter in the confusion model and is estimated to be 40.0 pc-2 km-1 s. The value is considerably smaller than that for the H13CO+ cores in the OMC-1 region of 99.0 pc-2 km-1 s (Ikeda et al., 2009). This difference probably corresponds to the fact that the C18O map is less clumpy than the H13CO+ one, as stated in §3.1. The total mass misidentified by the confusion effect is estimated to be 123 , and the confusion-corrected CMF is reconstructed by adding 45 misidentified cores to the low-mass part below 5 . Here we exclude the minimum-mass bin of 2 only for the minimum-mass core, because the detection of the minimum-mass core could be marginal as stated in §3.2 and because the statistical uncertainty of the mass bin is large compared to the other bins below the turnover. Note that the confusion effect does not considerably affect the shape of the high-mass part of the CMF, even if we include the minimum-mass bin in the correction. In other words, our discussion about the power-law index in the high-mass part of the CMF is not considerably changed by the confusion effect.
In Figure 3 we also show the confusion-corrected C18O CMF. Although the shape in the low-mass part of the corrected CMF is considerably changed, the value in the high-mass part is consistent with that in the observed CMF within the uncertainties; we applied a single power-law function to the corrected CMF and obtained the best-fit value of .
We have the value of the corrected C18O CMF of 2.40.2, which is quite consistent with those of the DCMFs. The value of the H13CO+ DCMF corrected for the confusion effect was measured to be (Ikeda et al., 2007). Nutter & Ward-Thompson (2007) derived the 850 m dust continuum DCMF in Orion and found that the best-fit is 2.20.2. Furthermore, our value agrees well with that of the IMF within the uncertainties. Muench et al. (2002) derived the IMF of the Trapezium cluster, which is the center portion of the ONC, from the -band luminosity function and found that = 2.2, as shown in Figure 3. The agreement between the C18O CMF and the IMF suggests that, at least in the OMC-1 region in the Orion A cloud, the power-law form of the IMF with has been already determined at the formation time of the tenuous structure with density of cm-3.
In future works, we propose observations using molecular lines having lower critical densities, such as 12CO(=1–0) and 13CO(=1–0), or thermal dust continuum emission. Telescopes in orbit with spatial resolution of such as the Akari (Murakami et al., 2007) and Herschel satellites would be preferable to seek the origin of the IMF in the tenuous structures of molecular/atomic interstellar clouds (e.g., Toth et al., 2000).
References
- Bally et al. (1987) Bally, J., Langer, W. D., Stark, A. A. & Wilson, R. W. 1987, ApJ, 312, L45
- Cesaroni & Wilson (1994) Cesaroni, R. & Wilson, T. L. 1994, A&A, 281, 209
- Dutrey et al. (1991) Dutrey, A., Langer, W. D., Bally, J., Duvert, G., Castets, A. & Wilson, R. W. 1991, A&A, 247, 9
- Enoch et al. (2008) Enoch, M. L., Evans, N. J. II, Sargent, A. I., Glenn, J., Rosolowsky, E. & Myers, P. 2008, ApJ, 684, 1240
- Frerking et al. (1982) Frerking, M. A., Langer, W. D. & Wilson, R. W. 1982, ApJ, 262, 590
- Genzel et al. (1981) Genzel, R., Reid, M. J., Moran, M. J. & Downes, D. 1981, ApJ, 244, 884
- Heithausen et al. (1998) Heithausen, A., Bensch, F., Stutzki, J., Falgarone, E. & Panis, J. F. 1998, A&A, 331, 65
- Hillenbrand (1997) Hillenbrand, L. A. 1997, AJ, 113, 173
- Ikeda et al. (2007) Ikeda, N, Sunada, K. & Kitamura, Y. 2007, ApJ, 665, 1194
- Ikeda et al. (2009) Ikeda, N, Kitamura, Y. & Sunada, K. 2009, ApJ, 691, 1560
- Kramer et al. (1998) Kramer, C., Stutzki, J., Röhrig, R & Corneliussen, U. 1998, A&A, 329, 249
- Kroupa (2001) Kroupa, P. 2001, MNRAS, 322, 231
- Motte et al. (1998) Motte, F., André, P. & Neri, R. 1998, A&A, 336, 150
- Muench et al. (2002) Muench, A. A., Lada, E. A. & Lada, C. J. 2002, ApJ, 573, 366
- Murakami et al. (2007) Murakami, H. et al. 2007, PASJ, 59, 369
- Nutter & Ward-Thompson (2007) Nutter, D. & Ward-Thompson, D. 2007, MNRAS, 374, 1413
- Pineda et al. (2009) Pineda, J. E., Rosolowsky, E. W. & Goodman, A. A. 2009, ApJ, 699, L134
- Reid & Wilson (2006) Reid, M. A. & Wilson, C. D. 2006, ApJ, 650, 970
- Salpeter (1955) Salpeter, E. E. 1955, ApJ, 121, 161
- Sawada et al. (2008) Sawada, T., Ikeda, N., Sunada, K., Kuno, N., Kamazaki, T., Morita, K-I, Kurono, Y., et al. 2008, PASJ, 60, 445
- Sorai et al. (2000) Sorai, K., Sunada, K., Iwasa, T., Tanaka, T., Natori, K. & Onuki, H. 2000, Proc. SPIE, 4015, 86
- Sunada et al. (2000) Sunada, K., Yamaguchi, C., Nakai, N., Sorai, K., Okumura, S. & Ukita, N. 2000, Proc. SPIE, 4015, 237
- Tachihara et al. (2002) Tachihara, K., Onishi, T., Mizuno, A. & Fukui, Y. 2002, A&A, 385, 909
- Toth et al. (2000) Toth, L. V. et al. 2000, A&A, 364, 769
- Ungerechts et al. (1997) Ungerechts, H., Bergin, E. A., Goldsmith, P. F., Irvine, W. M., Schloerb, F. P. & Snell, R. L. 1997, ApJ, 482, 245
- Walsh et al. (2007) Walsh, A. J., Myers, P. C., Di Francesco, J., Mohanty, S., Bourke, T. L., Gutermuth, R. & Wilner, D. 2007, ApJ, 655, 958
- Williams et al. (1994) Williams, J. P., de Geus, E. J. & Blitz, L. 1994, ApJ, 428, 693
- Wiseman & Ho (1998) Wiseman, J. J. & Ho, P. T. P. 1998, ApJ, 502, 676
- Wong et al. (2008) Wong, T. et al. 2008, MNRAS, 386, 1069
- Yamaguchi et al. (2000) Yamaguchi, C., Sunada, K., Iizuka, Y., Iwashita, H. & Noguchi, T. 2000, Proc. SPIE, 4015, 614