The Nature of Optically Dull Active Galactic Nuclei in COSMOS11affiliation: Based on observations with the NASA/ESA Hubble Space Telescope, obtained at the Space Telescope Science Institute, which is operated by AURA Inc, under NASA contract NAS 5-26555; the Magellan Telescope, which is operated by the Carnegie Observatories; and the Subaru Telescope, which is operated by the National Astronomical Observatory of Japan.
Abstract
We present infrared, optical, and X-ray data of 48 X-ray bright, optically dull AGNs in the COSMOS field. These objects exhibit the X-ray luminosity of an active galactic nucleus (AGN) but lack broad and narrow emission lines in their optical spectrum. We show that despite the lack of optical emission lines, most of these optically dull AGNs are not well-described by a typical passive red galaxy spectrum: instead they exhibit weak but significant blue emission like an unobscured AGN. Photometric observations over several years additionally show significant variability in the blue emission of four optically dull AGNs. The nature of the blue and infrared emission suggest that the optically inactive appearance of these AGNs cannot be caused by obscuration intrinsic to the AGNs. Instead, up to 70% of optically dull AGNs are diluted by their hosts, with bright or simply edge-on hosts lying preferentially within the spectroscopic aperture. The remaining 30% of optically dull AGNs have anomalously high ratios and are intrinsically weak, not obscured, in the optical. These optically dull AGNs are best described as a weakly accreting AGN with a truncated accretion disk from a radiatively inefficient accretion flow.
Subject headings:
galaxies: active — galaxies: nuclei — X-rays: galaxies — black hole physics — accretion, accretion disks1. Introduction
Deep X-ray surveys have indicated that most X-ray sources in the sky are AGNs with a wide range of luminosities, spectral energy distributions (SEDs), and redshifts (e.g. Brusa et al., 2007; Luo et al., 2008; Ueda et al., 2008). X-ray selection is widely regarded as the most efficient method for finding AGNs (Risaliti & Elvis, 2004; Brandt & Hasinger, 2005) and most of the X-ray background has been resolved into discrete AGN point sources (e.g. Alexander et al., 2003; Bauer et al., 2004; Ballantyne & Papovich, 2007). Most X-ray selected AGNs are quite similar to bright quasars from optical surveys, but many would not be easily selected as AGNs by their optical emission. The class of “optically dull” AGNs (also called “X-ray bright, optically normal galaxies,” or XBONGs, Comastri et al., 2002) are particularly puzzling because their X-ray emission is bright even while the optical signature of an AGN is completely absent. First pointed out by Elvis et al. (1981), optically dull AGNs lack both the broad emission lines of unobscured Type 1 AGNs and the narrow emission lines of moderately obscured Type 2 AGNs. They are also different from heavily obscured ( cm-2) “Compton-thick” AGNs, which lack both optical and X-ray emission and are frequently missed by X-ray surveys.
What causes an optically dull AGN to have the bright X-ray emission of an AGN while lacking all optical signatures of AGN accretion? The simplest possibility is that optically dull AGNs aren’t special at all, but are normal AGNs diluted by bright hosts. Moran, Filippenko & Chornock (2002) in particular suggest that local Seyfert galaxies would be classified as optically dull if they were observed with large apertures (as is the case at higher redshift, where the host galaxy is an unresolved source fully within the spectroscopic slit or fiber). However, 10-20% of local (undiluted) AGNs are optically dull (La Franca et al., 2002; Hornschemeier et al., 2005), so dilution may not be the cause of all optically dull AGNs.
Another possibility is that the optical emission of optically dull AGNs is absorbed. Narrow emission line (Type 2) AGNs have been long thought to be Type 1 AGNs with an obscured broad line region (e.g., Antonucci, 1993), and optically dull AGNs may similarly have the entire narrow line region obscured. Comastri et al. (2002) and Civano et al. (2007) suggest gas and dust with a large covering fraction a few parsecs from the nuclear source could provide the necessary absorption, blocking the ionizing radiation from exciting the narrow line region. Rigby et al. (2006) instead suggest that optically dull AGNs are obscured by extranuclear (100 pc) gas and dust in the host galaxy. No matter the source of the gas and dust, obscuring optically dull AGNs would require material which preferentially absorbs the optical emission, since at least half of optically dull AGNs are relatively unobscured ( cm-2) in the X-rays (Severgnini et al., 2003; Page et al., 2003).
Optically dull AGNs may instead be exotic AGNs with unusual emission or accretion properties. In particular, Yuan & Narayan (2004) suggest that optically dull AGNs may be radiatively inefficient accretors with truncated accretion disks. In this scenario, gas near the AGN does not form a cool disk, but instead is a very hot, radiatively inefficient, accretion flow (RIAF, also called an advection dominated accretion flow, or ADAF). This gas would then glow brightly in X-rays from inverse Compton emission while lacking the optical/UV blackbody emission from a typical AGN accretion disk. RIAFs have been shown to explain local low-luminosity AGNs (Quataert et al., 1999; Shields et al., 2000; Nagao et al., 2002; Hopkins et al., 2009).
We use a sample of 48 optically dull AGNs from the Cosmic Evolution Survey (COSMOS, Scoville et al., 2007)111The COSMOS website is http://cosmos.astro.caltech.edu/. to test these hypotheses. We describe the selection and multiwavelength observations in §2. In §3 we use a combination of photometry and spectroscopy to fit the optical emission of the optically dull AGNs, revealing that most of our targets show distinct contributions in the optical emission from a weak blue AGN and a dominant red passive galaxy. §3 also shows that at least four of the optically dull AGNs show significant variability. In §4 we summarize our findings and present the case that 70% of optically dull AGNs are normal AGNs diluted by their host galaxies, while the remaining 30% are instrinsically weak with radiatively inefficient accretion. We examine the accretion properties of weak AGNs in detail in §5, and summarize our results in §6.
2. Observations
2.1. X-ray Selection
We draw the sample of optically dull AGNs from the Cosmic Evolution Survey (COSMOS, Scoville et al., 2007), a survey over 2 deg2 of sky with deep multiwavelength observations. The XMM-Newton observations of COSMOS reach limiting fluxes of 1.7 erg cm-2 s-1 and 9.3 erg cm-2 s-1 in the 0.5-2 keV and 2-10 keV energy bands, respectively (Cappelluti et al., 2009). The optical and infrared counterparts to the X-ray sources is presented in Brusa et al. (2009), and all counterpart matches were visually inspected. Spectroscopic follow-up of X-ray targets with is described in Trump et al. (2009a). In particular, the 48 optically dull AGNs are the objects of Trump et al. (2009a) classified as “a” types (absorption line spectra) with 90% redshift confidence. All objects lack strong emission lines (see §2.2 below) in the optical spectra and satisfy one of the two X-ray AGN criteria:
| (1) |
| (2) |
In Equation 2, . These constraints are set by the limit on X-ray luminosity in local star forming galaxies of (e.g., Fabbiano, 1989; Colbert et al., 2004) and the traditional “X-ray AGN locus” of Maccacaro et al. (1988). These equations have been shown to be quite reliable in selecting AGNs, although they are probably overly conservative (e.g., Hornschemeier et al., 2001; Alexander et al., 2001; Bauer et al., 2004; Bundy et al., 2007). Of the 48 optically dull AGNs, 44 meet both criteria, with only 4 meeting one criterion but not the other. The optically dull AGNs are additionally restricted to , since beyond these redshifts the 4000Å break shifts beyond the observed spectral range of (Trump et al., 2009a) and it becomes extremely difficult to measure redshifts from absorption lines. The 48 optically dull AGNs are all of the AGNs within the 2 deg2 of COSMOS that meet either of the X-ray criteria and have Magellan/IMACS or SDSS spectroscopy.
2.2. Spectroscopy
Of the optically dull AGNs, 45/48 have optical spectra from observations with the Inamori Magellan Areal Camera and Spectrograph (IMACS, Bigelow et al., 1998) on the 6.5 m Magellan/Baade telescope. These spectra have wavelength ranges of 5600-9200Å, with a resolution element of 10Å (5 pixels). All targets were selected as AGN candidates by their X-ray emission. Details of the observations and reductions are presented by Trump et al. (2009a), and all of the spectra are publicly available on the COSMOS IRSA server (http://irsa.ipac.caltech.edu/data/COSMOS). The optically dull AGNs in this work all have high-confidence redshifts (), which empirically corresponds to a 90% likelihood of the correct redshift measurement (Trump et al., 2009a).
Three of the optically dull AGN spectra come from archival Sloan Digital Sky Survey (SDSS, York et al., 2000) observations. These sources were selected by their X-ray emission, but were excluded from the main Magellan/IMACS survey because their redshifts were already known. Their wavelength coverage is 3800-9200Å and their resolution element is 3Å (3 pixels).
Figure 1 shows the measured [Oii] (3727Å) and H (4861Å) narrow emission line luminosities for the optically dull AGNs (black squares), along with a comparison sample of Type 2 AGNs (blue diamonds) from Trump et al. (2009a). To compute the line luminosity, we first define a straight-line continuum by averaging the spectral regions 30-40Å redward and blueward of the line region. The line luminosity is then measured across the continuum-subtracted region 1000 km/s about the line center. The 1000 km/s width is a conservative limit since of Type 2 AGNs have narrow emission lines broader than 1000 km/s (Hao et al., 2005). The measured error for each line luminosity is computed using both the spectral error and the error of the continuum fit. When the line luminosity was less than its 5 error, we used the 5 error as an upper limit on line luminosity.
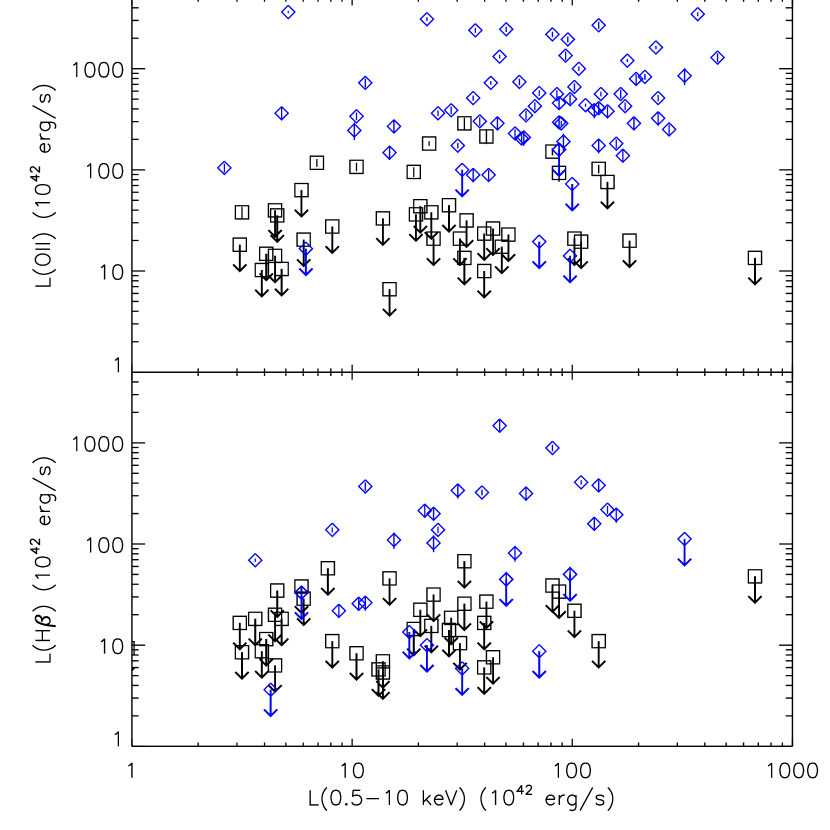
All 38 optically dull AGNs with H in the observed wavelength range have and thus are assigned only upper limits in the bottom panel of figure 1. However, 9/40 optically dull AGNs with [Oii] in the observed wavelength range have a line luminosity greater than the 5 threshold, despite the fact that the classification of Trump et al. (2009a) identified no emission lines. Still, even when detected, the emission line luminosities of the optically dull AGNs are much lower than those of typical Type 2 AGNs. If the optically dull AGNs were simply Type 2 AGNs observed at low signal-to-noise (S/N), we might expect poorly constrained upper limits on line luminosity. This is not the case, as the upper limits are 10-100 times lower than the line luminosities of typical Type 2 AGNs. Optically dull AGNs are not Type 2 AGNs with low S/N, but have much less luminous emission lines than Type 2 AGNs of similar X-ray luminosities.
2.3. Optical and Infrared Photometry
The optical and infrared photometry of the optically dull AGN is drawn from the catalog of Capak et al. (2009). Table 1 shows the depths, wavebands, and year of observation for the COSMOS photometry used here.
The optical photometry was taken on the Subaru telescope, with observations of the 6 broad, 12 intermediate, and 2 narrow bands described in Taniguchi et al. (2007) and Taniguchi et al. (2009). Fluxes were measured in diameter apertures, on PSF-matched images with FWHM of , and simulations (Capak et al., 2007) show that the diameter aperture contains 76% of the total flux for a point source. We additionally correct each optical magnitude by the zero-point correction from Ilbert et al. (2009).
The infrared photometry is derived from Spitzer/IRAC observations. The closest IRAC source within of the optical counterpart to the XMM source was chosen as the infrared counterpart. IRAC fluxes are given in the COSMOS-IRAC catalog for diameter apertures, so we translate these into diameter aperture fluxes as described in Salvato et al. (2009). All of our optically dull AGNs were unambiguously detected in all 4 IRAC bands.
| Filter | Telescope | Center | FWHM | Depth (0) | Epoch |
|---|---|---|---|---|---|
| Å | Å | magAB | UTC | ||
| BJ | Subaru | 4460 | 897 | 27.7 | 2004 |
| g+ | Subaru | 4750 | 1265 | 27.1 | 2005 |
| VJ | Subaru | 5484 | 946 | 27.0 | 2004 |
| r+ | Subaru | 6295 | 1382 | 27.1 | 2004 |
| i+ | Subaru | 7640 | 1497 | 26.7 | 2004 |
| z+ | Subaru | 9037 | 856 | 25.7 | 2004 |
| IA427 | Subaru | 4271 | 210 | 26.5 | 2006 |
| IA464 | Subaru | 4636 | 227 | 26.0 | 2006 |
| IA484 | Subaru | 4842 | 227 | 26.5 | 2007 |
| IA505 | Subaru | 5063 | 232 | 26.2 | 2006 |
| IA527 | Subaru | 5272 | 242 | 26.5 | 2007 |
| IA574 | Subaru | 5743 | 271 | 26.2 | 2007 |
| IA624 | Subaru | 6226 | 299 | 26.3 | 2006 |
| IA679 | Subaru | 6788 | 336 | 26.1 | 2006 |
| IA709 | Subaru | 7082 | 318 | 26.3 | 2007 |
| IA738 | Subaru | 7373 | 322 | 26.1 | 2007 |
| IA767 | Subaru | 7690 | 364 | 25.9 | 2007 |
| IA827 | Subaru | 8275 | 364 | 25.8 | 2006 |
| NB711 | Subaru | 7126 | 73 | 25.4 | 2006 |
| NB816 | Subaru | 8150 | 119 | 26.1 | 2005 |
| IRAC1 | Spitzer | 35263 | 7412 | 23.9 | 2006 |
| IRAC2 | Spitzer | 44607 | 10113 | 23.3 | 2006 |
| IRAC3 | Spitzer | 56764 | 13499 | 21.3 | 2006 |
| IRAC4 | Spitzer | 77030 | 28397 | 21.0 | 2006 |
2.4. Host Morphologies
We discuss morphological data of the optically dull AGN host galaxies from observations with the Advanced Camera for Surveys (ACS) on the Hubble Space Telescope (HST), fully described in Koekemoer et al. (2007). The COSMOS field was imaged in the F814W filter for 583 orbits, reaching a limiting magnitude of AB(F814W) (). Because the HST/ACS imaging only covers 1.64 deg2 of the 2 deg2 COSMOS field, 3/48 optically dull AGNs lack HST/ACS coverage. Gabor et al. (2009) provides morphological data for 37 of the remaining optically dull AGNs, from the point source subtracted host galaxies. (The other 8 optically dull AGNs have HST/ACS imaging, but do not have morphological data because the resultant fit was wildly unphysical or did not converge.)
2.5. Completeness
All of the optically dull AGNs are detected in the Subaru and IRAC photometry, and all within the HST areal coverage were detected in ACS, so these do not affect the completeness limits. The soft 0.5-2 keV X-ray limit of 1 erg cm-2 s-1 means the X-ray AGN sample is complete to all AGNs meeting the luminosity criterion (Equation 1) of at (see Figure 9 of Trump et al., 2009a). Correct identification of optically dull AGNs is also limited to , since at higher redshifts the break in these objects is redshifted beyond the observed wavlength range, and high-confidence identification becomes difficult. The Magellan/IMACS spectroscopy is uniformly 90% complete to absorption line objects. The optically dull AGN sample is then limited by and , but is 90% complete to only .
3. Multiwavelength Properties
Table 2 presents the multiwavelength properties of all 48 optically dull AGNs. For each object, we show:
-
1.
The object name, with coordinates given in J2000 hhmmss.ss+ddmmss.s. “COSMOS” or “SDSS” indicates if the spectroscopy is from Magellan/IMACS or the SDSS archives, respectively.
-
2.
The redshift, from Trump et al. (2009a).
-
3.
The signal to noise per pixel, averaged over the spectrum in the central wavelength range 6600-8200Å. (The resolution element is 5 pixels for Magellan/IMACS spectra, and 3 pixels for SDSS spectra.)
-
4.
The -band AB magnitude, from Subaru/Suprime-Cam observations.
-
5.
The logarithm of the X-ray luminosity measured in the 0.5-10 keV energy range, in cgs units.
-
6.
The ratio between X-ray and optical flux, , defined in equation 2.
-
7.
The fractional contribution of AGN in the best-fit template (see §3.1). This can be regarded as a rough estimate of the blue AGN contribution to the optical emission.
-
8.
The ratio between X-ray and optical flux, , but where the optical flux includes only the blue AGN contribution (from the template fit in §3.1).
-
9.
The hardness ratio, . Here is the flux in the soft 0.5-2 keV band and is the flux in the hard 2-10 keV band. AGNs undetected in the soft band have , and those undetected in the hard band have .
-
10.
The axis ratio , measured using GALFIT after subtracting a point source from the host galaxy (see §3.5).
3.1. Optical Fitting: Host and AGN Components
Each optically dull AGN spectrum lacks strong emission lines and has the red shape and absorption signature (H+K lines, 4000Å break, etc.) of an old, red elliptical galaxy. However, the spectra often have low S/N, and most (45/48) are limited by the 5600-9200Å wavelength range of Magellan/IMACS. The 20 bands of high-S/N optical photometry allow us to take a broader look at the optical SED.
We fit the optical photometry of each optically dull AGN with an “r+q” template that is a mix of a red galaxy component (the SDSS red galaxy composite from Eisenstein et al., 2001) and a blue AGN component (the SDSS quasar composite from Vanden Berk et al., 2001). The scale of each component is an independent free parameter. The two components of the hybrid “r+q” template are well-motivated for two reasons: (a) from the X-ray properties the objects must have an AGN, and (b) the optical spectrum most closely resembles a red galaxy. While both the host and any underlying AGN will not be perfectly described by the “r” and “q” components of the template, we explore the minor systematic deviations below.
We find the red galaxy and AGN components in the best-fitting template by maximizing the Bayesian probability function, . Here is the observed magnitude, is its error, and is the template magnitude computed by measuring the template flux through the same wavelength response function as the observed magnitude. (The parameter is the logarithm of this probability function, but we choose the Bayesian approach because it maps out the probability distribution, not just the best-fit values.) In the fits for all objects the best-fit fractions of AGN and red galaxy are tightly constrained: the 99% confidence intervals for the fit contain deviations of .
Systematic errors will dominate over the fitting errors, however, because the “r+q” template is not likely to be a perfect fit to the observed data. First, the optically dull AGNs may have active or recent star formation contributing to the blue emission, causing us to overestimate the AGN emission. The contribution from a young stellar population (O/B-star) is likely to be minor, since the emission line luminosities for the optically dull AGNs are very low (see §2.2). A moderate age (A-star) stellar population would not have strong emission lines, but must also be a minor contributor at best because none of the optically dull AGN spectra show a Balmer break. We estimate the effect of any blue star-forming component as , since any higher contribution would lead to emission lines or a recognizable Balmer break for even the lowest S/N optically dull AGNs. In addition, the AGN template of Vanden Berk et al. (2001) may not well describe the optical shape of the true underlying AGN, since AGNs can be heavily reddened (Hopkins et al., 2004) or obscured (Elitzur, 2008), and even unobscured quasars are known to exhibit a wide variety of optical spectral shapes (Richards et al., 2006). Still, Vanden Berk et al. (2001) notes that the Type 1 AGNs have a variation of only from the mean SED in their blue (Å) continua. So we can assume that our AGN fractions are valid, with the caveat that the true optical AGN emission may differ by up to 20%. While the “r+q” template may not recover the true optical AGN fraction of the optically dull AGNs, our estimated AGN fraction is useful as rough estimate for studying the host-subracted fraction.
We show examples of our template fits in Figure 2. In each panel the black points show the photometry, with the x error bar showing the band width and the y error showing the photometric error. The black histogram is the observed spectrum from Magellan/IMACS or the SDSS, and the blue histogram is the best-fit “r+q” template. Figure 2 additionally includes a best-fit red-galaxy-only (“r”) template, shown in red, to illustrate the improvement of including a blue AGN component in the template fit. Reduced chi-square values, and the blue AGN contribution of the “r+q” template fit, are shown in the upper left of each panel. Note that the values are quite large because the optical photometry has very small errors and the 14 narrow and intermediate bands are sensitive to details which are not well-described by our templates. But while the fits do not perfectly describe the details of the optically dull AGN SEDs, the templates are useful for studying the shape of the SEDs and providing a rough estimate of the relative blue AGN and red host components.
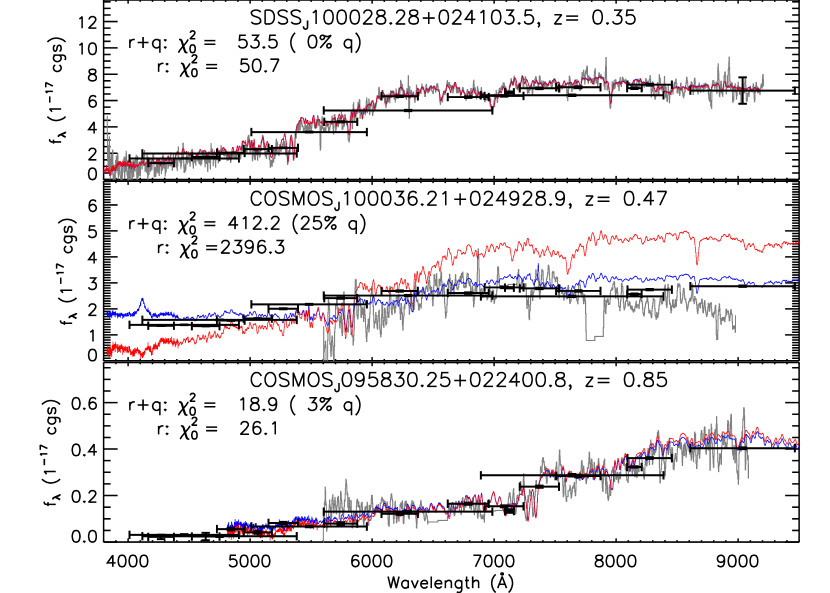
The top panel represents optically dull AGNs with virtually no quasar contribution in the optical photometry, where the highest probability “r+q” template had zero quasar fraction. Five of the 48 optically dull AGNs had similar fits, with virtually no blue AGN emission. The upper limit on any blue quasar excess in these objects is typically only 2% blue AGN component.
The second panel of Figure 2 shows an example of an optically dull AGN with a significant quasar component in the fit. In this example the best-fit “r+q” template is significantly better than the best-fit “r” template, with a much lower reduced chi-square. The majority of the optically dull AGNs, 28/48 objects, exhibited similar fits, with . The blue AGN contribution in these objects is typically 15-35%.
The third panel represents optically dull AGNs where the best-fit “r+q” template is only a slight improvement over the plain “r” red galaxy template. These AGNs have only a very weak excess of blue emission, completely invisible in the observed spectrum and only barely detected in the optical photometry. Of the 48 optically dull AGNs, 15 exhibit similar fits, with blue AGN contribution of about 3-7%.
We can additionally compare the predicted line fluxes of the quasar component in the best-fit template to the line flux limits in the optical spectrum. The H and [Oii] narrow emission lines (shown in Figure 1) do not work well for this comparison because we use a quasar template in our fit, and these narrow lines are often weak or nonexistent in Type 1 AGN. However the [Oiii] (5007Å) narrow emission line is typically strong in both Type 1 and Type 2 AGN and so is useful for the comparison. Only 30 optically dull AGNs have [Oiii] in their observed wavelength range, and all of these are upper limits only. Most (19/30) of these AGNs have predicted [Oiii] fluxes from the best-fit model which lie below the upper limit on [Oiii] flux from the spectrum. Since these AGNs have low predicted line fluxes and the measured [Oiii] fluxes are only limits, it is not a strong constraint, but it does suggest that these 19 optically dull AGNs could be diluted Type 1 or Type 2 AGNs.
The optical photometry also reveals significant variability in four optically dull AGNs. When comparing the observations from 2004, 2006, and 2007 (see Table 1), these four AGNs exhibited changes in flux 5 beyond the photometry errors. We show an example of a variable optically dull AGN in Figure 3. Magnitudes from each of 2004, 2006, and 2007 are shown in each panel in blue, with the corresponding template fit shown in red in each panel. The template fit to all 20 bands of optical photometry (from all years) is shown in gray, along with the Magellan/IMACS spectrum in black, for comparison in each panel. The optically dull AGN decreases in flux from 2004 to 2007, but almost all of this change is in the blue emission. In the template fit, the red galaxy component remains nearly the same in each year while the AGN component decreases from 43% to 15% contribution.
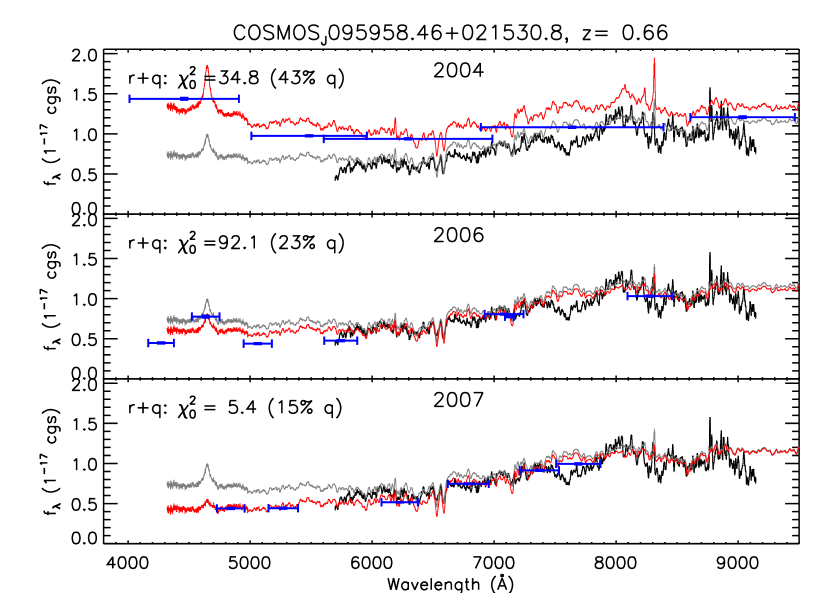
Old red galaxies do not change in flux over different years of observations. Type 1 AGNs, however, can vary by as much as factors of a few on year timescales (e.g. Morokuma et al., 2008; Kelly et al., 2009). The four variable optically dull AGNs must then have a weak AGN causing the variability. The source of the variability must be 1 light-year in size, making obscuration or reddening extremely unlikely. The variable optically dull AGNs are instead likely to be diluted “normal” AGNs. Indeed, close inspection of Figure 3 shows that the optical spectrum may have a weak H broad emission line, although it is difficult to positively identify the line because of low S/N in that part of the spectrum. (§2.2, however, showed that for this and other optically dull AGNs, the narrow [Oii] and H lines are not hidden by low S/N, but are instead very weak compared to those of Type 2 AGNs.) So while optically dull AGNs do not have strong emission lines, the four variable objects in particular show evidence for a diluted (not obscured) AGN. These objects are likely to be normal, unobscured Type 1 AGNs diluted by extranuclear light (as we explore in §3.5).
3.2. X-ray to Optical Ratio
The defining characteristic of optically dull AGNs is that they are bright in X-rays while their optical spectra have no sign of emission lines. But while optically dull AGNs lack the emission line signature of an AGN, §3.1 showed that they do have excess blue emission which might be attributed to a diluted AGN. But are optically dull AGNs simply diluted by a bright host, or is their optical emission actually depressed when compared to their bright X-rays?
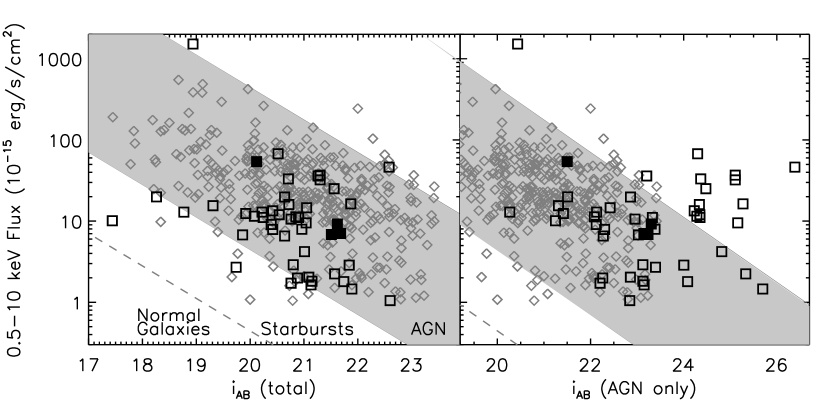
We present the ratio between the X-ray and optical flux in Figure 4, where . The optically dull AGNs are shown as squares, and the four variable objects are indicated by filled squares. For comparison the Type 1 (broad line) and Type 2 (narrow line) X-ray AGNs of Trump et al. (2009a) are shown in gray. At left, we use the total for the optically dull AGNs, and all but 2 of the optically dull AGNs have values consistent with typical AGNs. At right, the magnitude includes only the AGN fraction as determined in §3.1. It is important to note that X-ray K-corrections will cause Compton-thick AGNs at higher redshifts to have higher ratios, (e.g., Comastri et al., 2003), although this effect should be minimal in our sample because very few of the optically dull AGNs are Compton-thick (see §3.4) and all have .
Even after subtracting out the host component, 33/48 optically dull AGNs have values consistent with typical AGNs. These optically dull AGNs might be normal AGNs diluted by their hosts. However, we note that host dilution should push objects to the left in Figure 4, so host dilution may be unlikely for AGNs with and 33/48 may be an upper limit on the true fraction of optically dull AGNs diluted by their hosts. The 15 AGNs with present the most interesting case, since host dilution is impossible and some physical effect must depress their optical emission while they remain X-ray bright.
3.3. Infrared Color: Dust Properties
Bright AGNs are well-known to have redder Spitzer/IRAC colors than normal galaxies (Lacy et al., 2004; Stern et al., 2005) as a result of strong mid-IR power-law continua (Sajina et al., 2005; Donley et al., 2007). The IRAC emission is generally associated with the hot, dusty “torus” or outer accretion disk of AGNs. Since optically dull AGNs are optically fainter than normal AGNs, they might also have different mid-IR properties, with the power-law continuum either diluted or absent.
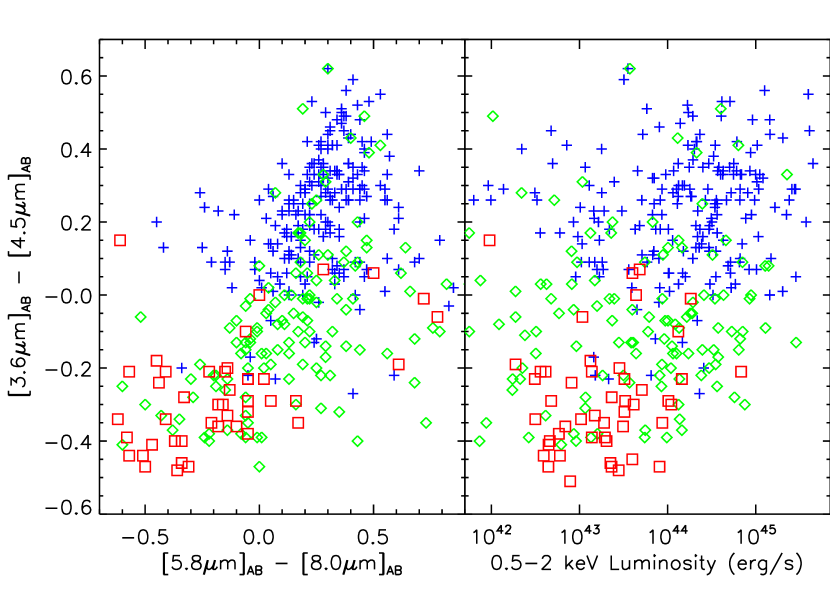
The IRAC colors are shown in Figure 5. The optically dull AGNs are marked with red squares, while Type 1 and Type 2 AGNs from Trump et al. (2009a) are shown as blue crosses and green diamonds, respectively. Type 1 AGNs generally have the reddest IRAC colors, followed by Type 2 AGNs, while most optically dull AGNs have IRAC colors consistent with normal galaxies. The color does a particularly good job of separating the various AGN types. We additionally show the color with soft X-ray luminosity in the right panel of Figure 5. Donley et al. (2007) suggested that the mid-IR power-law continuum disappears at low X-ray luminosities, but this does not appear to be the case for our optically dull AGNs. While many Type 1 AGNs are more X-ray luminous than the optically dull AGNs, many have similar luminosities, and there is no apparent correlation between IRAC color and X-ray luminosity in Figure 5. The optically dull AGNs have IRAC colors consistent with normal galaxies even though they are as X-ray luminous as some Type 1 AGNs.
3.4. X-ray Column Density
Several authors have suggested that the optical emission of optically dull AGNs is obscured, either by material near the central engine (Comastri et al., 2002; Civano et al., 2007) or by gas and dust in the host galaxy (Rigby et al., 2006). But if the optical emission is obscured, then the X-ray emission would probably be obscured as well (so long as the obscuring material for X-ray and optical emission is cospatial). For the 28 optically dull AGNs with 50 full band counts in their XMM or Chandra (Elvis et al., 2009; Lanzuisi et al., in prep.) observations, we estimate from X-ray spectral analysis. We fit each X-ray spectrum as an intrinsically absorbed power-law with Galactic absorption ( cm2 in the direction of the COSMOS field), with the power-law slope and as free parameters. The best-fit value and its 2 error are found using the Cash (1979) statistic. For the remaining 20 optically dull AGNs, we estimate a less accurate from their hardness ratio, , following the relation between and from Mainieri et al. (2007). Here is the counts in the hard 2-4.5 keV XMM band and is the counts in the soft 0.5-2 keV XMM band.
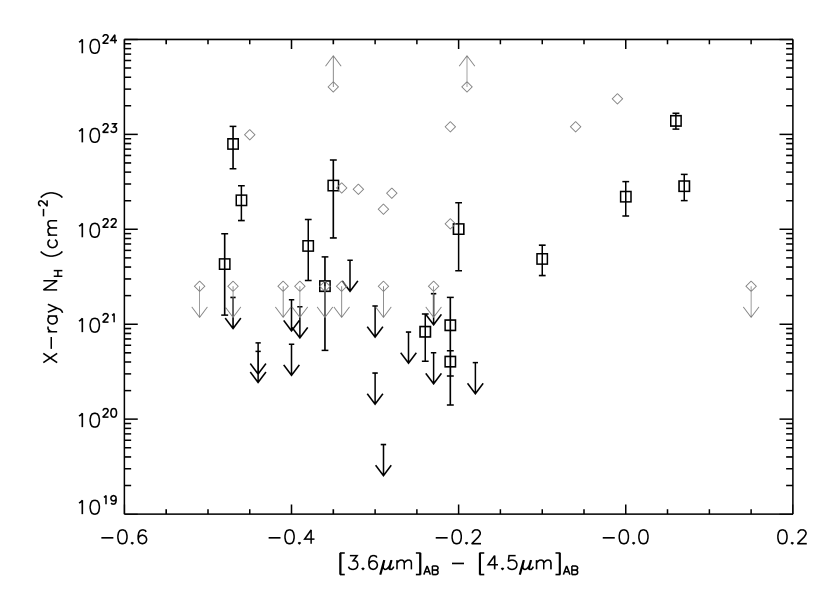
Figure 6 shows the column density with the color. Black squares and upper limits show those optically dull AGNs with over 50 counts in their XMM or Chandra observation, while gray diamonds show those objects with estimates from the hardnress ratio only. Most (31) optically dull are relatively unobscured in their X-rays, with cm-2, and at most only 2-3 are Compton-thick ( cm-2). The X-ray column densities are similar to those of Type 1 and Type 2 AGNs in COSMOS (Mainieri et al., 2007), so there is no X-ray evidence for additional obscuration in optically dull AGNs.
3.5. Host Galaxy Properties
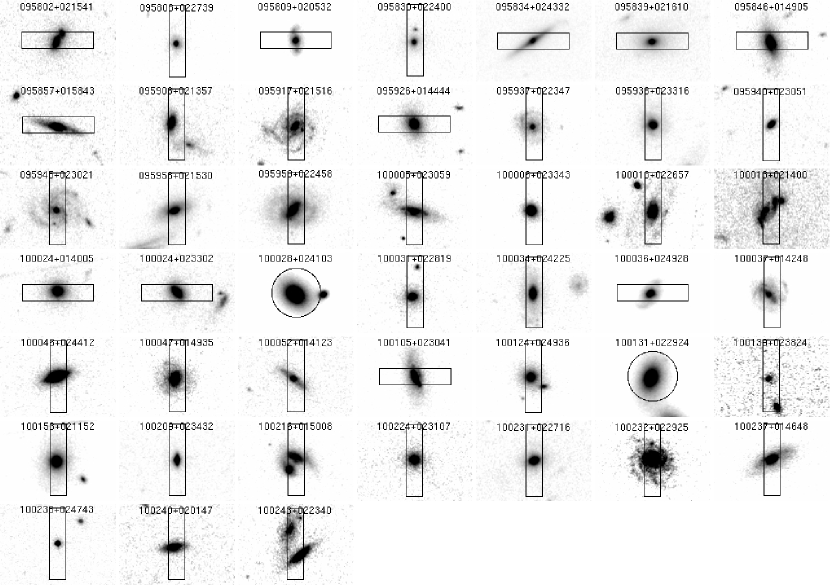
The HST/ACS imaging in COSMOS allows for detailed studies of the host galaxies of the optically dull AGNs. We show postage stamps of the 46 objects with HST/ACS coverage in Figure 7. Immediately it is evident that the optically dull AGNs reside in a wide variety of hosts (in contrast with Rigby et al., 2006), despite the fact that they have spectra consistent with old, red elliptical galaxies. A few hosts appear as isolated spheroids or ellipticals, while others have clumpy and dusty disks, and some are disturbed. Type 1 and Type 2 AGNs have similarly been shown to exist in a wide range of host galaxy morphologies (Jahnke et al., 2004; Sánchez et al., 2004; Gabor et al., 2009). Marking the spectroscopic aperture ( IMACS slit or -diameter SDSS fiber) over each of the images, however, reveals a common thread: several of the optically dull AGNs appear to be have significant extranuclear light within the aperture. Both of the optically dull AGNs with SDSS spectroscopy in Figure 7 have bright elliptical hosts filling the fiber aperture. At least 8 objects with IMACS spectroscopy have a nearby companion falling in the slit, while the hosts of at least 8 others appear to have a bar or disk oriented along the slit. In all of these cases, the AGN optical emission is likely to be diluted by the continua of one or more normal galaxies. This scenario can explain the optically dull AGNs with normal ratios, since the extranuclear host galaxy light would increase the total optical brightness.
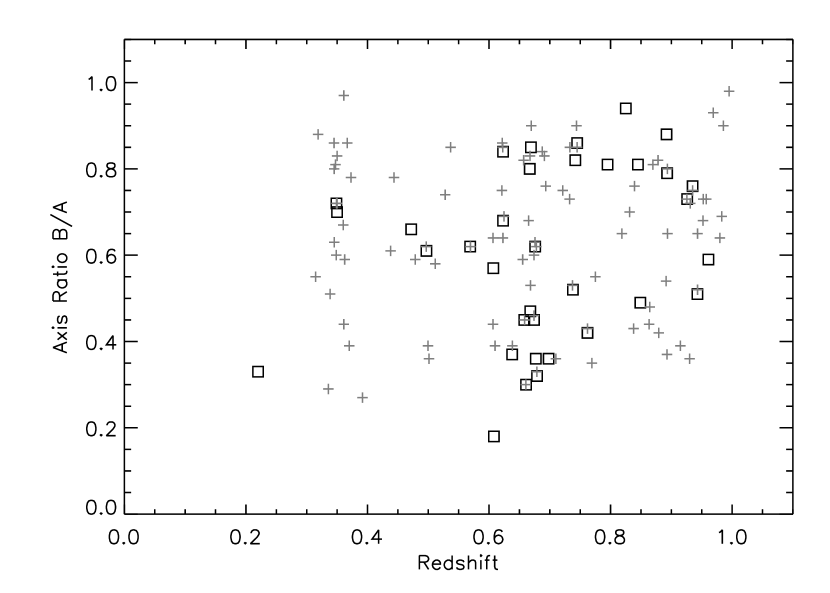
Rigby et al. (2006) used HST/ACS images in the Chandra Deep Field South (CDF-S) to show that optically dull AGNs have preferentially edge-on hosts compared to other AGNs, further suggesting that optically dull AGNs are optically obscured by extranuclear dust in their host galaxies. To test this hypothesis, we present axis ratios with redshift for 37 optically dull AGNs in Figure 8, along with a sample of 93 Type 2 AGN from Gabor et al. (2009) in gray. No Type 1 AGN are shown because the point sources are too bright for accurate host galaxy decompositions: in Gabor et al. (2009), of Type 1 AGN hosts had unphysical best-fit parameters.
We measure , the ratio of minor to major axis, using the publicly available galaxy fitting software GALFIT (Peng et al., 2002) and following the procedures of Gabor et al. (2009). Sources in the AGN vicinity (h-1kpc projected on the sky) are identified using Source Extractor (Bertin & Arnouts, 1996) and are either masked out of the image or simultaneously fit by GALFIT (if they are too close to the AGN for masking). We use the Source Extractor outputs based on isophotal profiles to generate initial guesses for the magnitude and shape parameters of the galaxy images in GALFIT. We fit each AGN image two separate times to explore different light distribution models. In one fit, we model the galaxy as a single Sérsic profile, and another uses a Sérsic profile plus a point source representing a nuclear point source (although over half of the optically dull AGNs have no strong nuclear point source; see below). Gabor et al. (2009) explored fits with additional components (e.g. a disk Sérsic profile), but found that such fits typically give unphysical results because they are unstable for the S/N of the HST/ACS images. By constraining the fits in radius, magnitude, and shape, we prevent GALFIT from exploring wildly unphysical parameter space, but we flag as unacceptable any fits which run into the boundaries or yield strikingly unphysical results (for more details, see Gabor et al., 2009).
The GALFIT analysis yields good fits for 37 of the optically dull AGNs. Most (21) of the optically dull AGNs are best fit with a single Sérsic component and no nuclear point source. Of the remaining 16 with two-component fits, 13 have only marginal contributions from a point source, and fitting these 13 AGNs with Sérsic-only components does not affect their values. Only 3 optically dull AGNs have significant nuclear point sources which would bias their measurements to high (less elongated) values if not included in the fit. These nuclear point source contributions are consistent with the tempate fitting in §3.1, which showed that the optically dull AGNs have blue AGN contributions of 35% or less. The GALFIT axis ratios correlate strongly with those measured using Source Extractor, with a mean absolute difference of 0.11 in . This suggests that our axis ratios are robust.
The optically dull AGNs and Type 2 AGNs in COSMOS have nearly identical ranges of axis ratio, with the optically dull AGN mean and the Type 2 AGN mean . While our optically dull AGNs have consistent axis ratios to those of Rigby et al. (2006), our Type 2 AGNs do not show the face-on preference that Rigby et al. (2006) claim for their “optically active” AGN sample. Part of this difference comes from the differences in sample definitions: the 6 “optically active” AGNs of Rigby et al. (2006) include 4 broad-line Type 1 AGNs, while we compare to only Type 2 AGNs. Rigby et al. (2006) showed that optically dull AGNs are quite different from Type 1 AGNs, while our Figure 8 shows that optically dull AGNs have similar hosts to Type 2 AGNs. In Gabor et al. (2009), it was shown that morphological fits to Type 1 AGN hosts suffer from many systematic errors. In particular, a Type 1 host could have an incorrectly high value, since even a slightly incorrect point source removal would leave a symmetric halo and a corresponding round residual. In any case, the fact that Type 2 and optically dull AGNs have similar axis ratios indicates that edge-on hosts are not causing the lack of narrow emission lines in optically dull AGNs.
4. Discussion
Combining the optical, X-ray, and infrared data, we have shown that optically dull AGNs exhibit the following properties:
-
1.
Nearly all (43/48) optically dull AGNs have significantly more blue emission than a typical red galaxy.
-
2.
A few (4/48) optically dull AGNs show variability on year timescales, especially in their blue emission.
-
3.
Even when counting only the blue AGN component, 70% (33/48) of optically dull AGNs have ratios like typical Type 1 and 2 AGNs.
-
4.
Optically dull AGNs lack the mid-IR power-law signature of Type 1 and Type 2 AGNs, instead exhibiting cool IRAC colors like normal galaxies.
-
5.
The X-ray column densities of optically dull AGNs are similar to those of Type 1 and Type 2 AGN, with no evidence for more absorption.
-
6.
Optically dull AGNs reside in a wide morphological variety of host galaxies, including isolated ellipticals, dusty spirals, and disturbed and potentially merging systems.
-
7.
At least 18/45 optically dull AGNs with HST/ACS imaging are diluted by extranuclear light in the spectroscopic aperture, either by a nearby companion galaxy or host galaxy light.
-
8.
The hosts of optically dull AGNs are not preferentially edge-on compared to Type 2 AGNs, so edge-on host galaxy obscuration cannot explain the lack of narrow emission lines.
While several authors (Comastri et al., 2002; Rigby et al., 2006; Civano et al., 2007) have suggested that optically dull AGNs are optically obscured, we find no evidence for Compton-thick or hot toroidal obscuration. While we can’t rule out weak obscuration (as proposed by Civano et al., 2007), the values for optically dull AGN are fully consistent with those of Type 2 AGNs (Mainieri et al., 2007), and Type 2 AGNs have emission lines while optically dull AGNs do not. Instead, our data support a framework where 70% (33/48) of optically dull AGNs are normal AGNs diluted by extranuclear galaxy light. The remainder of optically dull AGNs are not diluted or obscured, but have different emission properties for physical reasons: possibly because of a radiatively inefficient accretion flow.
4.1. The Case for Dilution
At the redshifts of the optically dull AGNs in the sample, our spectroscopic slit generally includes nearly all of the host galaxy, and occasionally even includes a nearby companion. This is especially evident in Figure 7, where at least 10 host galaxies contaminate the spectroscopic aperture and at least 8 others have a companion galaxy in the slit. One can imagine that many “optically normal” local Seyfert AGNs would appear “optically dull” if observed with spectroscopic apertures including extranuclear galaxy emission. Indeed, Moran, Filippenko & Chornock (2002) obtained integrated spectra for 18 local Seyfert 2 galaxies, and found that 11 (60%) of them would appear optically dull when observed in a spectroscopic slit at . Many of our optically dull AGNs may then be analogs to local Seyfert 2 AGNs. Dilution provides the simplest explanation for the four variable optically dull AGNs, all of which have a clear blue component in their optical photometry and for the AGN fraction of the template fit. Dilution by a host galaxy might explain all 33/48 (70%) of the optically dull AGN with ratios consistent with Type 1 and Type 2 AGN (that is, ). While only 18 show obvious evidence for extranuclear galaxy light in the slit, the other objects might be weak AGN with the emission lines diluted by a bright host. AGN activity is typically correlated with host luminosity (e.g., Hickox et al., 2009; Silverman et al., 2009), but there is a large scatter in the relation. Under the dilution hypothesis, some optically dull AGNs may represent the weak AGN / bright host tail of the relation.
However, dilution cannot explain all optically dull AGNs. Locally, 10-20% of local AGNs are undiluted and remain optically dull (La Franca et al., 2002; Hornschemeier et al., 2005). And in COSMOS, 15 optically dull AGNs are optically under-luminous compared to their X-ray emission, with . Dilution by a host galaxy, on the other hand, would cause AGNs to become more optically luminous compared to their X-ray emission. Indeed, optically dull AGNs with may also not fit the dilution paradigm, since presumably the additional host light would drive the optical flux of “normal” AGNs well below this cutoff. This suggests that 15/48 (30%) is a lower limit for the optically dull AGNs not explained by dilution.
4.2. The Case for Radiatively Inefficient Accretion
The optically dull AGNs in COSMOS do not show signs of strong obscuration, with X-ray column densities similar to Type 2 AGNs and blue IRAC colors. Their host galaxies are not preferentially edge-on compared to the hosts of Type 2 AGNs, suggesting that obscuration by the host is not the cause of their missing narrow emission lines. With no evidence for obscuration, the undiluted optically dull AGNs must be intrinsically weak in their optical emission. AGNs with low accretion rates are expected to be optically underluminous, with very weak or missing emission lines, in just this fashion. In the next section we investigate the properties of the 15/48 (30%) optically dull AGNs which are not explained by obscuration or dilution to see if they fit the properties expected for low accretion rate AGNs.
5. Accretion Properties
Observations have shown that broad lines tend to disappear from AGNs below accretion rates of (Kollmeier et al., 2006; Trump et al., 2009b). Type 1 AGNs are likely to decay into “naked” Type 2 AGNs (Tran, 2003; Bianchi et al., 2008) which have no evidence for obscuration. The theoretical interpretation (Nenkova et al., 2008; Hopkins et al., 2009; Elitzur & Ho, 2009) is that the broad line region decays as a natural effect of a shrinking accretion disk below , even as the X-ray emission remains bright. The undiluted optically dull AGNs may then be an extension of these ideas, with lower accretion rates driving an altered accretion disk. In the paradigm most suited to explaining optically dull AGNs, the accretion disk is optically thick as normal at higher radii from the black hole, but becomes optically thin below some transition radius (Yuan & Narayan, 2004). Thus the hot optical and UV continuum becomes cooler and redder, and the ionizing continuum becomes much weaker. Without an ionizing continuum, neither the broad nor the narrow line regions are excited, and the spectrum lacks the emission line signature of an AGN. Ho (1999) noted that several local low-luminosity AGNs exhibit this behavior, with a generally redder optical/UV continuum and a lack of the strong UV “big blue bump” found in luminous AGNs. Unfortunately, we cannot measure the accretion rate for these optically dull AGN because we cannot measure the black hole mass: they lack lines for using the scaling relations and they are too distant for dynamical estimates. Future work may leverage the relation to estimate , but that is beyond the scope of this work. Instead we will study other properties to see if these optically dull AGN are consistent with predictions of RIAF models.
Figure 9 shows the 3000-6000Å optical/UV composite spectrum from the 15 optically dull AGNs likely to have RIAFs. The top panel shows the full composite, while the bottom panel uses only the host-subtracted spectra to compute an AGN-only composite. Each composite spectrum was computed by taking a S/N-weighted mean of the spectra. (The absorption features of the full composite spectrum are artificially broadened by minor redshift errors in some of the optically dull AGN.) Note that the AGN-only composite is not simply the full composite minus a mean host component, but was computed from the individual host-subtracted spectra, using the best-fit “r+q” template from §3.1. For comparison, Figure 9 also shows SDSS composites of a red galaxy (Eisenstein et al., 2001) and a Type 1 AGN (Vanden Berk et al., 2001). Neither composite has broad or narrow emission lines, despite having higher S/N than the individual optically dull AGN spectra. While the full composite is bluer than a typical red galaxy, the AGN-only composite is much redder than a typical Type 1 AGN. The optical/UV instead supports a RIAF model with a truncated accretion disk and less hot UV emission.
Another important prediction for low accretion rate AGNs is that the dominant outflow mode switches from disk winds to radio jets (Ho, 2002; Elitzur & Shlosman, 2006). The radio synchrotron emission provides the dominant source of cooling and angular momentum transport for RIAF accretion states as the optically thin inner accretion disk no longer drives strong disk winds. Since the RIAF truncated accretion disk is naturally under-luminous in the optical, low accretion rate AGN should be both radio-bright and optically dim: in other words, their radio-loudness will be large. The radio properties for the optically dull AGN are shown in Figure 10, along a comparison sample of Type 1 AGNs from Trump et al. (2009a). Radio data are available from Very Large Array (VLA) observations in COSMOS (Schinnerer et al., 2007), and all optically dull AGN are detected at 1.4 GHz at the level. The optically dull AGNs in Figure 10 include only the AGN component in the optical emission. The Type 1 AGNs in the figure may also include optical light from the host galaxy, but any host light is likely to be minor compared to the Type 1 AGN optical emission. Nearly all of the optically dull AGN with are radio-loud, with , and they are more likely to be radio-loud than Type 1 AGNs. Their radio-loudness suggests that these optically dull AGNs are RIAFs with a strong radio jet.
While a full fit of the optically dull AGN SEDs to low accretion rate models is beyond the scope of this work, we have shown that the RIAF-candidate optically dull AGN have optical/UV and radio properties that differ from those of bright Type 1 and 2 AGNs. We note again that is a conservatively low limit for no host galaxy dilution, and so the fraction of optically dull AGNs that are RIAFs is likely to be greater than 30%. Indeed, Figure 10 shows that several optically dull AGNs with are also radio-loud, lending one piece of evidence that even more than 30% of optically dull AGNs are in a weakly accreting RIAF state.
6. Summary
We have presented 48 optically dull AGNs from COSMOS, all of which lack optical emission lines while exhibiting the X-ray brightness typical of an AGNs. Their IR and X-ray emission show no evidence for obscuration in excess of that in Type 1 and 2 AGNs, and their host galaxies are not preferentially edge-on when compared to Type 2 AGNs. We instead propose a framework where up to 70% of optically dull AGNs are diluted by their host galaxies or by nearby companions. The remaining 30% cannot be explained by dilution, and instead have optical/UV and radio properties which are best described by a RIAF state.
References
- Alexander et al. (2001) Alexander, D. M. et al. 2001, AJ, 122, 2156
- Alexander et al. (2003) Alexander, D. M. et al. 2003, ApJ, 126, 539
- Antonucci (1993) Antonucci, R. 1993, ARA&A, 31, 473
- Ballantyne & Papovich (2007) Ballantyne, D. R. & Papovich, C. 2007, ApJ, 660, 988
- Bauer et al. (2004) Bauer, F. E. , Alexander, D. M., Brandt, W. N., Schneider, D. P., Treister, E., Hornschemeier, A. E., & Garmire, G. P. 2004, AJ, 128, 2048
- Bertin & Arnouts (1996) Bertin, E. & Arnouts, S. 1996, A&A, 117, 393
- Bianchi et al. (2008) Bianchi, S. et al. 2008, MNRAS, 385, 195
- Bigelow et al. (1998) Bigelow, B. C., Dressler, A. M., Shectman, S. A., & Epps, H. W. 1998, in Proc. SPIE Vol. 3355, 225, Optical Astronomical Instrumentation, Sandro D’Odorico; Ed.
- Brandt & Hasinger (2005) Brandt, W. N. & Hasinger, G. 2005, ARA&A, 43, 827
- Brusa et al. (2007) Brusa, M. et al. 2007, ApJS, 172, 353
- Brusa et al. (2009) Brusa, M. et al. 2009 in prep.
- Bundy et al. (2007) Bundy, K. et al. 2007, ApJ, 681, 931
- Capak et al. (2007) Capak, P. et al. 2007, ApJS, 172, .99
- Capak et al. (2009) Capak, P. et al. 2009, in prep.
- Cappelluti et al. (2009) Cappelluti, N. et al. 2009, A&A, 497, 635
- Cash (1979) Cash, W. 1979, ApJ 228, 939
- Civano et al. (2007) Civano, F. et al. 2007, A&A, 476, 1223
- Colbert et al. (2004) Colbert, E. J. M., Heckman, T. M., Ptak, A. F., Strickland, D. K., & Weaver, K. A. 2004, ApJ, 602, 231
- Comastri et al. (2002) Comastri, A. et al. 2002, ApJ, 571, 771
- Comastri et al. (2003) Comastri, A., Brusa, M., & Mignoli, M. 2003, AN, 324, 28
- Daddi et al. (2007) Daddi, E. et al. 2007, ApJ, 670, 173
- Donley et al. (2007) Donley, J. L., Rieke, G. H., P rez-Gonz lez, P. G., Rigby, J. R., & Alonso-Herrero, A 2007, ApJ, 660, 167
- Eisenstein et al. (2001) Eisenstein, D. J. et al. 2001, AJ, 122, 2267
- Elitzur & Shlosman (2006) Elitzur, M., & Shlosman, I. 2006, ApJ, 648, L101
- Elitzur (2008) Elitzur, M. 2008, NewAR, 52, 274
- Elitzur & Ho (2009) Elitzur, M. & Ho, L. C. 2009, ApJL, 701, 91
- Elvis et al. (1981) Elvis, M., Schreier, E. J., Tonry, J., Davis, M., & Huchra, J. P. ApJ, 246, 20
- Elvis et al. (2009) Elvis, M. et al.2009, ApJ in press (astro-ph/0903.2062)
- Fabbiano (1989) Fabbiano, G. 1989, ARA&A, 27, 87
- Gabor et al. (2009) Gabor, J. M. et al. 2009, ApJ, 691, 705
- Hao et al. (2005) Hao, L. et al. 2005, AJ, 129, 1795
- Hickox et al. (2009) Hickox, R. C. et al.2009, ApJ, 696, 891
- Ho (1999) Ho, L. C. 1999, ApJ, 516, 672
- Ho (2002) Ho, L. C. 2002, ApJ, 564, 120
- Hopkins et al. (2009) Hopkins, P. F., Hickox, R., Quataert, E., & Hernquist, L. 2009, MNRAS submitted (arXiv/0901.2936)
- Hopkins et al. (2004) Hopkins, P. F. et al. 2004, AJ, 128, 1112
- Hornschemeier et al. (2001) Hornschemeier, A. F. et al. 2001, ApJ, 554, 742
- Hornschemeier et al. (2005) Hornschemeier, A. E., Heckman, T. M., Ptak, A. F., Tremonti, C. A., & Colbert, E. J. M. 2005, AJ, 129, 86
- Ilbert et al. (2009) Ilbert, O. et al. 2009, ApJ, 690, 1236
- Jahnke et al. (2004) Jahnke, K., Kuhlbrodt, B., & Wisotzki, L. 2004, MNRAS, 352, 399
- Kelly et al. (2009) Kelly, B. C., Bechtold, J., & Siemiginowska, A. 2009, ApJ, 698, 895
- Koekemoer et al. (2007) Koekemoer, A. M. et al. 2007, ApJS, 172, 196
- Kollmeier et al. (2006) Kollmeier, J. A. et al. 2006, ApJ, 648, 128
- Lacy et al. (2004) Lacy, M. et al.2004, ApJS, 154, 166
- La Franca et al. (2002) La Franca, F. et al. 2002, ApJ, 570, 100
- Lanzuisi et al. (in prep.) Lanzuisi et al.2009, in prep.
- Luo et al. (2008) Luo, B. et al. 2008, ApJS, 179, 19
- Maccacaro et al. (1988) Maccacaro, T., Gioia, I. M., Wolter, A., Zamorani, G., & Stocke, J. T. et al. 1988, ApJ, 326, 680
- Mainieri et al. (2007) Mainieri, V. et al. 2007, ApJS, 172, 368
- Moran, Filippenko & Chornock (2002) Moran, E. C., Filippenko, A. V., & Chornock, R. 2002, ApJL, 579, 71
- Morokuma et al. (2008) Morokuma et al. 2008, ApJ, 676, 121
- Nagao et al. (2002) Nagao, T., Murayama, T., Shioya, Y., & Taniguchi, Y. 2002, ApJ, 567, 73
- Nenkova et al. (2008) Nenkova, M. et al. 2008, ApJ, 685, 160
- Page et al. (2003) Page, M. J. et al. 2003, AN, 324, 101
- Peng et al. (2002) Peng, C. Y., Ho, L. C., Impey, C. D., & Rix, H.-W. 2002, AJ, 124, 266
- Quataert et al. (1999) Quataert, E., Di Matteo, T., Narayan, R., & Ho, L. C. 1999, ApJ, 525, 89
- Richards et al. (2006) Richards, G. T. et al. 2006, ApJ, 166, 470
- Rigby et al. (2006) Rigby, J. R., Rieke, G. H., Alonso-Herrero, A., & Perez-Gonzalez, P. G. 2006, ApJ, 645, 115
- Risaliti & Elvis (2004) Risaliti, G. & Elvis, M. 2004, in Supermassive Black Holes in the Distant Universe, ed. A. J. Barger (Dordrecht, The Netherlands: Kluwer), 187
- Sajina et al. (2005) Sajina, A., Lacy, M., & Scott, D. 2005, ApJ, 621, 256
- Salvato et al. (2009) Salvato, M. 2009, ApJ, 690, 1250
- Sánchez et al. (2004) Sánchez, S. F et al. 2004, ApJ, 614, 586
- Schinnerer et al. (2007) Schinnerer, E. et al. 2007, ApJS, 172, 46S
- Scoville et al. (2007) Scoville, N. et al. 2007, ApJS, 172, 38
- Severgnini et al. (2003) Severgnini, P. et al. 2003, A&A, 406, 483
- Shields et al. (2000) Shields, J. C. et al. 2000, ApJ, 534, 27
- Silverman et al. (2009) Silverman, J. D. et al.2009, ApJ, 696, 891
- Stern et al. (2005) Stern, D. et al.2005, ApJ, 631, 163
- Taniguchi et al. (2007) Taniguchi, Y. et al. 2007, ApJS, 172, 9
- Taniguchi et al. (2009) Taniguchi, Y. et al. 2009, in prep.
- Tran (2003) Tran, H. D. 2003, ApJ, 583, 632
- Trump et al. (2009a) Trump, J. R. et al. 2009a, ApJ, 696, 1195
- Trump et al. (2009b) Trump, J. R. et al. 2009b, ApJ, 700, 49
- Vanden Berk et al. (2001) Vanden Berk, D. E. et al. 2001, AJ, 122, 549
- Ueda et al. (2008) Ueda et al. 2008, ApJS 179, 124
- York et al. (2000) York, D. et al. 2000, AJ, 120, 1579
- Yuan & Narayan (2004) Yuan, F. & Narayan, R. 2004, ApJ, 612, 724
| Object Name | z | S/N | (AGN) | aaAGN undetected in the hard (2-10 keV) X-ray band have , while those undetected in the soft (0.5-2 keV) X-ray band have . | bbAGN hosts which lack morphological data are assigned . | ||||
|---|---|---|---|---|---|---|---|---|---|
| COSMOS J095802.10+021541.0 | 0.94 | 3.75 | 21.01 | 43.29 | -0.6 | 0.00 | 1.1 | -1.00 | -1.00 |
| COSMOS J095808.98+022739.9ccThese optically dull AGN show significant variability in their blue emision. | 0.85 | 8.16 | 21.62 | 43.51 | -0.0 | 0.21 | 0.6 | -0.27 | 0.73 |
| COSMOS J095809.45+020532.4 | 0.61 | 7.73 | 20.80 | 42.65 | -0.9 | 0.12 | 0.1 | -1.00 | 0.57 |
| COSMOS J095820.57+023330.1ccThese optically dull AGN show significant variability in their blue emision. | 0.96 | 1.18 | 21.51 | 43.52 | -0.2 | 0.20 | 0.5 | -0.42 | 0.60 |
| COSMOS J095830.25+022400.8 | 0.85 | 5.51 | 21.57 | 42.89 | -0.7 | 0.03 | 0.8 | -1.00 | -1.00 |
| COSMOS J095834.23+024332.5 | 0.39 | 14.33 | 19.86 | 42.56 | -0.9 | 0.05 | 0.4 | 0.20 | 0.27 |
| COSMOS J095839.01+021610.6 | 0.68 | 10.42 | 20.08 | 43.36 | -0.6 | 0.02 | 1.1 | -0.35 | 0.62 |
| COSMOS J095846.02+014905.6 | 0.74 | 5.75 | 20.24 | 43.44 | -0.5 | 0.06 | 0.7 | -0.10 | 0.52 |
| SDSS J095849.02+013219.8 | 0.36 | 3.55 | 18.94 | 44.83 | 1.1 | 0.25 | 1.7 | -0.64 | -1.00 |
| COSMOS J095857.20+015843.7 | 0.52 | 6.02 | 21.30 | 43.60 | 0.4 | 0.03 | 1.9 | 0.66 | 0.34 |
| COSMOS J095906.97+021357.8 | 0.76 | 5.11 | 21.30 | 43.94 | 0.4 | 0.02 | 2.0 | 0.02 | 0.42 |
| COSMOS J095917.26+021516.9 | 0.94 | 7.88 | 20.85 | 43.71 | -0.2 | 0.32 | 0.2 | -0.51 | 0.76 |
| COSMOS J095926.01+014444.3 | 0.67 | 6.03 | 20.72 | 43.49 | -0.2 | 0.04 | 1.3 | -0.56 | 0.83 |
| COSMOS J095937.42+022347.4 | 0.74 | 5.90 | 21.15 | 42.66 | -0.9 | 0.16 | -0.1 | -1.00 | 0.82 |
| COSMOS J095938.56+023316.8 | 0.75 | 27.31 | 19.92 | 43.51 | -0.6 | 0.25 | 0.0 | -0.37 | -1.00 |
| COSMOS J095940.86+023051.2 | 0.70 | 7.16 | 21.74 | 42.59 | -0.7 | 0.12 | 0.2 | -1.00 | 0.34 |
| COSMOS J095945.21+023021.5 | 0.89 | 5.56 | 20.76 | 42.84 | -1.1 | 0.26 | -0.5 | -1.00 | 0.95 |
| COSMOS J095958.46+021530.8ccThese optically dull AGN show significant variability in their blue emision. | 0.66 | 15.13 | 20.12 | 44.01 | 0.1 | 0.28 | 0.7 | -0.45 | 0.45 |
| COSMOS J095959.36+022458.4 | 0.57 | 13.67 | 20.42 | 43.02 | -0.6 | 0.18 | 0.2 | -0.26 | 0.62 |
| COSMOS J100005.36+023059.6 | 0.68 | 6.42 | 20.90 | 43.35 | -0.2 | 0.04 | 1.1 | 0.02 | 0.36 |
| COSMOS J100006.42+023343.4 | 0.75 | 8.91 | 20.96 | 43.31 | -0.4 | 0.11 | 0.6 | -0.52 | 0.85 |
| COSMOS J100013.33+022657.2 | 0.73 | 7.83 | 20.71 | 43.91 | 0.2 | 0.03 | 1.6 | 0.21 | -1.00 |
| COSMOS J100013.41+021400.6 | 0.94 | 4.24 | 20.76 | 43.68 | -0.3 | 0.13 | 0.6 | -0.32 | -1.00 |
| COSMOS J100024.09+014005.4 | 0.62 | 13.96 | 19.74 | 42.65 | -1.3 | 0.03 | 0.1 | -1.00 | 0.84 |
| COSMOS J100024.86+023302.7 | 0.50 | 8.73 | 21.05 | 43.14 | -0.1 | 0.28 | 0.5 | -0.45 | 0.61 |
| SDSS J100028.28+024103.5 | 0.35 | 7.33 | 17.44 | 42.61 | -1.7 | 0.00 | 0.0 | -0.53 | 0.72 |
| COSMOS J100031.27+022819.9 | 0.93 | 2.69 | 21.56 | 44.04 | 0.4 | 0.07 | 1.5 | -0.18 | 0.73 |
| COSMOS J100034.04+024225.3 | 0.85 | 7.21 | 20.64 | 43.37 | -0.6 | 0.22 | 0.1 | -0.30 | 0.50 |
| COSMOS J100036.21+024928.9 | 0.47 | 5.69 | 18.77 | 43.03 | -1.0 | 0.25 | -0.4 | 0.20 | 0.67 |
| COSMOS J100037.99+014248.6 | 0.62 | 8.77 | 20.39 | 43.17 | -0.5 | 0.20 | 0.2 | -0.30 | 0.63 |
| COSMOS J100046.55+024412.0 | 0.22 | 28.43 | 20.42 | 42.27 | -0.3 | 0.00 | 1.3 | 1.00 | 0.33 |
| COSMOS J100047.93+014935.8 | 0.89 | 5.21 | 21.26 | 44.16 | 0.4 | 0.17 | 1.2 | -0.55 | 0.79 |
| COSMOS J100052.99+014123.8 | 0.68 | 3.95 | 21.84 | 42.77 | -0.4 | 0.14 | 0.4 | -1.00 | 0.37 |
| COSMOS J100059.45+013232.8 | 0.89 | 1.46 | 22.58 | 44.26 | 1.0 | 0.00 | 2.7 | 0.41 | -1.00 |
| COSMOS J100105.84+023041.0 | 0.70 | 10.16 | 20.64 | 43.64 | -0.1 | 0.13 | 0.8 | 0.11 | 0.39 |
| COSMOS J100124.06+024936.7 | 0.82 | 10.06 | 20.54 | 43.60 | -0.3 | 0.01 | 1.5 | 0.14 | -1.00 |
| SDSS J100131.15+022924.8 | 0.35 | 4.95 | 18.26 | 42.91 | -1.0 | 0.05 | 0.3 | -0.67 | 0.71 |
| COSMOS J100139.10+023824.2 | 0.49 | 5.44 | 22.60 | 41.98 | -0.6 | 0.80 | -0.5 | -1.00 | -1.00 |
| COSMOS J100153.45+021152.8 | 0.48 | 7.97 | 19.31 | 43.12 | -0.7 | 0.16 | 0.1 | 1.00 | -1.00 |
| COSMOS J100209.70+023432.3 | 0.61 | 14.44 | 21.09 | 42.50 | -0.9 | 0.20 | -0.2 | -1.00 | 0.18 |
| COSMOS J100216.37+015008.2ccThese optically dull AGN show significant variability in their blue emision. | 0.67 | 10.32 | 21.04 | 43.28 | -0.2 | 0.02 | 1.4 | 1.00 | 0.46 |
| COSMOS J100224.16+023107.7 | 0.67 | 6.09 | 21.68 | 43.14 | -0.1 | 0.26 | 0.5 | -0.55 | 0.85 |
| COSMOS J100231.26+022716.4 | 0.81 | 20.00 | 20.22 | 43.61 | -0.4 | 0.17 | 0.3 | -0.59 | -1.00 |
| COSMOS J100232.15+022925.6 | 0.80 | 5.89 | 20.88 | 42.78 | -1.0 | 0.28 | -0.4 | -1.00 | 0.81 |
| COSMOS J100237.09+014648.0 | 0.67 | 11.70 | 20.52 | 44.12 | 0.4 | 0.03 | 1.9 | -0.13 | 0.52 |
| COSMOS J100238.63+024743.1 | 0.82 | 1.90 | 21.89 | 42.68 | -0.7 | 0.00 | 1.0 | -1.00 | -1.00 |
| COSMOS J100240.30+020147.3 | 0.64 | 5.91 | 21.87 | 43.45 | 0.3 | 0.04 | 1.7 | -0.15 | 0.38 |
| COSMOS J100243.93+022340.7 | 0.66 | 3.82 | 21.13 | 42.49 | -1.0 | 0.16 | -0.2 | -1.00 | 0.30 |