Classical T Tauri-like Outflow Activity in the Brown Dwarf Mass Regime. 11affiliation: Based on data collected by UVES observations (079.C-0375(A)) at the VLT on Cerro Paranal (Chile) which is operated by the European Southern Observatory (ESO).
Abstract
Over the last number of years spectroscopic studies have strongly supported the assertion that protostellar accretion and outflow activity persists to the lowest masses. Indeed, previous to this work the existence of three brown dwarf (BD) outflows had been confirmed by us. In this paper we present the results of our latest investigation of BD outflow activity and report on the discovery of two new outflows. Observations to date have concentrated on studying the forbidden emission line (FEL) regions of young BDs and in all cases data has been collected using the UV-Visual Echelle Spectrometer (UVES) on the ESO VLT. Offsets in the FEL regions are recovered using spectro-astrometry. Here ISO-Oph 32 is shown to drive a blue-shifted outflow with a radial velocity of 10-20 kms-1 and spectro-astrometric analysis constrains the position angle of this outflow to 240∘ 7∘. The BD candidate ISO-ChaI 217 is found to have a bipolar outflow bright in several key forbidden lines (VRAD = -20 kms-1, +40kms-1) and with a PA of 190∘-210∘. A striking feature of the ISO-ChaI 217 outflow is the strong asymmetry between the red and blue-shifted lobes. This asymmetry is revealed in the relative brightness of the two lobes (red-shifted lobe is brighter), the factor of two difference in radial velocity (the red-shifted lobe is faster) and the difference in the electron density (again higher in the red lobe). Such asymmetries are common in jets from low mass protostars (0.1 M⊙to 2 M⊙) and the observation of a marked asymmetry at such a low mass ( 0.1 M⊙) supports the idea that BD outflow activity is scaled down from low mass protostellar activity. Also note that although asymmetries are unexceptional, it is uncommon for the red-shifted lobe to be the brightest as some obscuration by the accretion disk is assumed. This phenomenon has only been observed in one other source, the classical T Tauri (CTTS) star RW Aur. The physical mechanism responsible for the brightening of the red-shifted lobe although as yet unknown must also now apply at BD masses to include the ISO-ChaI 217 outflow. In addition to presenting these new results, a comprehensive comparison is made between BD outflow activity and jets launched by CTTSs. In particular, the application of current methods for investigating the excitation conditions and mass loss rates () in CTT jets to BD spectra is explored. Where possible the Bacciotti Eislöffel technique is used to study the ionisation fraction, electron temperature and total density. For LS-RCrA 1, ISO-ChaI 217 and ISO-Oph 102 is measured to be in the range 10-10 to 10-9 M⊙yr-1 using a method based on the luminosity of the [OI]6300 and [SII]6731 lines. Mass loss rates for our sample of BD outflows are found to be comparable to the mass accretion rates. Overall, as our results and discussion show, what is currently known about outflow activity in the BD mass regime points to strong similarities between BD outflows and CTT jets.
1 Introduction
The outflow phenomenon, much studied in young stars has been observed in a wide variety of astrophysical objects from low mass protostars to active galactic nuclei (AGN) (Reipurth & Bally, 2001; Camenzind, 2005). Brown Dwarfs (BDs) are the newest objects to be added to this list (Fernández & Comerón, 2001; Barrado y Navascués et al., 2004; Whelan et al., 2005, 2007; Phan-Bao et al., 2008; Whelan et al., 2009). We are currently leading a project to search for and study outflows driven by young BDs and very low mass stars. The overall aim of this work is to explore outflow activity in the BD mass regime through comparison with observations of outflows driven by low mass protostars and the classical T Tauri stars (CTTSs) in particular. Much emphasis has been placed on understanding how accretion activity (Gatti et al., 2006; Herczeg et al., 2009) and planet formation processes (Pascucci et al., 2009) differ between low mass protostars and young BDs. However, little is still known about whether the outflow mechanism varies as mass decreases towards the BD regime. Observations aimed at detecting outflows from such low mass objects are difficult and rare and to date six candidates have been investigated by us spectro-scopically at visible wavelengths.
Outflows from low mass protostars are revealed in several forms, from slow wide angled winds to molecular outflows and jets (Reipurth & Bally, 2001). A protostellar jet is a relatively fast (typical radial velocity = 200 kms-1) collimated outflow normally seen within a few 1000 AU of a young star and bright in optical and/or near-infrared shock tracers such as [SII]6731, [FeII] at 1.644m or H2 at 2.122 m. CTTSs are Class II low mass protostars (Lada, 1987; Andre et al., 1993), meaning that they are coming towards the end of their accretion/outflow phase and have crossed the so-called “birth-line” (Stahler, 1983). As they are optically visible the jet can be traced very close to the protostar, hence, they offer a unique opportunity to study the launching of protostellar jets at high spatial resolution (Ray et al., 2007). Jets from CTTSs are traditionally probed at forbidden emission line (FEL) wavelengths and long-slit and integral field spectroscopic techniques have been hugely important in their study (Dougados et al., 2000; Whelan et al., 2004). That CTT-like outflows could be launched by actively accreting BDs was first suggested when high quality spectra revealed the presence of FEL regions in the optical spectra of BDs known to be accretors (Fernández & Comerón, 2001). While the FEL regions were easily identified they were considerably fainter than those detected in the spectra of CTTSs (Masciadri & Raga, 2004) and any extension in the form of an outflow was not apparent (Fernández & Comerón, 2001, 2005). Hence their origin in an outflow could not be established. The critical density region for FELs occurs much closer to the driving source of the outflow for nearby ( 150 pc) young BDs than for low mass protostars and for BDs is estimated to be on scales of 100 mas (Whelan et al., 2005). As the most intense forbidden emission coincides with the critical density region it is currently challenging to directly resolve a BD outflow in FELs and this goal has not yet been achieved. Our approach to this problem has been to obtain high quality spectra using the UV-Visual Echelle Spectrometer (UVES) on the European Southern Observatory’s (ESO) Very Large Telescope (VLT) and to recover the spatial offset in the region of forbidden emission using spectro-astrometry.
The sources targeted so far meet at least one of two criteria. Firstly they all have masses at or significantly below the hydrogen burning mass limit (HBML) and secondly they are known to be powerful accretors. Their classification as a strong accretor is based on studies of their H lines (Jayawardhana et al., 2003a) and on measurements of their mass accretion rates (see Table 6). In the vast majority of cases the mass of young BD candidates cannot be directly measured and estimates are based on theoretical predictions (Luhman et al., 2000) and/or spectral modelling (Mohanty et al., 2004). The objects investigated by us so far are listed in Table 1 along with their theoretical masses and spectral types. Previous to this paper we have reported on the discovery of and discussed the optical outflows from, ISO-Oph 102 (Whelan et al., 2005), 2MASS1207-3932 (Whelan et al., 2007) and LS-RCrA 1 (Whelan et al., 2009). With a mass of only 24 MJUP 2MASS1207-3932 is at present the lowest mass galactic object driving an outflow. In this paper we present the results of our recent observations of ISO-ChaI 217, DENIS-P J160603.9-205644 and ISO-Oph 32 and report for the first time outflows driven by ISO-ChaI 217 and ISO-Oph 32. Of the six objects observed by us to date only one, ISO-ChaI 217 has a theoretical mass which is just above the HBML, placing it at present just outside the mass range for a BD. However, with a predicted mass of just 80 MJUP it is still one of the lowest mass objects known to launch an outflow. Therefore for the purpose of the discussion we will include it in this paper with the likely BDs. In addition to presenting our spectro-astrometric analysis, a technique for constraining the position angle (PA) of the BD outflows is outlined, methods for studying the physical conditions of the BD outflow and of estimating the mass outflow rate are discussed and similarities between BD outflows and CTT jets highlighted and considered.
2 Observations and Spectro-astrometric Analysis
Spectra (at orthogonal slit positions) of ISO-Cha1 217, ISO-Oph 32 and DENIS-P J160603.9-205644 were obtained with the high resolution spectrometer UVES (CD3 disperser, spectral range 4810-6740 Å, R=40,000;), on the ESO VLT UT2 (Dekker et al., 2000), as part of the observing program 079.C-0375(A). In each case the exposure time was 2700s, the slit width 1″ and the seeing varied between 05 and 09. Spectra were analysed using spectro-astrometry as outlined in previous papers (Whelan et al., 2005, 2007). Also see Whelan & Garcia (2008) for details on basic data reduction steps and continuum/night sky line subtraction. To summarise spectro-astrometry involves the measurement of the spatial centroid of an emission line (using Gaussian fitting) as a function of velocity. The centroid of the continuum emission is taken as the position of the star/BD and the emission line centroid is measured with respect to this position.
Problems specific to the application of spectro-astrometry to BD spectra are the lack of or weakness of continuum emission from the BD in the range 5000-8000 Å and the faintness of the line emission itself. In order to overcome these problems and increase the spectro-astrometric accuracy, the spectra are summed or smoothed in the dispersion direction. In the absence of detector noise, the spectro-astrometric accuracy is dependent on N where Np is the number of detected photons in the line/continuum (Whelan et al., 2005). In the cases where spectra are summed, the line and continuum are summed separately and by differing amounts, so that the spectro-astrometric error in the line and continuum position is comparable. Recall that the continuum must be removed before the line centroid is fitted. In these cases, points are a moving sum across the line and continuum (see Figures 3-7 and Figure 11). For BDs where the line emission is weaker than the underlying continuum emission it was more effective to decrease the spectral resolution and hence increase the signal by smoothing the spectrum using a Gaussian filter (Whelan et al., 2007). Again this is done so that errors are comparable. The [OI]6300 line region in the spectra of ISO-Oph 32 was smoothed using a Gaussian filters of fwhm = 0.2 Å 032. The results of the spectro-astrometric analysis of the smoothed spectra are shown in Figures 9 and 10. In all cases the dashed line delinates the 1- error in the continuum (and hence line) centroid. Finally, the issue of spectro-astrometric artifacts must be addressed. Spectro-astrometric artifacts, or false spectro-astrometric signals, can be introduced into a spectrum for a variety of reasons (Podio et al., 2008). In our studies of BD outflows we have ruled out the influence of such artifacts by demonstrating that lines like HeI6678, which will not form in an outflow, do not have any spectro-astrometric signal. If the outflow signatures detected in the FELs were due to artifacts then these lines would also show similar offsets. In addition, note that the H line in the majority of cases does not show any offset. This is in agreement with the idea that most of the H emission comes from the accretion zone close to the source. For all the BDs, spectra are presented at several PAs, and offsets measured at the different PAs agree. Lastly the position velocity (PV) diagram of the emission line regions of ISO-ChaI 217 supports the spectro-astrometric analysis.
| Source | RA (J2000) | Dec (J2000) | Spectral Type | Mass (MJUP) |
|---|---|---|---|---|
| ISO-ChaI 217 | 11 09 52.0 | -76 39 12.0 | M6.2 | 801 |
| 2MASS1207-3932 | 12 07 33.4 | -39 32 54.0 | M8 | 242 |
| DENIS-P J160603.9-205644 | 16 06 03.90 | -20 56 44.6 | M7.5 | 403 |
| ISO-Oph 32 | 16 26 22.05 | -24 44 37.5 | M8 | 404 |
| ISO-Oph 102 | 16 27 06.58 | -24 41 47.9 | M6 | 604 |
| LS-RCrA 1 | 19 01 33.7 | -37 00 30.0 | M6.5 | 35-725 |
3 Results of Spectro-astrometric Analysis
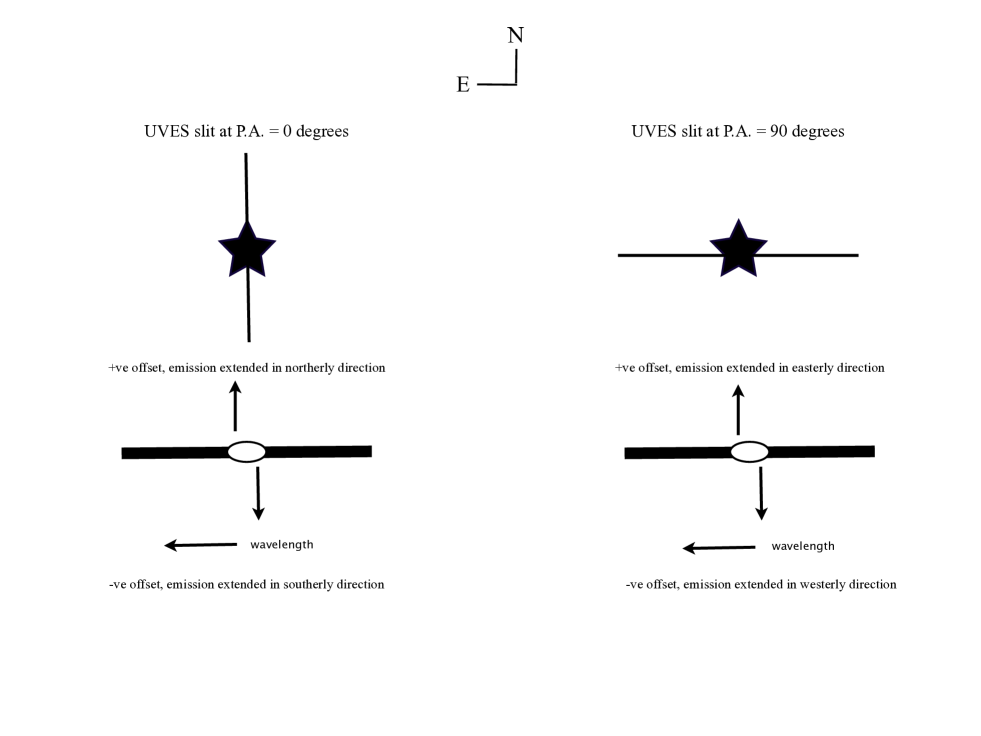
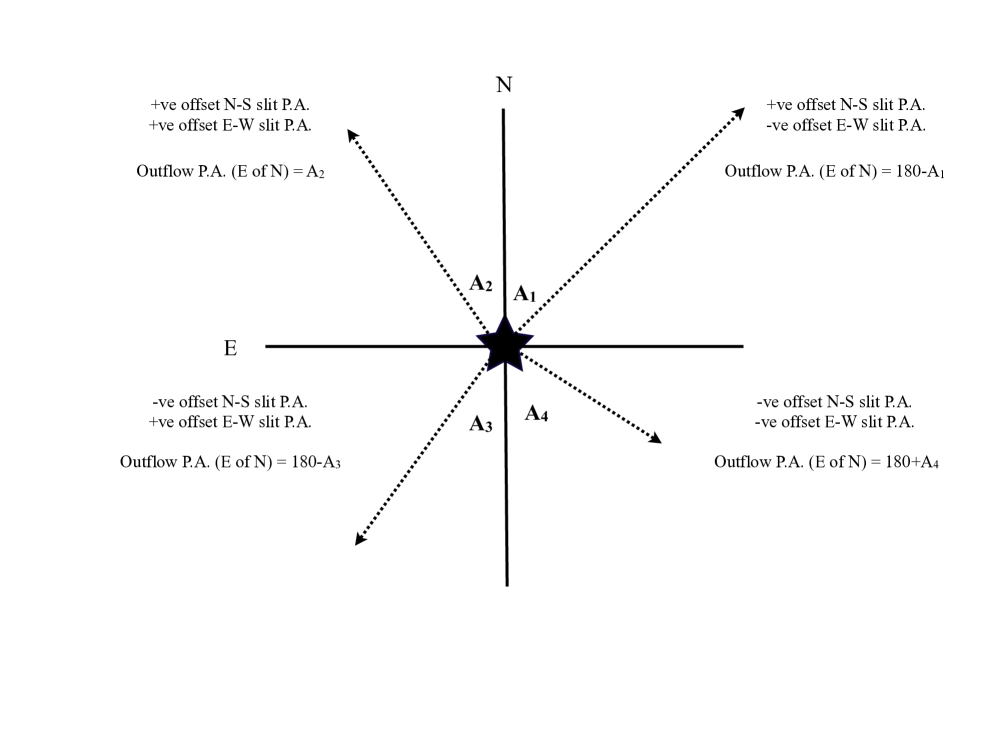
In this section the results of the spectro-astrometric analysis of the FE and H line regions of, ISO-Cha1 217, ISO-Oph 32 and DENIS-P J160603.9-205644, are presented. The particulars of the spectro-astrometric technique, as applied to BD spectra, are discussed above. As well as recovering the spatial offset in the FEL regions of our BD candidates (FELs were only detected in the case of ISO-ChaI 217 and ISO-Oph 32) this technique is also used to estimate the PA of the new BD outflows, through comparison of the spectro-astrometric offsets measured at orthogonal slit positions. Jets driven by CTTSs were first observed using narrow band imagery and long slit spectroscopy (Mundt & Fried, 1983; Solf & Boehm, 1993). Hirth et al. (1994, 1997) estimated the micro-jet PA for a sample of CTTSs by taking spectra at several slit PAs and plotting the positional offset and spatial full width half maximum (FWHM) of the [SII]6731 line as a function of slit PA. They argue that the [SII]6731 line is a better indicator of the outflow direction than the [OI]6300 line, as its lower critical density means that it traces the jet at a greater distance from the source. Closer to the source other outflow components e.g the low velocity component could influence any measurement of the jet PA. Although, the approach of Hirth et al. (1994) would provide a more straight-forward way of estimating the outflow PA for our BD candidates, the number of spectra that could be collected was limited by the faintness of the FELs and thus the on source time needed to detect them with a reasonable S/N (on average 45 mins with the VLT). For UVES, a negative spectro-astrometric offset, at a N-S slit PA equals a southerly displacement in an emission feature and a positive offset a northerly displacement. For an E-W slit P.A, negative and positive offsets correspond to westerly and easterly directions respectively. This is illustrated in Figure 1. As demonstrated in Figure 2. comparison of the signs of the N-S, E-W spectro-astrometric offsets allows the quadrant in which the blue-shifted outflow lies to be ascertained. Once this is known the actual outflow PA (E of N) can be derived. The dashed, arrowed lines represent the blue-shifted lobe of the outflow as located in each quadrant. The angles A1 to A4 are simply estimated from tan(A1…4) = (offset for E-W slit)/(offset for N-S slit).
Error is introduced by the fact that the positional offset in the FEL regions is not directly resolved but recovered using spectro-astrometry. The accuracy which one can measure the positional displacement of an unresolved emission feature using Gaussian fitting depends primarily on the S/N of the emission feature. However the displacement is also weighted by the uniformity of the emission. One emission feature could actually be made up of several unresolved features of differing intensity. Where the spectro-astrometric technique measures the spatial mean of the feature to be, is influenced by where the maximum intensity feature lies. In other words an unresolved jet will be measured to be less extended than it really is (using spectro-astrometry), if it actually consists of bright inner knots and lower brightness material further out. For the above reasons the estimates of the PAs of the ISO-ChaI 217 and ISO-Oph 32 outflows given here are a first approximation and the errors quoted are taken from the spectro-astrometric uncertainity (dependent on S/N). Also note that outflow PAs measured here only apply to the outflow as studied close to its driving source. It is possible that some bending may occur in the outflow at large distances which will change the outflow PA (Fendt & Zinnecker, 1998). However we expect any such variation to be within the errors quoted in Table 3. Below, the results for ISO-Cha1 217, ISO-Oph 32 and DENIS-P J160603.9-20564 are presented separately. Tables 2 and 3 give the FELs detected for each source along with the radial velocity (measured with respect to the systemic velocity), offset measured and estimate of the outflow PA.
| Object | Slit PA (∘) | Line | V (kms-1) | Offset (mas) |
| ISO-ChaI 217 | 0 | [OI]6300 | -20/30 | -50/50 ( 6) |
| [OI]6363 | -10/28 | -50/45 ( 9) | ||
| [SII]6716 | -20/42 | -180/200 ( 33.5) | ||
| [SII]6731 | -20/38 | -180/180 ( 33.5) | ||
| 90 | [OI]6300 | -10/20 | -30/25 ( 6) | |
| [OI]6363 | -10/20 | -40/10 ( 12) | ||
| [SII]6716 | -15/40 | -46/40 ( 14) | ||
| [SII]6731 | -20/45 | -75/55 ( 14) | ||
| ISO-Oph 32 | 0 | [OI]6300 | -10 | -60 ( 10) |
| 90 | [OI]6300 | -20 | -105 ( 19) |
| Object | Line | Outflow PA (∘) |
|---|---|---|
| ISO-ChaI 217 | [OI]6300 | 209 ( 8) |
| [OI]6363 | 206 ( 15) | |
| [SII]6716 | 193 ( 5) | |
| [SII]6731 | 200 ( 6) | |
| ISO-Oph 32 | [OI]6300 | 240 ( 7) |
3.1 ISO-ChaI 217
ISO-ChaI 217 was first reported as part of an ISOCAM survey of the Chamaeleon I dark cloud (Persi et al., 2000). Current estimates place its mass at 80 MJUP (Muzerolle et al., 2005) and its spectral type between M7.5 and M6.25 (López Martí et al., 2004; Muzerolle et al., 2005). Hence, it currently lies on the boundary between being a BD or an ultra-low mass star. The accretion properties of ISO-ChaI 217 have been much studied in recent years. Apai et al. (2005) confirm mid-infrared excess emission, indicative of the presence of a disk and Scholz & Jayawardhana (2006) demonstrate that it is a strong accretor which exhibits significant variability in its accretion activity. Scholz & Jayawardhana (2006) also observe signatures of outflow activity in their spectra of ISO-Cha1 217. These signatures are in the form of FELs of S. Here the origin of these (and other) FELs in an outflow driven by ISO-ChaI 217 is confirmed for the first time.
UVES spectra of ISO-ChaI 217, taken at orthogonal slit positions were obtained on May 1st 2007. Strong [SII]6716,6731, [OI]6300,6363 and H emission was detected at both PAs along with weak [NII]6548 emission. Blue and red-shifted components to the [SII]6716,6731 and [OI]6300,6363 lines were detected at an average radial velocity (w.r.t the systemic velocity) of -16 and 32 kms-1. The systemic velocity of ISO-ChaI 217 is taken as +2 kms-1 (James et al., 2006; Bary et al., 2008). The [SII]6716,6731, [OI]6300,6363 and H lines were analysed with spectro-astrometry and the analysis revealed the blue and red-shifted emission to be offset in opposing directions. Hence, ISO-Cha I 217 is driving a bipolar outflow (see Figures 3, 4, 5, 6, 7). As is the case in CTTS the [SII]6716,6731 lines trace the outflow further from the source than the [OI]6300,6363 lines (refer to Table 2). Emission is clearly more extended at 0∘ than at 90∘ and a comparison between the two is used to constrain the outflow PA to a range of 193∘ to 208∘ (E of N). Note that, the lines which trace the outflow closest to the source give a slightly larger PA on average than the more displaced line regions (Table 3), although all values agree within the errors. Analysis of the H line reveals no detectable contribution from the outflow. Clearly the H line is coincident with the continuum position at both position angles.
A significant feature is the obvious asymmetry in the outflow as traced by [SII]. The red-shifted lobe is much brighter in [SII]6716,6731 than the blue-shifted and there is a velocity difference of a factor of 2 between the red and the blue lobe. This is especially apparent in the case of the brighter [SII]6731 line at a PA of 0∘ (Figure 7). Although velocity and intensity asymmetries are commonly seen in CTT jets (Hirth et al., 1994) and while several case have been documented where the red-shifted lobe is the faster it is unusual for the red-shifted lobe to be the brightest. In the majority of CTT jets the circumstellar disk obscures the red-shifted flow. The CTTS RW Aur offers the most striking example of such an asymmetry (Hirth et al., 1994; López-Martín et al., 2003). In this case a similar velocity asymmetry has been reported but the slower lobe (red) is the brightest. The ISO-ChaI 217 asymmetry is clearly visible in the PV diagrams presented in Figure 8. For the purpose of the PV diagrams the [SII]6731 line region was smoothed, using an elliptical Gaussian filter. The PV diagrams support the spectro-astrometric analysis as the opposing offset in the line region at 0∘, measured with spectro-astrometry to be 180 mas, is resolved in the corresponding PV plot. In the PV plot at 90∘ the line appears coincident with the source position again consistent with the much smaller offsets measured at this slit position ( 50 mas).
3.2 DENIS-P J160603.9-205644
DENIS-P J160603.9-205644 was identified as a BD as part of a survey of the Upper Scorpius OB association Martín et al. (2004). Mohanty et al. (2005) classify it as an accretor (H 10 width is given as 306 kms-1) and give its spectral type and mass as M7.5 and 40 MJUP. However, no FELs or additonal signatures of outflow activity are found in the spectra of DENIS-P J160603.9-205644. The spectro-astrometric analysis of the H line at 0∘ and 90∘ is shown in Figure 11. While the line profile is asymmetric the emission is coincident with the continuum and therefore must originate at the star. The lack of a spectro-astrometric signal in the H line rules out any complications with spectro-astrometric artifacts. Although DENIS-P J160603.9-205644 is classified as an accretor it is likely that it is the least accreting object in our sample. Mohanty et al. (2005) give upper limits to its mass accretion rate based on the non detection of the Ca II 8662 Å feature. Herczeg et al. (2009) measure for this object at 2.5 10-12 M⊙yr-1 consistent with the upper limits set by Mohanty et al. (2005). Also note that Herczeg et al. (2009) do detect some faint forbidden emission in the spectrum of DENIS-P J160603.9-205644. Their observations were made with LIRIS on Keck I at a spectral resolution of R=1400. Given the relatively high spectral resolution of our observations and the small accretion rate of this object it is not surprising that no detection is made here.
3.3 ISO-Oph 32
Natta et al. (2002) observed this source in the near-infrared and estimated its spectral type and mass at M7.5 and 30-50 MJUP. They also argue that the mid-infrared excess detected in this object is consistent with the presence of an irradiated disk. In a later study Natta et al. (2004) added optical spectra to their near-infrared data. In particular they use the H line as a test of accretion activity. In the both the 0∘ and 90∘, high resolution UVES spectrum presented here the [OI]6300 line is detected at at S/N of just above 4. As the [OI]6363 line is 3.5 times fainter than the [OI]6300 line, it is marginally detected at both PAs and therefore not analysed with spectro-astrometry. The lower critical density lines are below the detection limit in our spectra. As shown in Figure 9 analysis reveals the [OI]6300 line to be offset in a southerly direction to 60 mas at 0∘ and 105 mas at 90∘. The average radial velocity (w.r.t the systemic velocity) of the two lines is 15 kms-1 and comparison of the measured offsets at the orthogonal slit positions constrains the PA of the blue-shifted outflow at 240∘. The systemic velocity of ISO-Oph 32 is taken as +7 kms-1 by Whelan et al. (2005). Again no spectro-astrometric signal is detected in the H line, confirming the origin of the bulk of the emission in the accretion flow.
4 Measuring the Mass Outflow Rate for BD Outflows
Numerous observational studies have constrained the mass outflow rate () in CTTSs at 1-10 of the mass accretion rate (Hartigan et al., 1994; Podio et al., 2006; Garcia Lopez et al., 2008). The ratio between the mass outflow and accretion rates (/) in young stars is a defining characteristic of the mechanism which is at work to launch protostellar outflows (Ferreira et al., 2006; Ray et al., 2007). If a similar ratio between outflow and infall is measured for accreting BDs it will provide compelling evidence that the outflows we are beginning to detect at very low and sub-stellar masses are in fact scaled-down from low mass protostellar outflows. The spectra of low mass protostars contain a wealth of forbidden and permitted lines whose excitation properties are well known. Hence, the ratios and intensities of these lines can be used to probe the physical conditions of the emitting regions. Spectral analysis of known outflow tracers, typically in the optical and near-infrared regimes, has allowed to be estimated for low mass protostars. In comparison, the spectra of young BDs, have been little investigated. It is only in the last number of years that optical FELs have been detected in BD spectra and comparatively little work has been done in the near-infrared.
Two distinct methods have been used to measure in low mass protostars. Here the application of these methods to the problem of measuring mass outflow rates at BD masses, is discussed. The first method (hereafter method A) relies on an estimate of the total density in the outflow , which in turns requires the electron density (ne) and ionisation fraction (xe) to be known (Nisini et al., 2005; Podio et al., 2006). These plasma parameters can be calculated using the Bacciotti Eislöffel (BE) technique (Bacciotti & Eislöffel, 1999a; Bacciotti et al., 1999b). The BE technique employs selected optical transitions of S+, O0 and N+, to derive xe and Te (electron temperature). The electron density is estimated from the ratio of the [SII] lines, [SII]6716/[SII]6731 (Osterbrock, 1994) and once this quantity is known it is combined with xe to derive nH. Podio et al. (2006) adopt the BE technique to study the physical conditions in a sample of protostellar outflows and thus calculate their mass loss rate. As the BE technique calculates Te and xe from the [NII](6548+6583)/[OI](6300+6363) and [SII](6716+6731)/[OI](6300+6363) line ratios, it requires the use of a given set of elemental abundances. Podio et al. (2006) investigate any variations in estimates of xe and Te for four different abundance sets and calculate using,
| (1) |
where =1.41 is the mean atomic weight, mH the mass of a proton, nH the total density and rJ, vJ the jet radius and velocity respectively. Here we firstly discuss the analysis of our BD spectra with the BE technique.
The BE technique is easily applied to the spectrum of a typical CTTS where the required FELs are well resolved spatially and spectrally with a high S/N. The line flux can be measured using several different line fitting techniques. The main source of error comes from the uncertainty in the measurement of the line fluxes which depends on the S/N ratio of the line. In order to use the BE technique to investigate a BD outflow the [OI]6300, [SII]6716, 6731 and [NII]6583 lines must all be detected at a sufficient S/N. The [OI]6363 and [NII]6548 lines can be substituted for the [OI]6300, [NII]6583 lines, if for example the brighter [OI]6300 line is not covered by the spectral range of the instrument or the [NII]6548 is blended with the H line. Both the [OI]6300 and [NII]6548 lines can be exchanged with the fainter line of their pairs, as the ratio of their intensities is always three. This is due to the fact that they come from the same upper level and that the ratio of the A coefficients for spontanoeus emission is three. Of the five BD candidates found so far to have outflows only one, LS-RCrA 1 (outflow discussed in Whelan et al. 2009), meets the requirements of the BE technique. For the two lowest mass BDs, ISO-Oph 32 and 2MASS1207-3932 (Whelan et al., 2007) only the [OI]6300,6363 lines are observed. An added difficulty for 2MASS1207-3932 is that while both the blue and red-shifted lobes of the outflow are detected in the [OI]6300 line they are not well resolved spectrally hence the emission from both lobes cannot be properly separated. While both the [OI]6300,6363 and [SII]6731 lines are found in the spectrum of ISO-Oph 102 (Whelan et al., 2005) the [SII]6716 line is not detected and therefore there is no estimate of ne. Finally for ISO-ChaI 217 , while the [OI]6300 and [SII]6716,6731 lines are all observed the [NII]6548 line is not present and the [NII]6583 line is too faint to allow the use of the BE technique. However, using the ratio of the [SII]6716,6731 lines ne in the blue and red-shifted lobes of the ISO-ChaI 217 outflow is measured (see Table 4).
The results of the application of the BE technique to the blue-shifted outflow driven by LS-RCrA 1 are reported in Table 4. As described in Whelan et al. (2009) UVES spectra of LS-RCrA 1 were taken at several P.As between 45∘ and 82∘ and analysis of this data constrained the PA of the LS-RCrA 1 outflow at 15∘. Using the BE technique ne, xe, Te and nH are derived at each PA. The quoted errors come from the uncertainty in the measurement of the line fluxes. In the case of low mass protostars, values of xe in the range 0.01 - 0.4, Te in the range 8000-20000 K and nH up to 106 cm-3 are typically measured (Ray et al., 2007). The estimates of ne for LS-RCrA 1 and ISO-ChaI 217 are reasonable when compared with estimates made for CTT jets and the large errors (up to 40) are due to the low S/N in the [SII] lines, which is a low as 3 in some cases. Comerón et al. (2003) quoted a value of ne = 2300 cm-3 for LS-RCrA 1. Note that the ISO-ChaI 217 red-shifted outflow has a higher electron density that the blue-shifted which is a further indication of the asymmetry between the two lobes of the outflow. The low S/N of the LS-RCrA 1 [NII]6583 line leads to errors of up to 50 in the derived values of xe and nH. The estimates of xe are very low compared to what one measures for CTTSs and decrease as the slit PA moves away from the outflow PA. In addition, values of Te and nH are very high. With such high densities one would expect more efficient cooling and therefore lower temperatures. The peculiarities in xe, Te and nH noted here have been observed in CTT flows where the very beginning of the flow (02 to 1″) is being tested with BE technique. In the case of the BDs we are probing even closer to the driving source of the outflow. Bacciotti et al. (1999b) argue that the physical reason for this behaviour could be related to the event that creates the ionisation of the flow e.g. a standing shock. While these preliminary results are interesting, it is impossible at present to say if this approach can reveal anything meaningful about the ionisation fraction / electron temperature and thus shocked emission in BD outflows. Higher S/N spectra of a bigger sample of young BD outflows, aimed at resolving the [NII] lines in particular, should be the next step.
The value of nH estimated from the above method is used in Equation 1 to derive . As the slit PA of 45∘ lies closest to the estimated outflow PA (15∘) nH derived for this slit PA is taken. One of the biggest difficulties with measuring for BD outflows is that the outflow width and velocity is not known. Here reasonable estimates of rJ, vJ for LS-RCrA 1 are made. Ray et al. (2007) show a plot of jet width as a function of projected distance from the source. Assuming a similar relationship for a young BD outflow and considering that offsets of up to 150 mas ( 20 AU) have been measured for the LS-RCrA 1 FELs, 10 AU is taken as a reasoned approximation of the radius of the LS-RCrA 1 outflow. This would suggest an opening angle close to 30∘ for this outflow and is likely an upper limit on the outflow radius. The radial velocities of the LS-RCrA 1 FELs are low ( 25kms-1) and at present the inclination angle of the outflow is poorly constrained. Initial observations suggested that the low radial velocity of the FELs and the faintness of the source could be explained by an edge-on accretion disk and thus an outflow inclined close to the plane of the sky. However the lack of red-shifted emission and the evidence for separation between low and high velocity emission in the outflow, presented in Whelan et al. (2009), refute this argument. Assuming that the low radial velocity measured in the outflow tracers suggests a low outflow inclination angle (20-30∘), for the purpose of calculating , vJ is taken at 75 kms-1. Combining nH with rJ and vJ yields = 2.4 10-9 M⊙yr-1.
The second widely used method for measuring (hereafter method B) is based on the observed luminosity of an optically thin line such as [SII] or [OI]. The luminosity of a specific line can be derived as follows (Comerón et al., 2003)
| (2) |
(D is the distance to the object, EW the equivalent width of the line and R0 the dereddened magnitude) and used to evaluate the mass of the flow (in the aperture) according to the following equations (Hartigan et al., 1995),
| (3) |
| (4) |
= MVtan/ltan where nc, Vtan and ltan are the critical density, outflow tangential velocity and the size of the aperture in the plane of the sky. As ne for CTTSs is comparable to the critcal density of [SII]6731 Hartigan et al. (1995) remove the critical density dependence from Equation 4 above. For the BD outflows investigated to date ne nc hence this dependence is included here.
In order to measure and apply the above method to our sources, R0, ne and Vtan must be known. Here we estimate for LS-RCrA 1 , ISO-ChaI 217 and ISO-Oph 102. The values of EW, R0, ne and Vtan used in each case are given in Table 5. For LS-RCrA 1 is measured at 6.1 10-10 M⊙yr-1 and 2.0 10-10 M⊙yr-1 from the [OI]6300 and [SII]6731 lines respectively. Vtan is taken at -43 kms-1. This estimate is based on a radial velocity of 25 kms-1 and an outflow inclination angle of 30∘ (see above). For the ISO-ChaI 217 bipolar outflow we chose to estimate from the [SII]6731 line luminosity. As the outflow is resolved spectrally in the [SII]6731 line (the lobes are blended spectrally in the [OI]6300 line) it was possible to estimate in both lobes of the outflow. For the faster (red-shifted lobe) = 3.1 10-10 M⊙yr-1. This is almost twice the outflow rate of the blue lobe, which is measured at 1.8 10-10 M⊙yr-1. A similar difference in is observed in the two lobes of the RW Aur asymmetric jet Woitas et al. (2002). R0 for ISO-ChaI 217 is taken from the R = 19.59 mag (López Martí et al., 2004) and AJ given by Luhman (2004) as 0.7 mag. As we see the red-shifted component of the ISO-ChaI 217 outflow the outflow likely has a low inclination angle. Radial velocities of -20 kms-1 and 40 kms-1 are measured for the red and blue lobes therefore tangential velocities of -55 kms-1 and 110 kms-1 are assumed for the purpose of this calculation. This is based on an outflow inclination angle of 20∘.
Finally we also apply the method of Hartigan et al. (1995) to the blue-shifted outflow driven by ISO-Oph 102. The [SII]6731 line is detected at a low S/N and its luminosity is estimated at 3.1 10-7 L⊙. As the [SII]6716 line is not detected there is no estimate of ne for the outflow. However, as nc for the [SII]6731 line is closer to the value of ne measured for CTT / BD outflows (than for the [OI]6300 line), Equation 4 is less sensitive to the nc / ne dependence and we can make a reasonable estimate of the possible range of ne for the ISO-Oph 102 outflow. Using a range of 103 cm-3 to 104 cm-3 for ne gives at 1.7-11.8 10-10 M⊙yr-1. A value of Vtan = 78 kms-1 is assumed for this outflow based on the measured radial velocity of its FELs (Whelan et al., 2005) and on a outflow inclination of 30∘. Phan-Bao et al. (2008) estimate the inclination angle of the ISO-Oph 102 disk at 63∘ to 66∘. This suggests that the outflow inclination lies close to 30∘ as assumed. R0 is taken from Natta et al. (2004) where Av is estimated at 3 mag. Note that Phan-Bao et al. (2008) measure = 1.4 10-9 M⊙yr-1 for the ISO-Oph 102 molecular outflow. It is reasonable that for a molecular outflow be greater than the outflow rate in the underlying jet. Assuming that the jet is powering the molecular outflow (Downes & Cabrit, 2007), the mass outflow rate of the molecular component will grow with time as the jet transfers increasing amounts of energy and momentum.
Table 6. compares and for LS-RCrA 1, ISO-ChaI 217 and ISO-Oph 102. As the typical width of a BD outflow is not known but reasonable estimates of outflow velocity can be made from measured radial velocities, method B is more suitable at present as a tool for estimating . An added advantage of method B is that Equation 4 is less sensitive to ne which is useful for cases where ne is not known and the [SII]6731 line alone is detected. Method B has allowed us to limit for all three objects to the range 10-10 to 10-9 M⊙yr-1. Quantities such as jet velocity and electron density must be better constrained in order to tighten this range. While the measured range for is at present equally as large and is of order a few times 10-10 M⊙yr-1 up to of order 10-9, what can be concluded here is that for the BDs in our sample is comparable to . However, some important points to note are as follows. The number of objects in our sample is very small and the standard versus correlation for CTTSs shows a very wide scatter either side of the fitted least squares straight line (Hartigan et al., 1995). Importantly, there may also be some selection effects in our sample. As our observations are difficult and at the edge of what the VLT can do (the [OI]6300 line emission is only just observable), one would therefore tend to pick up only objects with higher outflow rates (brighter [OI] emission) all else being equal. In other words, in the plot (for CTTSs) mentioned above we might be selecting only the brighter (upper) points in the scatter.
Difficulties related to measuring in BDs should also be considered. The most common methods for deriving are based on modelling of lines like H or Pa (Natta et al., 2004), on veiling measurements and on the flux of CaII lines like the CaII8662 (Mohanty et al., 2005). However accretion rate estimates for BDs based on different lines (e.g. Halpha or Ca HK) give very different results (Mohanty et al., 2005). Individual lines (e.g. H) vary on time-scales of weeks (Scholz et al., 2005; Nguyen et al., 2009) and thus the rates measured at a particular epoch may not reflect the long term accretion rate that is more appropriate for comparison with . A second concieveable difficulty with these approaches is posed by any possible contribution to the H or CaII lines from an outflow. For example Whelan et al. (2009) measure a significant contribution to the LS-RCrA 1 outflow in the wings of the H line. Overall, further investigation is needed to confirm if in BDs a larger fraction of infalling material is re-ejected in an outflow than in low mass stars. One theory of BD formation is that they originate from cores that never accrete enough material to enter a H burning phase. A mass outflow rate which is a significant fraction of the infall rate could account for this. Future work on measuring for young BD outflows should focus on increasing the number of objects known to have outflows, on obtaining better quality spectra and on imaging studies to allow outflow width and velocity to be derived. This work would also benefit from expansion into the NIR regime (Podio et al., 2006).
| Object | Slit PA (∘) | ne (cm-3) | xe | Te (103 K) | nH (105 cm-3) |
|---|---|---|---|---|---|
| LS-RCrA 1 | 45 | 1478 ( 170) | 0.012 ( 0.005) | 35 ( 1) | 1.2 ( 0.7) |
| 63 | 1300 ( 140) | 0.004 ( 0.002) | 37 ( 2) | 3.3 ( 2.0) | |
| 74 | 1300 ( 120) | 0.002 ( 0.001) | 41 ( 1) | 6.7 ( 2.3) | |
| 82 | 1500 ( 200) | 0.002 ( 0.001) | 44 ( 3) | 8.6 ( 2.7) | |
| ISO-ChaI 217 | 0 B | 1900 ( 700) | – | – | – |
| 0 R | 5700 ( 2300) | – | – | – | |
| 90 B | 600 ( 200) | – | – | – | |
| 90 R | 2100 ( 600) | – | – | – |
| LS-RCrA 1 | ISO-ChaI 217 (red) | ISO-ChaI 217 (blue) | ISO-Oph 102 | |
|---|---|---|---|---|
| EW [OI]6300 (Å) | -30.0 | - | - | -2 |
| EW [SII]6731 (Å) | -6.4 | -0.7 | -0.3 | -0.2 |
| R0 | 19.2∗ | 16.59 | 16.59 | 14.57 |
| L [OI]6300 (L⊙) | 7.1 10-7 | - | - | 3.1 10-6 |
| L [SII]6731 (L⊙) | 1.4 10-7 | 2.1 10-7 | 9.1 10-8 | 3.1 10-7 |
| ne (cm-3) | 1300 | 3900 | 1250 | 103 -104 |
| i (∘) | 30 | 20 | 20 | 30 |
| Vtan (kms-1) | 43 | 55 | 110 | 78 |
| D (pc) | 130 | 140 | 140 | 125 |
| ltan (″) | 1.2 | 1 | 1 | 1 |
| Object | (M⊙yr-1) | Method |
|---|---|---|
| LS-RCrA 1 | ||
| 2.4 10-9 | A | |
| 6.1 10-10 | B [OI]6300 | |
| 2.0 10-10 | B [SII]6731 | |
| ISO-Oph 102 | ||
| 1.7-11.8 10-10 | B [SII]6731 | |
| 1.4 10-9 | CO molecular outflow1 | |
| ISO-ChaI 217 Red flow | ||
| 3.1 10-10 | B [SII]6731 | |
| ISO-ChaI 217 Blue flow | ||
| 1.8 10-10 | B [SII]6731 |
| Object | (M⊙yr-1) | Method |
|---|---|---|
| LS-RCrA 1 | ||
| 2.8 10-10 | CaII(8542)2 | |
| 10-10-10-9 | Optical Veiling3 | |
| 10-9 | CaII(8662)4 | |
| 10-10 | H 10 width5 | |
| ISO-Oph 102 | ||
| 10-9 | H 10 width6 | |
| 4.3 10-10 | J and K band spectra7 | |
| ISO-ChaI 217 | ||
| 1.0 10-10 | H emission8 |
5 Classical T Tauri-like Outflow Activity in the Brown Dwarf Mass Regime
Much of what is now known about the launching of protostellar jets comes from investigating the FEL regions of CTTSs. The first long-slit spectroscopic studies allowed their morphology, kinematics and position angle to be studied (Hirth et al., 1997) and progress in this area has been driven by high angular resolution techniques (Ray et al., 2007). A notable feature of the FEL regions of CTTSs is that they often have two velocity components, a low velocity component (LVC) believed to trace a wide disk wind and a high velocity component (HVC) tracing the jet. Currently, the scale over which jets are collimated, the jet rotation, the jet excitation conditions and mass outflow rate are all estimated from their FEL regions (Ray et al., 2007). While the distinctive FEL profiles associated with outflow activity were first studied in the spectra of CTTSs (Hirth et al., 1997), Class I low mass protostars and Herbig Ae/Be stars are now also known to show strong FE. Studies have compared the FEL regions of the above objects to those of the CTTSs (Boehm & Catala, 1994; Corcoran & Ray, 1998; Davis et al., 2003; Garcia Lopez et al., 2008). The earliest studies which identified FEL tracers of mass outflow in the spectra of BDs include Fernández & Comerón (2001) and Barrado y Navascués et al. (2004). Whelan et al. (2007) presented evidence which supported the hypothesis that BD outflows are scaled-down from CTT outflows. Here recent new evidence is summarised. As all the BDs investigated to date are optically visible it is assumed that they are the substellar mass counterparts to the CTTSs i.e. equivalent to Class II low mass sources.
For the five BDs whose FEL spectra have been investigated to date the [OI]6300 line is the dominant line. The [SII]6731 line is detected in three cases (LS-RCrA 1, ISO-ChaI 217 and ISO-Oph 102) and only for LS-RCrA 1 is the [NII]6583 line detected at a reasonable S/N. Very faint [NII]6583 emission is found in the spectrum of ISO-ChaI 217. Interestingly for LS-RCrA 1 Whelan et al. (2009) detected both the blue and red-shifted outflow in the wings of the H line. This was the first time H was shown to originate in a BD outflow. As only blue-shifted FE is found this points to a dust hole in the LS-RCrA 1 disk, of an estimated size of 7AU (refer to Whelan et al 2009 for further information). Spectro-astrometric studies of permitted emission lines have led to similar discoveries for the disk of CTTSs (Whelan et al., 2004; Takami et al., 2001). This is an important parallel between the disk-outflow systems of BDs and CTTSs.
A second striking parallel between outflow activity in BDs and CTTSs is offered by the emergence of evidence of a LVC to BD FELs. Again this comes from the recent study of LS-RCrA 1. Although the LVC and HVC are not resolved spectrally for the LS-RCrA 1 FELs, Whelan et al. (2009) argue that the large spread in radial velocity with the [OI]6300 line having the lowest velocity (-5 kms-1) and the [NII]6583 line the highest (-22 kms-1 with a wing extending to -75 kms-1) makes it clear that the [OI]6300 line is predominantly tracing a LVC component to the outflow and the [NII]6583 line the HVC. The [SII]6731 line shows evidence of both a LVC and a HVC. In the case of ISO-Oph 32 the low radial velocity of the [OI]6300 emission line is also suggestive of the presence of a LVC to the outflow driven by this BD. An explanation for the low velocity based on a edge-on disk scenario is less likely given the lack of red-shifted emission (the 2MASS1207-3932 FELs also have low radial velocities but both blue and red-shifted emission is seen) hence it is likely that the [OI]6300 line has a strong contribution from a LVC. The confirmation of a LVC to BD outflows would makes it very likely that many of the same processes active in the launching region of BDs and CTTSs and thus strongly links BD and protostellar outflows. However a large sample of young BDs must be investigated to obtain this confirmation.
As asymmetries are frequently observed in CTT outflows a third compelling piece of evidence supporting the continuation of CTT-like outflow activity into the BD regime, is the asymmetrical nature of the ISO-ChaI 217 outflow. Hirth et al. (1994) first reported asymmetries in the jets driven by the CTTS RW Aur and DO Tau. For RW Aur the brighter red-shifted lobe has a radial velocity a factor of 2 slower than the blue-shifted lobe. In the case of DO Tau, while the blue-shifted lobe is the brightest it is slower than the red-shifted flow by a factor of 2.3. In addition, the results of Hirth et al. (1994) reveal a difference in the electron density between both lobes of the flows. For RW Aur ne is higher in the red lobe than the blue, however, for DO Tau the brighter lobe has the lowest electron density. Hirth et al. (1994) also list several other protostars for whom radial velocity asymmetries have been reported highlighting that this is a common feature of protostellar outflows. The discovery of such strong asymmetries so close to the driving source is important as it shows that these asymmetries are intrinsic to the central engine and suggests that their origin is in the jet launching mechanism itself. Ferreira et al. (2006) also discuss the origin of asymmetries in CTT jets. The asymmetries in the FELs of ISO-ChaI 217 are remarkably similar to what has been well studied for RW Aur. In the spectra taken at both 0∘ and 90∘ the radial velocity of the red-shifted component is a factor of 2 higher than that of the blue-shifted lobe, the red-shifted lobe is brighter and initial results suggest that the electron density of the red-shifted flow is also higher. Spectra taken along the actual outflow PA (estimated here at 200∘) would allow a more detailed investigation of the ISO-ChaI 217 outflow asymmetries.
Finally we consider the existing evidence that BD outflows also have a molecular component. Although early observations of CTT jets concentrated on the optical regime observations now extend into the near-infrared (Davis et al., 2003; Beck et al., 2008). Takami et al. (2004) first reported a detection of a warm molecular component to the DG Tau jet (observed in the H2, v=1-0 S(1) line) and observations of H2 in the spectra of CTTSs are now not unusual. Note however that shocked H2 emission in outflows is much more common where a source is in the embedded phase, i.e. Class 0 - I (Davis et al., 2001). While there has been very little investigation of BD outflow activity in the NIR, LS-RCrA 1 is known to show strong H2 emission at 2.122 m (Fernández & Comerón, 2001). A recent significant discovery in the field of BD outflows is the observation of a CO J = 2 -1 molecular outflow driven by ISO-Oph 102 (Phan-Bao et al., 2008). ISO-Oph 102 was the first BD shown by us to drive an outflow (Whelan et al., 2005). Blue-shifted FE was detected in its optical spectrum and found to be offset in a southerly direction. Phan-Bao et al. (2008) used the sub-millimeter array (SMA) to observe a small-scale molecular outflow driven by ISO-Oph 102. The total scale of the outflow is 20″ and it is aligned at a N-S PA. CTTSs are optically visible and therefore no longer embedded in their natal material. It is argued that molecular outflows originate as circumstellar material is entrained and driven outwards by an underlying jet (Downes & Cabrit, 2007), therefore the most spectacular protostellar molecular outflows are driven by embedded protostars such as Class 0 or Class I low mass stars (Arce et al., 2007). CO outflows are driven by the youngest CTTSs (Launhardt et al., 2009) and observations are rare. The existence of a molecular component to BD outflows is a fourth noteworthy similarity between BD and low mass protostellar outflows.
6 Summary
Currently our understanding of astrophysical outflows is focussed on observations of low mass protostellar objects. Although much can be gleaned from such observations a proper appreciation of the outflow phenomenon can only be reached through a complete investigation of how outflow activity compares for a range of driving sources, varying in mass and age. The new results included in this paper include the presentation of two new BD outflows, the unusual red-shifted asymmetry in the ISO-ChaI 217 and the demonstration that in BDs is comparable to . Overall, the main aim of our BD project is to explore how substellar outflow activity compares to what is well documented for low mass protostars. As our sources are all optically visible our comparison is focussed on the CTTSs. A second advantage of this work is that it may add to the debate on the formation mechanism of BDs i.e. whether they form like low mass protostars or are ejected embryos from multiple systems. The later mechanism is thought to produce truncated disks and very little envelope. If BD outflows are long-lived this would argue against such a scenario although further investigation is required.
Due to the faintness of the BD outflows observations are difficult and time consuming. However data gathered to date has led to some significant results. The most compelling pieces of evidence which support the continuation of CTT-like outflow activity into the BD mass regime include, the detection of an outflow component to the LS-RCrA 1 H emission line and the suggestion of a possible disk dust hole, the identification of an LVC to the FELs of LS-RCrA 1 and ISO-Oph 32, the strong asymmetry in the ISO-ChaI 217 outflow and the discovery of a molecular component to the optical outflows of LS-RCrA 1 and ISO-Oph 102.
While these results are significant much further work is needed to provide a more complete picture of how BD and CTT outflows compare. This is especially true for any study of the physical conditions in BD outflows and BD mass outflow rates. A considerably increased sample is needed. This can be provided through further optical and NIR spectroscopic studies complemented by millimetre studies. Investigations must be extended to other wavelength regimes so that NIR atomic and molecular outflow tracers can be identified and further CO outflows found. Finally optical/NIR images would allow the collimation of the BD outflows to be probed. Many of these projects are under-way or planned however due to faintness of the emission from a typical BD outflows, it is likely that long-slit/echelle spectroscopy combined with spectro-astrometry will remain (in the short-term at least) the most effective way to investigate BD outflow activity.


References
- Andre et al. (1993) Andre, P., Ward-Thompson, D., & Barsony, M. 1993, ApJ, 406, 122
- Arce et al. (2007) Arce, H. G., Shepherd, D., Gueth, F., Lee, C.-F., Bachiller, R., Rosen, A., & Beuther, H. 2007, Protostars and Planets V, 245
- Apai et al. (2005) Apai, D., Pascucci, I., Bouwman, J., Natta, A., Henning, T., & Dullemond, C. P. 2005, Science, 310, 834
- Bacciotti & Eislöffel (1999a) Bacciotti, F., & Eislöffel, J. 1999, A&A, 342, 717
- Bacciotti et al. (1999b) Bacciotti, F., Eislöffel, J., & Ray, T. P. 1999, A&A, 350, 917
- Barrado y Navascués et al. (2004) Barrado y Navascués, D., Mohanty, S., & Jayawardhana, R. 2004, ApJ, 604, 284
- Bary et al. (2008) Bary, J. S., Weintraub, D. A., Shukla, S. J., Leisenring, J. M., & Kastner, J. H. 2008, ApJ, 678, 1088
- Beck et al. (2008) Beck, T. L., McGregor, P. J., Takami, M., & Pyo, T.-S. 2008, ApJ, 676, 472
- Boehm & Catala (1994) Boehm, T., & Catala, C. 1994, A&A, 290, 167
- Camenzind (2005) Camenzind, M. 2005, Memorie della Societa Astronomica Italiana, 76, 98
- Comerón et al. (2003) Comerón, F., Fernández, M., Baraffe, I., Neuhäuser, R., & Kaas, A. A. 2003, A&A, 406, 1001
- Comerón & Reipurth (2006) Comerón, F., & Reipurth, B. 2006, A&A, 458, L21
- Corcoran & Ray (1998) Corcoran, M., & Ray, T. P. 1998, A&A, 331, 147
- Davis et al. (2003) Davis, C. J., Whelan, E., Ray, T. P., & Chrysostomou, A. 2003, A&A, 397, 693
- Davis et al. (2001) Davis, C. J., Ray, T. P., Desroches, L., & Aspin, C. 2001, MNRAS, 326, 524
- Dekker et al. (2000) Dekker, H., D’Odorico, S., Kaufer, A., Delabre, B., & Kotzlowski, H. 2000, Proc. SPIE, 4008, 534
- Dougados et al. (2000) Dougados, C., Cabrit, S., Lavalley, C., & Ménard, F. 2000, A&A, 357, L61
- Downes & Cabrit (2007) Downes, T. P., & Cabrit, S. 2007, A&A, 471, 873
- Fendt & Zinnecker (1998) Fendt, C., & Zinnecker, H. 1998, A&A, 334, 750
- Ferreira et al. (2006) Ferreira, J., Dougados, C., & Cabrit, S. 2006, A&A, 453, 785
- Fernández & Comerón (2001) Fernández, M., & Comerón, F. 2001, A&A, 380, 264
- Fernández & Comerón (2005) Fernández, M., & Comerón, F. 2005, A&A, 440, 1119
- Garcia Lopez et al. (2008) Garcia Lopez, R., Nisini, B., Giannini, T., Eislöffel, J., Bacciotti, F., & Podio, L. 2008, A&A, 487, 1019
- Gatti et al. (2006) Gatti, T., Testi, L., Natta, A., Randich, S., & Muzerolle, J. 2006, A&A, 460, 547
- Gizis (2002) Gizis, J. E. 2002, ApJ, 575, 484
- Hartigan et al. (1994) Hartigan, P., Morse, J. A., & Raymond, J. 1994, ApJ, 436, 125
- Hartigan et al. (1995) Hartigan, P., Edwards, S., & Ghandour, L. 1995, ApJ, 452, 736
- Herczeg et al. (2009) Herczeg, G. J., Cruz, K. L., & Hillenbrand, L. A. 2009, ApJ, 696, 1589
- Hirth et al. (1997) Hirth, G. A., Mundt, R., & Solf, J. 1997, A&AS, 126, 437
- Hirth et al. (1994) Hirth, G. A., Mundt, R., Solf, J., & Ray, T. P. 1994, ApJ, 427, L99
- Jayawardhana et al. (2003a) Jayawardhana, R., Mohanty, S., & Basri, G. 2003, ApJ, 592, 282
- Jayawardhana et al. (2003b) Jayawardhana, R., Ardila, D. R., Stelzer, B., & Haisch, K. E., Jr. 2003, AJ, 126, 1515
- James et al. (2006) James, D. J., Melo, C., Santos, N. C., & Bouvier, J. 2006, A&A, 446, 971
- Lada (1987) Lada, C. J. 1987, Star Forming Regions, 115, 1
- Launhardt et al. (2009) Launhardt, R., et al. 2009, A&A, 494, 147
- López-Martín et al. (2003) López-Martín, L., Cabrit, S., & Dougados, C. 2003, A&A, 405, L1
- López Martí et al. (2004) López Martí, B., Eislöffel, J., Scholz, A., & Mundt, R. 2004, A&A, 416, 555
- Luhman et al. (2000) Luhman, K. L., Rieke, G. H., Young, E. T., Cotera, A. S., Chen, H., Rieke, M. J., Schneider, G., & Thompson, R. I. 2000, ApJ, 540, 1016
- Luhman (2004) Luhman, K. L. 2004, ApJ, 602, 816
- Luhman et al. (2005) Luhman, K. L., Fazio, G., Megeath, T., Hartmann, L., & Calvet, N. 2005, Memorie della Societa Astronomica Italiana, 76, 285
- Martín et al. (2004) Martín, E. L., Delfosse, X., & Guieu, S. 2004, AJ, 127, 449
- Masciadri & Raga (2004) Masciadri, E., & Raga, A. C. 2004, ApJ, 615, 850
- Mohanty et al. (2003) Mohanty, S., Jayawardhana, R., & Barrado y Navascués, D. 2003, ApJ, 593, L109
- Mohanty et al. (2004) Mohanty, S., Jayawardhana, R., & Basri, G. 2004, ApJ, 609, 885
- Mohanty et al. (2005) Mohanty, S., Jayawardhana, R., & Basri, G. 2005, ApJ, 626, 498
- Mohanty et al. (2007) Mohanty, S., Jayawardhana, R., Huélamo, N., & Mamajek, E. 2007, ApJ, 657, 1064
- Mundt & Fried (1983) Mundt, R., & Fried, J. W. 1983, ApJ, 274, L83
- Muzerolle et al. (2003) Muzerolle, J., Hillenbrand, L., Calvet, N., Briceño, C., & Hartmann, L. 2003, ApJ, 592, 266
- Muzerolle et al. (2005) Muzerolle, J., Luhman, K. L., Briceño, C., Hartmann, L., & Calvet, N. 2005, ApJ, 625, 906
- Natta & Testi (2001) Natta, A., & Testi, L. 2001, A&A, 376, L22
- Natta et al. (2002) Natta, A., Testi, L., Comerón, F., Oliva, E., D’Antona, F., Baffa, C., Comoretto, G., & Gennari, S. 2002, A&A, 393, 597
- Natta et al. (2004) Natta, A., Testi, L., Muzerolle, J., Randich, S., Comerón, F., & Persi, P. 2004, A&A, 424, 603
- Natta et al. (2006) Natta, A., Testi, L., & Randich, S. 2006, A&A, 452, 245
- Nguyen et al. (2009) Nguyen, D. C., Scholz, A., van Kerkwijk, M. H., Jayawardhana, R., & Brandeker, A. 2009, ApJ, 694, L153
- Nisini et al. (2005) Nisini, B., Bacciotti, F., Giannini, T., Massi, F., Eislöffel, J., Podio, L., & Ray, T. P. 2005, A&A, 441, 159
- Osterbrock (1994) Osterbrock, D.E., Astrophysics of Gaseous Nebulae and Active Galactic Nuclei, Mill Valley: University Science Book (1994)
- Pascucci et al. (2009) Pascucci, I., Apai, D., Luhman, K., Henning, T., Bouwman, J., Meyer, M. R., Lahuis, F., & Natta, A. 2009, ApJ, 696, 143
- Persi et al. (2000) Persi, P., et al. 2000, A&A, 357, 219
- Phan-Bao et al. (2008) Phan-Bao, N., et al. 2008, ApJ, 689, L141
- Podio et al. (2006) Podio, L., Bacciotti, F., Nisini, B., Eislöffel, J., Massi, F., Giannini, T., & Ray, T. P. 2006, A&A, 456, 189
- Podio et al. (2008) Podio, L., Garcia, P. J. V., Bacciotti, F., Antoniucci, S., Nisini, B., Dougados, C., & Takami, M. 2008, A&A, 480, 421
- Ray et al. (2007) Ray, T., Dougados, C., Bacciotti, F., Eislöffel, J., & Chrysostomou, A. 2007, Protostars and Planets V, 231
- Reipurth & Bally (2001) Reipurth, B., & Bally, J. 2001, ARA&A, 39, 403
- Solf & Boehm (1993) Solf, J., & Boehm, K. H. 1993, ApJ, 410, L31
- Scholz et al. (2005) Scholz, A., Jayawardhana, R., & Brandeker, A. 2005, ApJ, 629, L41
- Scholz & Jayawardhana (2006) Scholz, A., & Jayawardhana, R. 2006, ApJ, 638, 1056
- Scholz et al. (2007) Scholz, A., Jayawardhana, R., Wood, K., Meeus, G., Stelzer, B., Walker, C., & O’Sullivan, M. 2007, ApJ, 660, 1517
- Stahler (1983) Stahler, S. W. 1983, ApJ, 274, 822
- Takami et al. (2001) Takami, M., Bailey, J., Gledhill, T. M., Chrysostomou, A., & Hough, J. H. 2001, MNRAS, 323, 177
- Takami et al. (2002) Takami, M., Chrysostomou, A., Bailey, J., Gledhill, T. M., Tamura, M., & Terada, H. 2002, ApJ, 568, L53
- Takami et al. (2004) Takami, M., Chrysostomou, A., Ray, T. P., Davis, C., Dent, W. R. F., Bailey, J., Tamura, M., & Terada, H. 2004, A&A, 416, 213
- Whelan et al. (2004) Whelan, E. T., Ray, T. P., & Davis, C. J. 2004, A&A, 417, 247
- Whelan et al. (2005) Whelan, E. T., Ray, T. P., Bacciotti, F., Natta, A., Testi, L., & Randich, S. 2005, Nature, 435, 652
- Whelan et al. (2006) Whelan, E. T., Ray, T. P., Bacciotti, F., & Jayawardhana, R. 2006, New Astronomy Review, 49, 582
- Whelan et al. (2007) Whelan, E. T., Ray, T. P., Randich, S., Bacciotti, F., Jayawardhana, R., Testi, L., Natta, A., & Mohanty, S. 2007, ApJ, 659, L45
- Whelan & Garcia (2008) Whelan, E., & Garcia, P. 2008, Lecture Notes in Physics, Berlin Springer Verlag, 742, 123
- Whelan et al. (2009) Whelan, E. T., Ray, T. P., & Bacciotti, F. 2009, ApJ, 691, L106
- Woitas et al. (2002) Woitas, J., Ray, T. P., Bacciotti, F., Davis, C. J., & Eislöffel, J. 2002, ApJ, 580, 336