A Physical Model for 2 Dust-Obscured Galaxies††thanks: This paper is dedicated to the original DOG himself, Cordozar Calvin Broadus, Jr.
Abstract
We present a physical model for the origin of 2 Dust-Obscured Galaxies (DOGs), a class of high-redshift ULIRGs selected at 24 µm which are particularly optically faint (). By combining -body/SPH simulations of high redshift galaxy evolution with 3D polychromatic dust radiative transfer models, we find that luminous DOGs (with mJy at ) are well-modeled as extreme gas-rich mergers in massive ( M☉) halos, with elevated star formation rates ( M☉yr-1) and/or significant AGN growth ( M☉yr-1), whereas less luminous DOGs are more diverse in nature. At final coalescence, merger-driven DOGs transition from being starburst dominated to AGN dominated, evolving from a “bump” to a power-law shaped mid-IR (IRAC) spectral energy distribution (SED). After the DOG phase, the galaxy settles back to exhibiting a “bump” SED with bluer colors and lower star formation rates. While canonically power-law galaxies are associated with being AGN-dominated, we find that the power-law mid-IR SED can owe both to direct AGN contribution, as well as to a heavily dust obscured stellar bump at times that the galaxy is starburst dominated. Thus power-law galaxies can be either starburst or AGN dominated. Less luminous DOGs can be well-represented either by mergers, or by massive (M☉ ) secularly evolving gas-rich disc galaxies (with SFR M☉yr-1). By utilising similar models as those employed in the SMG formation study of Narayanan et al. (2010), we investigate the connection between DOGs and SMGs. We find that the most heavily star-forming merger driven DOGs can be selected as Submillimetre Galaxies (SMGs), while both merger-driven and secularly evolving DOGs typically satisfy the BzK selection criteria. The model SEDs from the simulated galaxies match observed data reasonably well, though Mrk 231 and Arp 220 templates provide worse matches. Our models provide testable predictions of the physical masses, dust temperatures, CO line widths and location on the - relation of DOGs. Finally, we provide public SED templates derived from these simulations.
keywords:
cosmology:theory–galaxies:formation–galaxies:high-redshift–galaxies:starburst–galaxies:ISM–galaxies:ISM–ISM:dust1 Introduction
Redshift 2 is a rich epoch for understanding galaxy formation and evolution. During this time period, the bulk of the cosmic stellar mass was assembled (Dickinson et al., 2003; Rudnick et al., 2006), and the star formation rate and quasar space densities are both near their peaks (Bouwens et al., 2004; Hopkins, 2004; Hopkins et al., 2007; Shaver et al., 1996).
In the local Universe, infrared (IR) selection of galaxies is an efficient means of selecting galaxies undergoing significant star formation (e.g., Arp 220), and possibly hosting optically-obscured active galactic nuclei (AGN; e.g., Mrk 231, NGC 6240). By analogy, at higher redshifts, IR selection techniques select galaxies which are major contributors to the cosmic star formation rate density, far-IR background, and progenitors of the present-day massive galaxy population. Indeed, ultraluminous infrared galaxies (ULIRGs; LIR 1012 L☉) at 2 appear to contribute substantially to the infrared luminosity density (Pérez-González et al., 2005; Caputi et al., 2007; Reddy et al., 2008; Hopkins et al., 2010; Hopkins & Hernquist, 2010), and the 0.7 star formation rate density (Le Floc’h et al., 2005; Shi et al., 2009).
A well-studied sample of galaxies selected for their FIR properties at 2 are Submillimetre Galaxies (SMGs), chosen in blank field surveys for their redshifted cool dust emission at 850 µm above 5 mJy. These galaxies are in a transient starburst phase (e.g., Swinbank et al., 2004; Menéndez-Delmestre et al., 2007; Younger et al., 2008a; Michałowski et al., 2009), host rapidly growing supermassive black holes (e.g., Alexander et al., 2005; Alexander et al., 2008), and reside in extremely massive 51012 M☉ halos (Blain et al., 2004). While these galaxies represent an important sub-population of infrared-luminous galaxies at the epoch of peak galaxy formation, there is some concern that a selection at 850 µm may be missing significant populations of high-redshift ULIRGs with warmer dust temperatures (e.g., Bussmann et al., 2009; Chapman & Casey, 2009; Casey et al., 2009; Huang et al., 2009; Younger et al., 2009). As such, alternative selection techniques for identifying 2 ULIRGs have become desirable.
With the launch of the Spitzer Space Telescope, surveys at 24 µm have uncovered a population of ULIRGs at 2 (e.g., Rigby et al., 2004; Donley et al., 2007; Yan et al., 2007; Farrah et al., 2008; Soifer et al., 2008; Lonsdale et al., 2009; Huang et al., 2009, and references therein). Recently, Dey et al. (2008, hereafter, D08; see also ()) presented an efficient means of identifying high-redshift ULIRGs which are both mid-infrared luminous and optically faint. Specifically, by imposing a nominal selection criteria of -[24] 14 (roughly corresponding to a flux density ratio / 1000; formally /) and 0.3 mJy, D08 found a sample of ULIRGs with a relatively narrow redshift distribution (centered at =1.99 with =0.5) which exhibit heavy reddening of the intrinsic UV flux and strong rest-frame 8 µm emission (Houck et al., 2005; Fiore et al., 2008). D08 refer to these galaxies as Dust-Obscured Galaxies (DOGs)111We note that while this paper nominally focuses on 24 µm-selected galaxies which additionally have 24/, the results of this paper are generally applicable to the 24 µm-bright (mJy) 2 ULIRG population..
DOGs exhibit a range of luminosities, though AGN-dominated galaxies tend to preferentially dominate the bright end of the 24 µm flux density distribution (Brand et al., 2006; Weedman et al., 2006a, b; Dey et al., 2008; Fiore et al., 2008; Fiore et al., 2009; Sacchi et al., 2009). The DOGs with the highest 24 µm flux densities ( 0.8 mJy) have bolometric infrared luminosities (LIR) 1013 L☉ (Bussmann et al., 2009; Tyler et al., 2009). As a population, the subset of mJy galaxies which are also DOGs contribute around a quarter of the total infrared luminosity density at 2 (Dey et al., 2008), and constitute 60% of the total contribution by 2 ULIRGs. It is clear that DOGs are a cosmologically significant population of galaxies with diverse observational characteristics.
Broadly, 24 µm-selected ULIRGs at 2 (including DOGs) appear to fall into two categories based on their mid-IR IRAC SEDs: those with a power-law shape and those which exhibit a bump at observed µm corresponding to the 1.6 µm rest frame stellar photospheric bump (hereafter, these are referred to as PL galaxies and bump galaxies, respectively). Bump galaxies are thought to be dominated by star formation, with the bump (at rest-frame 1.6 µm) originating from starlight. PL galaxies are thought to have their mid-IR SED dominated by AGN continuum emission (Weedman et al., 2006b; Donley et al., 2007; Yan et al., 2007; Murphy et al., 2009). In support of this scenario, PL galaxies have SEDs which are reasonably represented by that of a Mrk 231 template (Bussmann et al., 2009; Tyler et al., 2009), and tend to show relatively compact optical morphologies ( kpc; Melbourne et al., 2008, 2009; Bussmann et al., 2009). On the other hand, bump galaxies are typically polycyclic aromatic hydrocarbon (PAH)-rich, show PAH equivalent widths consistent with being star formation dominated (Yan et al., 2005; Sajina et al., 2007; Farrah et al., 2008; Desai et al., 2009; Huang et al., 2009), and are more often morphologically resolved into multiple components (Bussmann et al., 2009). However, Fiore et al. (2008); Fiore et al. (2009) have argued that even these less luminous galaxies may harbor heavily obscured AGN.
DOGs are massive galaxies, with stellar masses 1010-11 M☉ (Bussmann et al., 2009; Lonsdale et al., 2009; Huang et al., 2009), and cluster in group-sized halos of order ( M☉; Brodwin et al., 2008). The clustering is luminosity-dependent, with more luminous DOGs inhabiting more massive halos. Since the more luminous DOGs also tend to exhibit power-law SEDs, it follows that PL DOGs cluster more strongly than the lower luminosity bump DOGs.
Although much progress has been made in understanding DOGs in a relatively short time period, a myriad of fundamental questions regarding their physical nature exist. Are DOGs preferentially isolated galaxies or mergers (or both)? Does the 24/ criterion select galaxies at a particular evolutionary point? How are bump DOGs and PL DOGs related - are they distinct galaxy populations, or possibly related via an evolutionary sequence? How are DOGs related to other coeval high-redshift populations (e.g., the SMGs, BzK galaxies, etc.)?
Numerical simulations can offer complementary information to the observations in hand, and provide insight into the aforementioned questions. In particular, by coupling radiative transfer modeling with hydrodynamic simulations of galaxy evolution, one can precisely mimic local and high-redshift observational selection functions, and directly relate observed trends to physical conditions in the model galaxies (e.g., Jonsson, 2006; Jonsson et al., 2006; Jonsson et al., 2010; Lotz et al., 2008; Narayanan et al., 2010; Younger et al., 2009).
Previously, we have utilised similar methods to investigate the formation and evolution of high-redshift Submillimetre Galaxies Narayanan et al. (2009, 2010, C. Hayward et al. in prep.). Here, we build upon these efforts by utilising similar models as those employed in Narayanan et al. (2009) and Narayanan et al. (2010). This will allow us not only to investigate a potential formation mechanism for DOGs, but to explore the potential connection between 2 ULIRGs selected for their 24 µm brightness, and those selected in the submillimetre.
The paper is organised as follows. In § 2, we detail our numerical methods. In § 3, we describe the formation of 2 DOGs, and explain the evolution of the 24/R ratio and the relationship between bump and PL DOGS. In § 4, we discuss the physical requirements necessary to form a DOG, and whether mergers are necessary; In § 5, we detail the relationship between DOGs, SMGs and BzK galaxies. In § 6, we relate our model to existing observations, and make testable predictions. In § 7, we provide discussion. We conclude in § 8.
Throughout this paper, we utilise a fiducial DOG selection criteria 24/ 1000 and 300 Jy, consistent with the DOGs sample in D08. We note again that while we focus on these 24 µm selected galaxies which are optically faint (DOGs), the results are generally applicable to most 24 µm-selected 2 ULIRGs. Throughout, we assume a cosmology with , and . Finally, we note that the models presented here are not cosmological in nature. As such, all non-evolutionary plots should be taken to represent ranges of expected values and colors, rather than true expected distributions.
| Model | Vc | Mass Ratio | |||||||
| (km s-1) | M☉ | M☉ | |||||||
| DOG1 | 500:500 | 1.251013:1.251013 | 1.11012 | 1:1 | 30 | 60 | -30 | 45 | 0.8,0.6,0.4 |
| DOG2 | 500:500 | 1.251013:1.251013 | 1.11012 | 1:1 | 360 | 60 | 150 | 0 | 0.8 |
| DOG3 | 500:500 | 1.251013:1.251013 | 1.11012 | 1:1 | -109 | -30 | 71 | -30 | 0.8 |
| DOG4 | 500:320 | 1.251013:3.41012 | 6.91011 | 1:3 | 30 | 60 | -30 | 45 | 0.8,0.6,0.4 |
| DOG5 | 500:320 | 1.251013:3.41012 | 6.91011 | 1:3 | 360 | 60 | 150 | 0 | 0.8 |
| DOG6 | 500:320 | 1.251013:3.41012 | 6.91011 | 1:3 | -109 | -30 | 71 | -30 | 0.8 |
| DOG7 | 500:225 | 1.251013:1.21012 | 6.01011 | 1:10 | 30 | 60 | -30 | 45 | 0.8,0.6,0.4 |
| DOG8 | 500:225 | 1.251013:1.21012 | 6.01011 | 1:10 | 360 | 60 | 150 | 0 | 0.8 |
| DOG9 | 500:225 | 1.251013:1.21012 | 6.01011 | 1:10 | -109 | -30 | 71 | -30 | 0.8 |
| DOG10 | 320:320 | 3.41012:3.41012 | 2.91011 | 1:1 | 30 | 60 | -30 | 45 | 0.8,0.6,0.4 |
| DOG11 | 320:320 | 3.41012:3.41012 | 2.91011 | 1:1 | 360 | 60 | 150 | 0 | 0.8 |
| DOG12 | 320:320 | 3.41012:3.41012 | 2.91011 | 1:1 | -109 | -30 | 71 | -30 | 0.8 |
| DOG13 | 225:225 | 1.21012:1.21012 | 1.01011 | 1:1 | 30 | 60 | -30 | 45 | 0.8,0.6,0.4 |
| iDOG1 | 500 | 1.251013 | 5.51011 | — | N/A | N/A | N/A | N/A | 0.8,0.6,0.4 |
| iDOG2 | 320 | 3.41012 | 1.51011 | — | N/A | N/A | N/A | N/A | 0.8,0.6,0.4 |
| iDOG3 | 225 | 1.21012 | 51010 | — | N/A | N/A | N/A | N/A | 0.8,0.6,0.4 |
2 Numerical Methods
Our methodology is as follows. We first run a suite of Smoothed-particle hydrodynamics (SPH) simulations of binary gas-rich galaxy mergers over a range of baryonic masses and merger mass ratios. The mergers are between idealised disc galaxies. We additionally run three isolated disc galaxy simulations as a control. These simulations represent potential physical models for 2 24 µm sources. We then investigate the UV-mm wave SEDs of these galaxies utilising a 3D dust radiative transfer code in post-processing. In what follows, we describe the details of these numerical simulations, and outline both the input parameters, as well as the assumptions made.
2.1 Hydrodynamics
The hydrodynamic evolution of the galaxies was simulated utilising a modified version of the publicly available -body/SPH code, gadget-2 (Springel, 2005). gadget-2 follows the dynamical evolution of the dark matter, ISM, stars and black holes in the simulated galaxies, and explicitly conserves both energy and entropy (Springel & Hernquist, 2002).
The ISM is considered to comprise of a two-phase medium via a sub-grid model (Springel & Hernquist, 2003). In this model, cold clouds are assumed to be embedded in a hotter, pressure-confining phase. The cold phase may convert to the hotter phase via evaporation from supernovae heating, and similarly the hot phase may cool into cold gas. This ISM is pressurised by heating from supernovae. Numerically, this is handled via an effective equation of state (hereafter EOS; see Figure 4 of Springel et al., 2005b). Here, we assume the stiffest equation of state which stabilises the disc against runaway fragmentation. We explore the consequences of relaxing this assumption in § 2.2.2.
The star formation rate in the simulations is dependent on the density of cold gas (defined here as gas which has reached the floor of the cooling curve, ) as SFR. The normalisation of this relation is set such that the simulated star formation rate surface density scales with the gas surface density in agreement with local observations (Kennicutt, 1998; Cox et al., 2006).
Black holes are included in the simulations as collisionless particles. These particles stochastically accrete matter according to a Bondi-Hoyle-Lyttleton paramaterisation when a particle comes within a smoothing length of the black hole sink particle. To model the impact of thermal feedback from accreting black holes, a fraction of the accreted mass energy (here, 0.5%) is reinjected thermally and spherically into the surrounding ISM (Springel et al., 2005b). The fraction of accreted mass energy which couples back to the ISM is set by matching the normalisation to the local relation (though note that the slope is a natural consequence of the AGN feedback; Di Matteo et al., 2005).
The progenitor disc galaxies are initialised with a Hernquist (1990) dark matter halo profile. The choice of concentration and virial radius for a halo of a given mass was motivated by cosmological -body simulations, then scaled to match the expected redshift evolution (Bullock et al., 2001; Robertson et al., 2006). The halo for our fiducial model (DOG10, Table 1) has a =0 concentration and spin parameter . We initialise our discs to reside at =3, so that our simulated mergers occur around 2. We consider initial virial velocities in the range 225-500 km s-1, resulting in dark matter halo masses of M☉-1013M☉, consistent with the DOG clustering measurements by Brodwin et al. (2008). The halos are populated with exponential discs whose disc scale lengths follow the Mo et al. (1998) prescriptions.
The discs for model galaxies are initialised with gas fractions . Simulation tests by Narayanan et al. (2010) have shown that high-redshift mergers initialised with this gas fraction result in at the time when the galaxy may be viewed as an SMG, which is comparable to observations (e.g Bouché et al., 2007; Tacconi et al., 2008; Daddi et al., 2009; Tacconi et al., 2010). While gas fractions in DOGs are observationally unconstrained, based on an observed overlap between the luminous DOG and SMG populations (e.g., Pope et al., 2008; Brodwin et al., 2008), we consider this assumption reasonable. In order to investigate any potential dependence on gas fraction, we have run a subset of our simulations with initial gas fractions as well. The results from all initialisations are qualitatively similar, and we include both in our plots to increase the simulation sample size. The gravitational softening lengths are set at 100 h-1pc for baryons and 200 h-1pc for dark matter. Because structure in the ISM clearly exists below these scale lengths, we employ a subgrid specification to the ISM for the radiative transfer calculations. This will be discussed in the following two subsections.
In this paper, we consider 16 simulations, with inital conditions listed in Table 1. The simulations (and nomenclature) here are nearly identical222The primary difference between the simulations run here and those employed in Narayanan et al. (2009) is in the assumptions of the evolving dust mass (see the next section). Here, we tie the dust mass to the metallicity, whereas in Narayanan et al. (2009), the dust mass is tied to the gas mass. This makes little difference during the merger event, though can have some effects on the optical flux during the inspiral phase. to those in Narayanan et al. (2009) and Narayanan et al. (2010)’s studies of SMG formation. This will facilitate direct comparisons between the DOG population and high-redshift SMGs. When we refer to investigating a fiducial merger, this will refer to model DOG10 with initial .
2.2 Radiative Transfer
2.2.1 General Methods
We extract synthetic SEDs from our SPH simulations in post-processing utilising the 3D polychromatic Monte Carlo radiative transfer code, sunrise (Jonsson, 2006; Jonsson et al., 2010). sunrise considers the propagation of UV through mm-wave photons through a dusty medium, and operates on an adaptive mesh. Here, we summarise the aspects of the code most relevant to this study, and refer the reader to Jonsson et al. (2010) for the most current detailed description of the underlying algorithm.
Dust radiative transfer may be thought of in terms of sources and sinks. Here, the sources of radiation are stellar clusters, AGN and dust grains. The stellar clusters emit a spectrum calculated by starburst99 (Leitherer et al., 1999; Vázquez & Leitherer, 2005), where the ages and metallicities of the stars are known from the SPH simulations. The stellar particles present in the simulation’s initial conditions are assumed to have formed over a constant star formation history for 250 Myr (where this time was chosen by dividing the stellar mass of the first simulation snapshot by the SFR at that time). That said, the rest-frame UV and mid-IR (which dominates the wavelength regime of interest for DOGs) is contributed mainly by young ( Myr) stars (and their surrounding HII regions), and thus our results are largely insensitive to the choice of star formation history. We assume a Kroupa IMF for these calculations, suggested by observations of 2 SMGs (Tacconi et al., 2008).
The AGN input spectrum utilises the luminosity-dependent templates of Hopkins et al. (2007) of type I quasars. The template spectrum includes torus hot dust emission, and is based on the mid-IR SED template of Richards et al. (2006). The normalisation of the input spectrum is set by the total bolometric luminosity of the black hole(s), which is determined by their mass accretion rate: . Here, is assumed to be 10%. The AGN are included in all simulations investigated here (mergers as well as secularly evolving galaxies).
The sinks of radiation are dust grains in the ISM. The emission from stars and AGN undergo scattering, absorption and remission as they propagate through the ISM. Because the ISM substructure is not resolved by our hydrodynamic simulations, we employ subgrid modeling techniques which we explore in the following subsection. Eight model cameras are set up isotropically around the galaxy to observe the merger. The emergent flux is determined by the number of photons that escape the galaxy in a given camera’s direction.
sunrise calculates the dust temperature of the grains self-consistently, and assumes that the dust and radiation field are in radiative equilibrium utilising the methodology of Juvela (2005) for calculating the converged radiation field. In this methodology, when photons are absorbed in a grid cell, the dust temperature is updated. A new photon packet is then emitted from this cell which has an SED equal to the difference between the SED associated with the updated dust temperature, and that from the old one. This procedure is iterated upon until the radiation field has converged (Jonsson et al., 2010). Consequently, both the AGN and the starburst are involved in determining the dust temperature across all the grid cells.
PAHs are emitted by the HII regions, PDRs, and the diffuse dust in the galaxy. Carbonaceous dust grains with sizes Å are assumed to have characteristics of PAH molecules. A fraction of these PAH molecules (following Jonsson et al., 2010, we take this value to be 50%) emit a template spectrum, and the remaining fraction emit thermally. The PAH template is a linear combination of Lorentzian profiles, and the fraction of PAHs emitting the template is chosen to fit Spitzer IRS observations of local galaxies (Dopita et al., 2005; Groves et al., 2008; Jonsson et al., 2010). Their absorption is calculated utilising the Li & Draine (2001) cross sections. Varying this fraction changes the PAH luminosity (which can affect the 24 µm flux density at =2). We have performed test simulations exploring the range of PAH fractions, from 0 to 1. Generally, the trends presented in this paper are insensitive to the inclusion of PAHs, though the normalisation of some trends can be. That is to say, the magnitude of the 24/ ratio is dependent on the fraction of emitting PAHs, though the evolutionary trends in the 24/ ratio are not. Tests investigating the limits (e.g. either 0% or 100% of carbonaceous grains with sizes Å emit as PAHs) show that the observed 24 µm flux density of our model galaxies varies at most by a factor of 2 (when observed at =2.0). We note that PAHs are not explicitly destroyed by the AGN.
The evolving dust mass is calculated assuming a constant dust to metals ratio of 0.4, consistent with models and observations of both local Universe galaxies, as well as those at higher redshifts (Dwek, 1998; Vladilo, 1998; Calura et al., 2008). The distribution and mass of interstellar dust is determined by the galaxy evolution simulations. We use the Weingartner & Draine (2001) dust grain model with , as updated by Draine & Li (2007). This model include silicates and graphites. We note that silicate absorption features are not put in by hand into this model - rather their occurrence is the result of modeled radiative transfer effects.
All photometric quantities in this paper are convolved with the appropriate instrument filter sensitivity function. Throughout this paper, all flux densities and flux density ratios come from both galaxies in the simulation box. While the simulation box is 100 kpc on a side, the nuclei of the galaxies (where the bulk of the emission arises from) never stray more than 50 kpc from each other. This is roughly comparable to the Spitzer 24 µm beam at =2. Hence, during all the relevant stages of the interaction, both galaxies would appear as a single (blended) source in Spitzer 24m surveys.
2.2.2 ISM Specification and Other Free Parameters
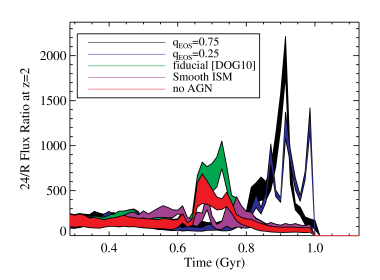
The ISM in our simulations is unresolved below the hydrodynamic resolution limit of 100 pc. In order to model obscuration below these scales, we employ subgrid methods. In the remainder of this subsection, we discuss the effects of the subgrid assumptions on our final results. For the reader unfamiliar with the main results of this paper, it may be worthwhile returning to this section after reading through the main results to better understand the implications of our subgrid techniques. In this section, we will refer to Figure 1 frequently, which summarises our comparison of varying ISM treatments. In this figure, we vary assumptions regarding the ISM and AGN for our fiducial merger, DOG10 (with 80% initial gas fraction), and plot the evolution of the 24/ ratio. The thickness of each lightcurve owes to sightline variations in the SED.
The young stellar clusters (with ages Myr) are assumed to reside in their nascent birthclouds, and have their spectrum reddened accordingly. The birthclouds are comprised of HII regions and photodissociation regions (PDRs), whose sizes and temperatures are calculated with the 1 dimensional photoionisation code mappingsiii (Groves et al., 2008). The HII regions evolve as one-dimensional mass-loss bubbles (Castor et al., 1975) and absorb much of the ionising UV radiation from the stellar clusters. In fact, the HII regions dominate the 24 µm continuum (observed-frame at =2) flux density during starbursts.
The time-averaged covering fraction of PDRs is a free parameter, and can be related to the PDR clearing time scale as . Here, we take the PDR covering fraction to be unity () which essentially means that massive O and B stars are assumed to be surrounded by their nascent birthclouds for the entirety of their lives (as the PDR clearing timescale is then longer than the lives of these stars; see Figure 6 of Groves et al., 2008). While is an unconstrained parameter, some evidence exists that in local mergers a molecular interstellar medium with a large volume filling factor may blanket nuclear O and B stars for the majority of their lives (Downes & Solomon, 1998; Sakamoto et al., 1999). This suggests that a large PDR covering fraction may be a reasonable assumption in massive starbursts. The assumption of is conservative: removing the cold birthclouds typically increases the 24 µm flux density (observed at =2.0) (as emission from the HII regions can escape more unhindered).
One potential issue is that the mappingsiii SEDs are parameterised in terms of their compactness, which is dependent both on the stellar cluster masses and the ISM pressure (see e.g. equations 9-13 of Groves et al., 2008). The pressures seen in the central regions of the most massive high- mergers exceed the largest ones available in the mappingsiii lookup tables by a factor of 10-100. This means that in reality the mappingsiii HII/PDR SED will be hotter than those at the saturated values used here (see, Figure 5 of Groves et al., 2008). Because the stellar/HII/PDR SEDs dominate primarily during the peak starburst phase of a merger, the net effect of this is that we are likely underestimating the duty cycle of the DOG phase during merger-driven starbursts in our simulated galaxy sample. Because our inclusion of the mappingsiii SEDs errs on the side of more conservative models, we proceed with this caveat in mind.
Our simulations have no information about the structure of the ISM below the resolution limit outside of a stellar cluster’s birthcloud. Effectively, what this means is that the radiative transfer models here do not account for absorption by GMCs outside of a given stellar cluster’s birthcloud (Jonsson et al., 2010). To place an upper limit on the potential attenuation from the cold ISM, we have run test cases where we assume that each grid cell is uniformly filled with dust and gas with the mass returned from the SPH simulations. This effectively assumes that all dust that would be associated with GMCs in the ISM has a volume filling fraction of unity. Because the mass in the birthclouds is ’borrowed’ from this gas mass budget, in this special scenario we require that in order to avoid potential double-counting issues. In this extreme case, the ISM is optically thick at mid-infrared (rest-frame) wavelengths, and the SED has a larger proportion of its flux at longer wavelengths. The purple curve in Figure 1 shows the evolution of the relatively depressed 24/ ratio for this “Smooth ISM” case. We note that while the 24/ ratio is in this Smooth ISM model is not as large as the other cases, the galaxy’s SED is still quite red. In this case, a larger fraction of the power in the SED is shifted into the FIR; as such, this galaxy would likely be selectable by e.g. Herschel surveys.
Our choice of equation of state may have an effect on the star formation history and structure of the ISM in the model galaxies as well. Nominally, we utilise the full Springel & Hernquist (2003) multi-phase EOS which simulates the pressurisation of the ISM owing to supernovae heating. This is somewhat stiffer than an isothermal EOS (the stiffest EOS is shown by the solid curve in Figure 4 of Springel et al., 2005b, the isothermal EOS is the dashed line). Referring to this figure, the effective EOS employed can be quantified by a ’softening parameter’ such that represents the stiffest EOS which aims to account for SNe pressurisation of the ISM. Similarly, represents an isothermal EOS.
Because we use the stiff EOS (), the gas is relatively pressurised which retards fragmentation. This affects both the star formation history as well as the structure of the ISM (galaxies with a softer EOS will be more clumpy which may affect optical depths). To investigate the consequences of our choice of EOS, we have examined the evolution of a fiducial galaxy merger, DOG10 with softer EOSs ( and , linear interpolations between isothermal and ).
In Figure 1, we show the 24/ lightcurves for our fiducial model, with the aforementioned modifications to soften the EOS (black and blue curves). The general effect of the softening of the EOS is to cause the ISM to become more unstable to fragmentation, and reduce optical depths toward the central regions. Because of this, the observed SED is hotter for the and cases than the fiducial DOG10, and the peak 24 µm flux density a factor of a few higher. Softening the equation of state increases the likelihood that a given simulation will be selectable as a DOG.
There is some evidence that discs at high redshift may indeed be clumpy. Both observations (e.g. Elmegreen et al., 2007; Daddi et al., 2008; Genzel et al., 2006; Elmegreen et al., 2009; Förster Schreiber et al., 2009) and models (e.g. Bournaud et al., 2008; Dekel et al., 2009; Elmegreen, 2009; Ceverino et al., 2010; Elmegreen & Burkert, 2010) suggest that disc galaxies at high- contain relatively large clumps of gas. However, despite this, we choose to utilise the simulations with the stiffest equation of state (). The reasons follow. First, with respect to simulating the formation of DOGs, this is the middle-of-the-road choice amongst our ISM assumptions. For example, examination of Figure 1 shows that while a softer EOS more easily produces DOGs, a smooth ISM supresses them. The model with birthclouds (and no other cold GMCs) and a stiff EOS has a test lightcurve which falls in between the two extremes. Second, we can constrain the models somewhat by the gas fractions at the time of merger. If we assume that mergers represent a reasonable model for the formation of high-redshift Submillimetre Galaxies (e.g. Tacconi et al., 2006, 2008; Narayanan et al., 2009, 2010, though see Davé et al. 2009 for counter-arguments), then the gas fractions in the model galaxies at the time of merger/peak submm flux density should be comparable to those inferred from observations. Indeed, Narayanan et al. (2010) showed that the gas fractions at peak coalescence were indeed 40%, comparable to the measurements of Bouché et al. (2007) and Tacconi et al. (2008). However, because our simulations do not include the infall of primordial gas from the IGM, there is no way to replenish the gas once it is consumed by star formation. Thus, by utilising a softer EOS and increasing the level of disc fragmentation/star formation, the models quickly run out of gas and render the galaxy relatively gas poor during the peak submm phase. Tests show that the simulation with have gas fractions of 20(10)% during their final coalescence/peak-submm phases. In this sense, our usage of a stiff EOS is a requirement to match certain physical properties of the most extreme high- ULIRGs, necessitated by limitations of the models. Moreover, in the interest of making a more direct comparison with our previous attempts at modeling high- ULIRGs (to wit, the SMG population Narayanan et al., 2009, 2010), we utilise the stiffest EOS and birthcloud model to remain consistent with the initial conditions chosen for those models.
To summarise our exploration of the effects of ISM substructure on the radiative transfer, we expect clumpiness of the ISM to exist on three scales: on the scale of birthclouds around young stellar clusters; in other GMCs outside of the birthclouds; and on kpc scales as seen in observed discs at high- (e.g. Elmegreen et al., 2007, 2009). Our inclusion of the mappingsiii calculations accounts for some obscuration on the birthcloud scale, and our parameter search with the EOS has tested the possible effects of larger clumps on the radiative transfer. With respect to obscuration by GMCs outside of the parent birthcloud, the current generation of simulations only allow us to test the limiting cases of a smooth obscuring ISM with a volume filling fraction of unity. The results of these tests on the models are summarised in Figure 1.
Finally, we can explore the role AGN play in our model for DOG formation. AGN heat the surrounding dust and contribute to rest frame 8µm thermal emission. This both increases the observed 24/ ratio, as well as the duty cycle over which the galaxy has extremely red colors. The effect of not including AGN can be seen in the red curve in Figure 1.
3 Formation and Evolution of DOGs
3.1 Physical Evolution of a Merger
The formation of ULIRGs through mergers has a long history (e.g., Sanders et al., 1988; Sanders & Mirabel, 1996). We therefore begin our investigation of DOGs with the ansatz that DOGs originate in gas rich galaxy mergers at high redshift. We will then go on to explore under what circumstances DOGs may be represented by non-merging galaxies (§ 4), and show that as observations probe sufficiently lower 24 µm flux density limits, less extreme conditions are sufficient to form DOGs.
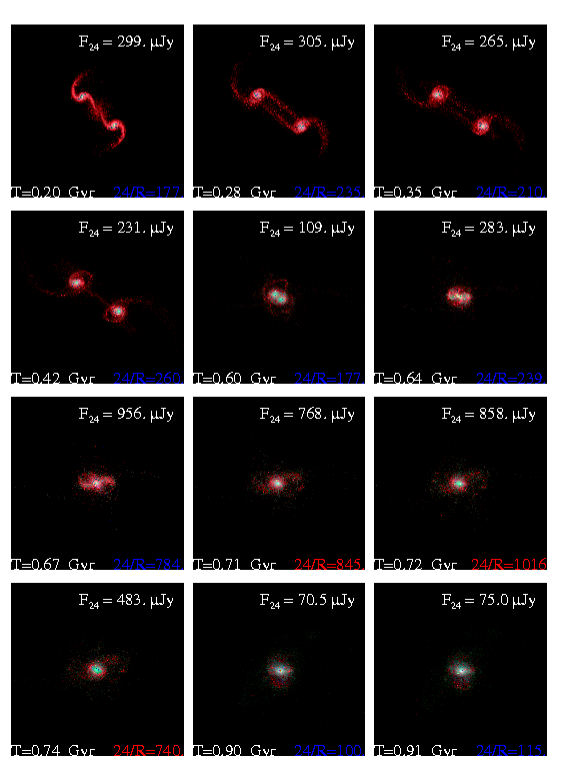
We first briefly orient the reader as to the generic physical evolution of a high-redshift binary gas rich galaxy merger. Here, we focus on fiducial model DOG10 (Table 1). DOG10 is a 1:1 M☉ merger. Figure 2 shows the evolution of the morphology of DOG10 as viewed from a single sunrise camera. The boxes are 100 kpc/h on a side, and the galaxy is observed at =2 (with the observed 24 µm, and -band emission mapped onto red, green and blue). DOG10 is a very similar model to as the fiducial SMG (SMG10) studied in Narayanan et al. (2009). We will present a more detailed comparison between DOGs and SMGs in § 5.1.
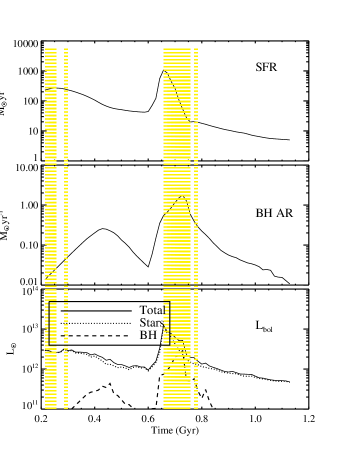
In Figure 3, we show the evolution of the SFR, black hole accretion rate, and bolometric luminosity of DOG10. The first passage of the galaxies induces a 200 M☉yr-1 starburst. This elevated star formation rate is largely sustained for 5108yr while the galaxies inspiral toward final coalescence. As such, by the time of coalescence, the galaxy system builds up a 1011 M☉ bulge (Narayanan et al., 2010).
When the galaxies approach for final coalescence, tidal torquing on the gas funnels large quantities into the nucleus of the merged system (Barnes & Hernquist, 1991, 1996; Mihos & Hernquist, 1994, 1996; Springel et al., 2005b), inducing a massive 1000 M☉yr-1 starburst. Concomitantly, inflows fuel central black hole accretion. In the mergers modeled here, the black hole accretion rate can approach 1-2 M☉yr-1. The associated AGN feedback contributes (along with gas consumption by star formation) to terminating the starburst, and may render the black hole optically luminous for a short period of time as feedback and gas depletion clear sightlines (Springel et al., 2005b; Hopkins et al., 2005a, b), accounting for the observed population of bright quasars (Hopkins et al., 2006, 2008). The contribution of newly formed stars and an embedded AGN drive the 1013L☉ bolometric luminosity during the merger. It is during the final merger, when the starburst, black hole accretion rate and bolometric luminosity are all near their peak ( 0.65-0.75 Gyr; i.e., the shaded region in Figure 3) that we expect the infrared luminosity of the model galaxy to peak (Jonsson et al., 2006; Younger et al., 2009; Narayanan et al., 2010).
3.2 The Evolution of the 24/ Ratio in Mergers
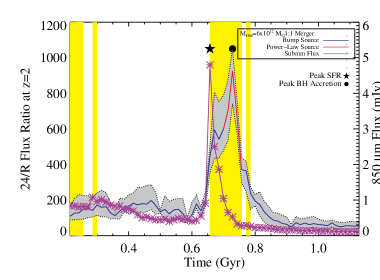
In Figure 4, we plot the evolution of the 24/ ratio for fiducial merger DOG10 placed at =2. As a reminder, Figures 2 and 3 serve as a reference for the morphology, black hole accretion rate, SFR, and bolometric luminosity for this galaxy. The grey shaded region shows the range of 24/ ratios as seen from 8 isotropically placed cameras outside the model galaxy, and thus reflects the dependence of the 24/ ratio on viewing angle. The yellow shaded region shows when the galaxy could be detected above the nominal 300 Jy detection threshold at =2. We plot the 850 µm lightcurve as well (with units on the right ordinate), though defer discussion of this aspect of the figure until § 5.1). We additionally note when the galaxy would be a bump galaxy, and when it would be a PL galaxy (as the red/blue colors in the 24/ lightcurve), but defer discussion of this aspect of the galaxy’s evolution to § 3.3.
Massive mergers at high redshift naturally produce DOGs during their final coalescence. The galaxy appears the reddest during the starburst/AGN activity associated with final coalescence (in our fiducial DOG, we note that it is formally above the 24/ threshold for only a brief period of time. More massive models [e.g. DOG1] form DOGs for longer duty cycles. DOG10 is, to some degree, the rough minimum galaxy mass necessary in our simulations to form a DOG). The observed 24 µm thermal emission comes from two sources. During the inspiral phase, warm dust in the diffuse ISM dominates the 24 µm emission. At times of elevated SFR (e.g., during final coalescence; 0.65 Gyr), HII regions additionally contribute a substantial fraction of the observed 24 µm thermal emission allowing the galaxy to be selected in 24 µm surveys. As gas consumption and the wind from the AGN terminate both the starburst (Springel et al., 2005a) and black hole growth (Younger et al., 2008b), the 24/ ratio fades. Soon thereafter, the 24 µm flux density drops (with the bolometric luminosity of the galaxy) such that the galaxy would no longer be detectable with current instruments.
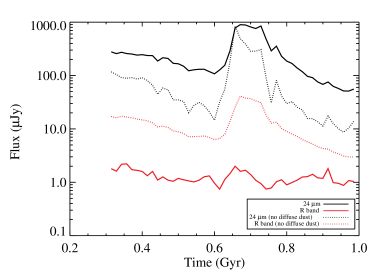
The 24/ DOG criterion selects star-forming galaxies which have large quantities of obscuring dust in the diffuse ISM. The copious rest-frame UV photons produced by the starburst are reprocessed into rest-frame 8 µm thermal radiation by dust both within the HII regions and in the diffuse ISM. Though this point may seem trivial, it is to be underscored that star-forming galaxies without large columns of dust in the diffuse ISM may still be selected as 24 µm-bright galaxies (owing to the reprocessing of some of their UV photons in HII regions), but will not be reddened enough in their observed 24/ to be selected as DOGs. We demonstrate this explicitly in Figure 5, where we show the 24 µm and -band lightcurves for our fiducial model (DOG10) both including diffuse dust (the fiducial model) and neglecting it. For the model neglecting diffuse dust, we still include HII regions surrounding stellar clusters. It is clear that the HII regions are responsible for a substantial fraction of the observed 24 µm flux density. However, the diffuse dust is important in absorbing the UV radiation which escapes the HII regions; without this attenuation, the excess radiation which escapes the galaxy causes the normalisation of the 24/ ratio to fall significantly below the DOG selection criteria.
3.3 Evolution of Bump DOG to Power-law DOG
As discussed in § 1 (see also D08), the mid-IR spectra of DOGs come in two flavors: those characterised by a ‘bump’ at 5 µm, and those exhibiting a power-law rise in the SED (Dey et al., 2008). Bump features in the mid-IR SED of 2 galaxies are thought to originate from a combination of thermal emission from lower mass stars at rest-frame 1.6 µm, and emission from massive stars which show a local minimum in their atmospheric opacity at this wavelength (John, 1988; Simpson & Eisenhardt, 1999; Farrah et al., 2008). Similarly, the PL shape in the mid-IR spectra of 2 galaxies is canonically associated with the dominant presence of AGN continuum (though, as we will show, the PL SED can originate in starburst dominated galaxies).
In a merger-driven model for DOG formation, there is a natural evolution in the mid-IR SEDs of 2 DOGs from bump-like to PL-like as the merger progresses. For the purposes of our analysis, we fix our model galaxies at =2, and define a bump galaxy utilising a simple peak-finding method333We note that this definition of “bump” versus “powerlaw” mid-IR SEDs is similar to that used by Farrah et al. (2008), and is simpler to implement than the power-law fitting method used by D08. such that and (where , , and correspond to the filter-convolved fluxes from IRAC channels 1,2 and 4, respectively). Similarly, we define a PL galaxy as one where . Returning to Figure 4, we now see that when we utilise this criteria for classifying the bump and PL phase of the galaxy’s evolution, there is a transition during the merger from a bump galaxy to a PL galaxy (where the bump phase is denoted by the blue segment of the line, and the PL phase by the red one). Comparing with the morphology (Figure 2), it is evident that this transition occurs during final coalescence.
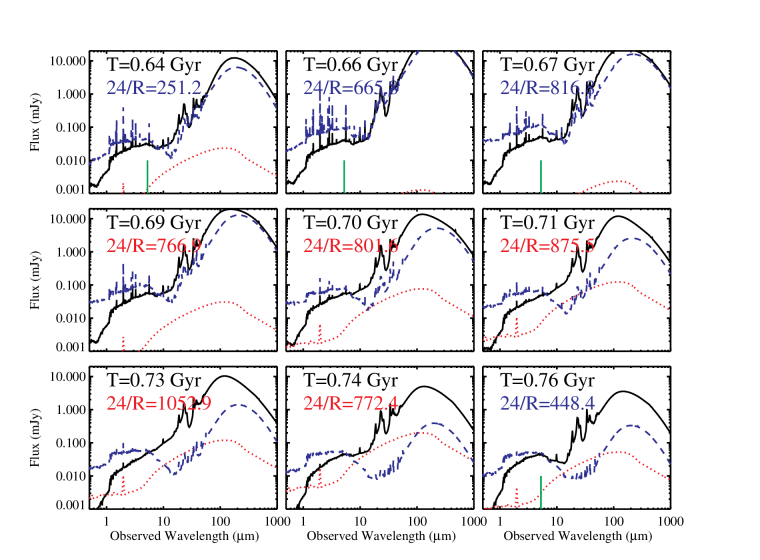
We can understand the details of the origin of the bump to PL transition more explicitly by examining the evolution of the SEDs of DOGs during the final coalescence stage. In Figure 6, we present the sightline-averaged SED from fiducial galaxy DOG10 as it evolves through its final coalescence phase. The observed SED is shown by the black solid line in each panel. The blue dashed SED represents the input starburst99 SED444More specifically, the blue dashed line is the starburst99 input SED after it has passed through the HII regions and PDRs surrounding stellar cluster utilising mappingsiii., and the red dotted curve the input AGN template SED. Both the stellar and AGN SEDs are unreddened by diffuse dust in the galaxy (though the stars are reddened by HII regions and PDRs). We list the time stamp of each panel for comparison with the morphology (Figure 2), and global 24/ light curve (Figure 4), and quote the 24/ ratio in each panel. The 24/ ratio is color coded based on if the DOG is a bump galaxy (blue), or PL galaxy (red).
In the early stages of the DOG phase (near the beginning of final coalescence, e.g., Gyr), the mid-IR SED shows the characteristic stellar bump associated with a star-formation dominated infrared luminosity. As the merger evolves, the mid-IR SED becomes best characterised by a power-law shape. PL galaxies can arise from either starburst-dominated or AGN-dominated DOGs. Starburst-dominated PL galaxies owe their origin to large columns of dust obscuration associated with the final merging. To see this, consider panel Gyr in Figure 6. During the merger, the intrinsic stellar flux density at 5 µm can be extinguished by up to an order of magnitude. This can force the SED to look power-law-like, even while the AGN contribution at these wavelengths is small. The galaxy then evolves into an AGN-dominated PL galaxy. Here, the AGN SED contributes substantially to the observed SED at 8 µm, again giving a power-law mid-IR shape (e.g., Gyr). As is clear, then, PL mid-IR SEDs from 2 galaxies may represent either starburst dominated or AGN dominated galaxies. The relationship between the AGN contribution to PL mid-IR SEDs in 2 24 µm sources will be explored in more detail in a forthcoming paper (D. Narayanan et al., in prep.).
4 The Physical Form of DOGs: Are Mergers Necessary?
Thus far, we have seen that gas rich galaxy mergers at high redshift provide a plausible means for forming luminous DOGs. Furthermore, this mechanism for DOG formation suggests a picture for connecting bump DOGs and PL DOGs. This leads to a natural question: are mergers a necessary prerequisite for the formation of DOGs?
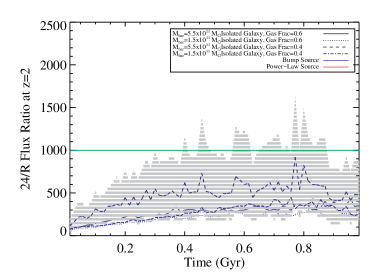
We begin with Figure 7, where we show the evolution of the 24/ ratio for the most massive isolated galaxies in Table 1. We plot the lightcurves for both gas initial fractions modeled - 40% and 60%. The lightcurves are sightline averaged, and we show the sightline-averaged disperion for the reddest galaxy through the grey-shaded region. Generally, isolated galaxies are not quite red enough to satisfy the fiducial 24/ criteria for DOG selection. This said, the most massive, dust-rich ones can represent DOGs. For example, the 40% gas fraction, M☉ model (which starts with nearly solar metallicity in the closed-box model) approaches DOG-like redness. That said, the most massive, dust-rich isolated galaxies can be selected as DOGs when in an edge-on configuration.
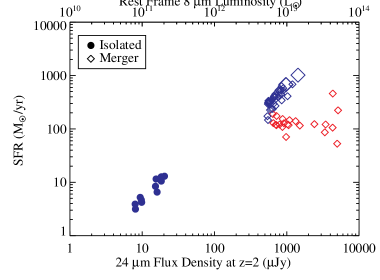
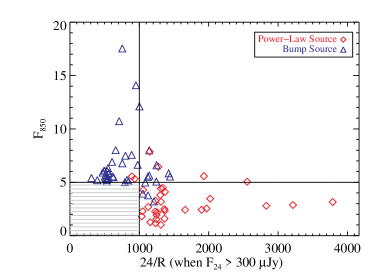
We can further investigate the relative role isolated discs and mergers play toward 2 ULIRG formation in Figure 8, where we plot the SFR versus the 24 µm flux density (and rest-frame 8 µm luminosity) at =2 for every snapshot in our simulation sample that has a 24/ ratio 1000. We discriminate both between mergers and isolated galaxies, as well as whether the galaxy is a bump or PL DOG. The larger symbols are galaxies which would also be detectable as SMGs, though we defer discussion of this aspect until § 5.1. Mergers populate the bulk of the luminous ( 300 Jy) DOG population in this diagram. These systems, which are extremely gas/dust rich, become red enough to be selected as DOGs during close passages and final coalescence (e.g., Figure 4). Mergers provide an efficient means for generating the starburst and/or AGN activity to heat the dust sufficiently that the galaxy is visible at 24 µm above 300 Jy. Nominally, we find a minimum SFR M☉yr-1 necessary when AGN activity is negligible to power Jy sources. Similarly, for DOGs powered by AGN, we find minimum AGN accretion rates of M☉yr-1 are required to power the brightest DOGs.
At lower 24 µm flux density limits, however, mergers are not always required for the formation of DOGs. Massive discs can be red enough to satisfy the requisite infrared-optical color ratio for DOG selection, though are less bolometrically luminous.
The most luminous DOGs in Figure 8 tend to all be PL sources, consistent with observations (Dey et al., 2008). The isolated galaxies exhibit lower 24 µm flux densities, and are always bump DOGs. At lower flux densities, the SFR is correlated with the observed 24 µm flux density (C. Hayward et al., in prep.). As the contribution of AGN becomes non negligible, though, this relation breaks down (e.g., for most luminous sources). While the trends in Figure 8 are robust, we caution against interpreting the absolute values of the 24 µm flux density too literally. Rest frame mid-IR PAH features contribute to the observed at 2. Modulating the assumed fraction of carbonaceous grains which emit the PAH template can shift the observed 24 µm flux density of a given galaxy. Changing the PAH fraction has the strongest relative effect on the lowest flux density galaxies, and at its limits (e.g., a PAH fraction of 0 or 1), can shift the observed flux density by up to a factor of 50% (though the shift is less for more luminous sources).
To summarise, our models suggest that the most luminous DOGs (i.e., those with Jy at ) likely result from mergers. In contrast, the less luminous DOGs can result from a wider range of (less extreme) conditions, perhaps even from secular evolution. Within this framework, there are a few salient points regarding the physical nature of DOGs that appear to be general to all DOGs selected at all flux density limits in our models.
First, in the absence of any merging activity, a DOG will never go through a PL phase. Some merging activity is necessary to produce the dust obscuration of UV radiation and/or AGN activity which drive the PL shape to the observed mid-IR spectra. Mergers are required to funnel sufficient gas to the central regions to suppress (or overwhelm) the stellar bump (and/or fuel the AGN). As such, PL DOGs constitute a relatively narrow class of galaxies, whereas bump DOGs are significantly more diverse as they are well represented by both mergers and non-mergers. This is seen explicitly in Figure 8.
Second, while it is not shown, there is a rough minimum galaxy mass necessary for forming DOGs. Nominally, galaxies with halos M☉ will not have the requisite gas supply to generate the starburst/AGN activity that drives the observed 24/ ratio. When mapping from baryonic masses to halo masses (e.g. Table 1), the halo masses are also consistent with the clustering measurements published by Brodwin et al. (2008). Moreover, the halo masses are consistent with the inferred halo masses of high-redshift galaxies of a comparable luminosity - that is, SMGs (Blain et al., 2004), and quasars (Croom et al., 2005; Lidz et al., 2006; Hopkins et al., 2007; Shen et al., 2007).
5 Relationship of DOGs to Other High-Redshift Galaxies
5.1 Submillimetre Galaxies
A number of clues suggest an intimate link between high-redshift 850 µm-selected SMGs, and the DOG population (Dey et al., 2009). First, circumstantial evidence indicates physical similarities between SMGs and DOGs. SMGs are thought to form in massive starbursts which both observational and theoretical evidence imply may be merger-driven (e.g., Chapman et al., 2003; Tacconi et al., 2006, 2008; Baugh et al., 2005; Swinbank et al., 2008; Narayanan et al., 2009, 2010, though see Davé et al. (2009) for an alternative interpretation). Our model for DOG formation suggests that luminous DOGs, as well, are likely formed at the final stages of a merger (§ 4). Similarly, the inferred SFRs in SMGs and PL DOGs appear to both be extremely large ( M☉yr-1; Swinbank et al., 2004; Kovács et al., 2006; Menéndez-Delmestre et al., 2007; Valiante et al., 2007; Dey et al., 2008; Bussmann et al., 2009; Desai et al., 2009). DOGs and SMGs cluster in similar mass halos (Brodwin et al., 2008), and tentative evidence suggests that may they contain somewhat similar mass stellar bulges (e.g. Swinbank et al., 2004; Borys et al., 2005; Bussmann et al., 2009; Michałowski et al., 2009). Second, Narayanan et al. (2010)’s merger-driven model for the formation of SMGs utilised similar merger models employed in this study. This overlap in modes of galaxy formation (a merger-based mode for both SMG and DOG formation) suggests not only a physical connection between SMGs and DOGs, but possibly an evolutionary one. Finally, and perhaps most convincingly, an analysis of the GOODS-N field by Pope et al. (2008) has found a bona fide overlap between the SMG and DOG populations: Namely, some 30% of SMGs have 24/ colors consistent with DOG selection.
To assess the relationship between DOGs and SMGs, we now highlight the purple 850 µm flux density lightcurve overplotted in Figure 4. As the galaxies merge (0.65 Gyr), radiation from the 1000-2000 M☉yr-1 starburst is intercepted by the cold ISM, and re-emitted by cold dust as submillimetre-wave emission (Groves et al., 2008; Jonsson et al., 2010; Narayanan et al., 2010). At the same time, diffuse dust in the galaxy heavily reddens the optical light, rendering the galaxy visible as a DOG. The model DOG10 would be classified as a bump galaxy at the exact same time as it would be visible as an SMG (Figure 4). The formal DOG phase follows after the SMG phase in this model, though we note that numerous models in Table 1 show an overlap of the two phases. After the SMG phase, the fiducial galaxy transitions from a bump DOG to a PL DOG. Because the SMG phase and DOG phase of the galaxy are both triggered by the merger, the phenomena are intimately related.
While Figure 4 is instructive as to a general sequence of events, it should not be construed to mean that all SMGs would be selected as DOGs, much less bump DOGs. Merger orbit, viewing angle, and mass can shift the exact timing and magnitude of events to make the overlap less straightforward. To show this, in Figure 9, we plot the 850 µm flux density from every snapshot in every model in Table 1, making two selection cuts: the galaxy has to either be classified as an SMG (5 mJy), or a DOG (24/ 1000). We additionally note when the galaxies would be visible as bump sources, or PL DOGs. There is a significant overlap between the galaxy populations. A few features are apparent.
First, while there is overlap, many SMGs will not be selected as DOGs, and vice versa. Second, SMGs may be either bump or PL sources. The fact that some SMGs have bump mid-IR SEDs makes sense as the 850 µm flux which SMGs are selected on is powered by absorption of stellar light by cold clouds (Narayanan et al., 2010), and are generally thought to have their bolometric luminosity powered by star formation (Chapman et al., 2004; Alexander et al., 2005; Valiante et al., 2007; Pope et al., 2008; Younger et al., 2008a; Menéndez-Delmestre et al., 2009). That SMGs can also be PL DOGs may seem counterintuitive given that the dominant power source in SMGs is thought to be star formation. Recall, however, that some PL sources derive their mid-IR SED shapes from extremely heavy dust extinction at 5 µm, even while the AGN continuum does not dominate the mid-IR flux density. While the PL DOG phase is roughly contemporaneous with the rise in AGN continuum, they are not always exactly coincident in time.
SMGs will typically overlap with the more (24 µm) luminous DOGs. This owes to the fact that in our model, SMGs derive from massive mergers (see Figure 2 from Narayanan et al., 2010). The overlap of SMGs with high 24 µm flux density DOGs is apparent from Figure 8, where we highlight the symbols with double size which are galaxies which are selectable both as DOGs, as well as mJy DOGs.
Finally, we caution that Figure 9 should not be interpreted as a measure of the relative fractions of SMGs which are DOGs or vice versa. To construct those statistics will require a convolution of the SMG and DOG duty cycles with cosmological galaxy merger rates, a task deferred to a future study.
5.2 BzK Galaxies
The BzK selection criteria have been successfully used to find both star-forming and passively evolving galaxies at redshifts (e.g., Daddi et al., 2004). These samples overlap the DOG and SMG redshift ranges, and therefore provide an interesting comparison.
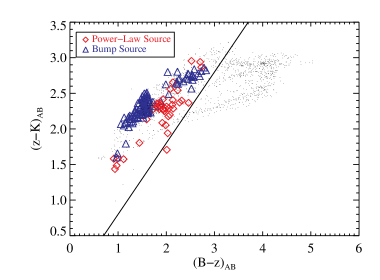
In Figure 10, we plot all DOGs in our simulation sample on the BzK color-color plot. In order to compare with Pope et al. (2008)’s analysis of GOODS-N DOGs (selected with 100 Jy) in BzK space, we include all DOGs with 100 Jy at = 2. We separate bump and PL DOGs, and overplot the rough criteria for star-forming galaxies () devised by Daddi et al. (2004) (such that galaxies which lie above the line are star-forming BzK galaxies). Finally, we note the location of all galaxies in our simulation sample (whether or not they are DOGs) in space by dots.
Most DOGs in our sample are selected as BzK galaxies. This result is not surprising. Daddi et al. (2005) find that the majority of BzK galaxies in the GOODS-N field are 24 µm detected. In more direct comparison to these model results, Pope et al. (2008) find that nearly all DOGs in the GOODS-N field are selected as BzK galaxies. The results here are in good agreement with the dataset of Pope et al. (2008), spanning a similar range in and colors.
There are two important caveats. First, while most DOGs can be selected as BzK galaxies, this does not mean that all BzK galaxies will be selected as DOGs. Observationally, Pope et al. (2008) find that only 12% of BzK galaxies are selectable as DOGs. Second, even though most DOGs fall into the star-forming region of the BzK color-color plot, they may not be detectable at optical wavelengths. Because the BzK criteria covers a broad range of star-forming galaxies, the DOG selection criteria selects a dusty subset of the BzK’s.
6 Observational Consequences of the Model
In order to assess the validity of our models, we compare the simulated and observed SEDs. We then make testable predictions of these models, and provide analysis tools via public SED templates. When comparing to observations, we focus primarily on the dynamic range of fluxes and color ratios. Matching the observed distributions (e.g., luminosity functions, color distributions) requires cosmological galaxy formation simulations, and will be presented in forthcoming work.
6.1 Comparisons to Observations: Optical-mm Wave SED
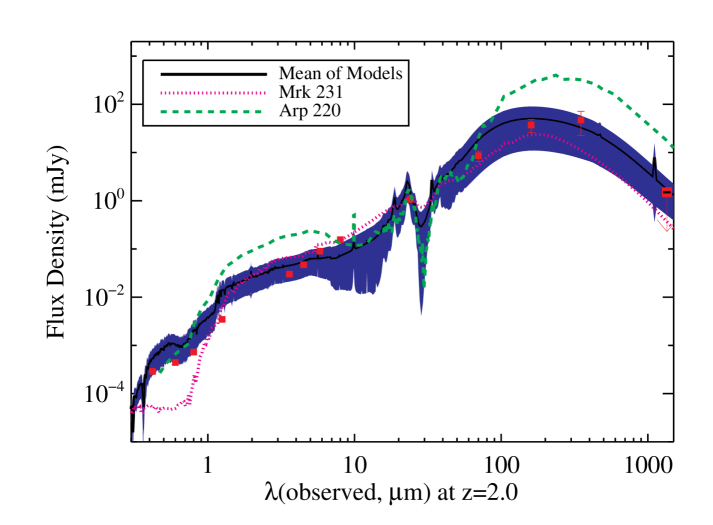
Observed SEDs of DOGs with spectroscopic redshifts have been compiled by Bussmann et al. (2009, in prep). In Figure 11, we present the model SEDs for four merger-driven DOGs which span the (mass) range of galaxies which form Jy DOGs (DOG1, DOG4, DOG7 and DOG10) and sample the full mass ratios of simulated mergers. We note that this is a simple mass (and mass ratio) scaling in simulated mergers, but aside from this, the initialisation of each merger (including galaxy orbit) remains identical. The SED is modeled for every snapshot while the galaxy is a DOG (above Jy), and is averaged over all camera angles. The black line represents the time and camera-averaged SED, and the blue shaded region denotes the 1 temporal dispersion for each model. The SED is modeled to be at =2.0. The red squares show the mean of all data in the Bussmann et al. sample for DOGs above Jy within the redshift range , and the error bars denote the propagated errors. In order to more accurately compare with the Bussmann et al. sample, we performed a Monte Carlo drawing of the galaxies in our simulation sample that forced our final sample to be comprised of 50% bump DOGs and 50% PL DOGs in the composite SED. This is comparable to the breakdown of mid-IR SED types in the observational dataset of Bussmann et al. We note, however, that simply including all DOG snapshots in our simulation sample makes little difference on the final composite SED. We additionally include template SEDs for local galaxies Mrk 231 (Armus et al., 2007; Chary & Elbaz, 2001, R. Chary, private communication), and Arp 220 (Rieke et al., 2009), each scaled to match the Bussmann et al. MIPS 24 µm point and redshifted to =2.0.
Generally, there is a reasonable match between the observed and modeled SEDs. The correspondence between the simulated optical, NIR and FIR SEDs, and those observed in DOGs implies that the models presented here have a similar UV flux from newly formed stars, stellar mass, and dust obscuration column as DOGs in nature. There are relatively minor discrepancies in the observed-frame NIR and mid-IR. The Mrk 231 and Arp 220 templates both have weaknesses in matching the observed data. The Arp 220 template overpredicts both the rest-frame optical-NIR and FIR flux densities. Similarly, the Mrk 231 SED underpredicts the rest-frame UV substantially. Given the relatively improved match between these models and the observed data points (as opposed to the local templates), we provide the model SEDs as templates in § 6.3.
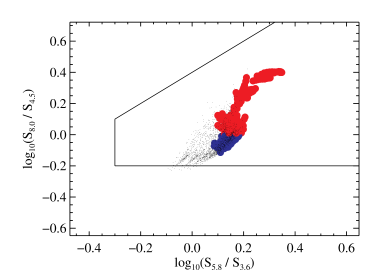
Figure 12 shows where the simulated galaxies fall on an IRAC color-color diagram. Here, we have taken our simulated galaxies, and redshifted them between =1.5 to 2.4 incrementally (in steps of =0.1), and plotted all galaxies with a 24/ ratio , and Jy. The dots show the galaxies which have Jy, but do not have the requisite 24/ ratio to be selected as a DOG. The PL DOGs show redder colors than the bump DOGs, which in turn are redder (in 5.8/3.6) than the non-DOG 24µm sources. The simulated colors of all models lie roughly in the same region as the observations (Desai et al., 2009; Lacy et al., 2004), but span a smaller dynamic range. The solid lines enclose the region noted by Lacy et al. (2004) to typically contain AGN. Both observed DOGs (Desai et al., 2009) and these models tend to fall primarily in the Lacy et al. (2004) AGN-wedge. While indeed DOGs powered by AGN fall into the AGN-wedge, many starburst-dominated galaxies appear to as well.
6.2 Testable Predictions
Our modeling suggests that the bright DOGs (Jy at =2) are the result of mergers and represent a phase of massive galaxy evolution following a sub-mm bright phase. If true, the models can be used to predict observational tests of this scenario. We note that these tests do not apply to the fainter DOGs, which are a more diverse population.
6.2.1 The Physical Masses of DOGs and Their Relation to SMGs
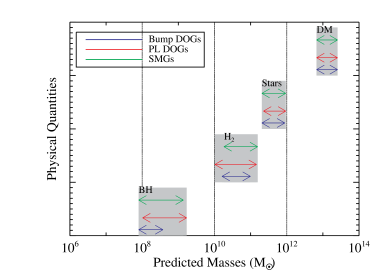
In Figure 13, we plot the range of black hole, stellar, dark matter, and H2 masses for all galaxies in our simulated sample at times they may be a DOG, discriminating both bump and PL DOGs ( 300 Jy). This prediction is made for galaxies that would be selected as DOGs between a redshift range of =1.6-2.4. We additionally show the same prediction for all galaxies in our simulations which would be selected as SMGs (with 5 mJy). The black hole, stellar, and halo masses are extracted directly from the hydrodynamic simulations. We note that the halo masses are predicted by construction as the mass of the simulated galaxies is set by the initial halo mass. While the SPH simulations do not explicitly follow the H2 molecular gas, we infer its mass by considering all of the dense, star-forming gas to be neutral, and extracting the H2/HI fraction utilising the Blitz & Rosolowsky (2006) interstellar pressure-based prescription (Narayanan et al., 2009).
Because we are considering a 300 Jy flux density limit, all of the DOGs in this plot formed from mergers. Mergers produce the bulk ( 90%) of their stellar mass prior to the final merging (Narayanan et al., 2008, 2009, T.J. Cox et al. 2009, submitted). Consequently, DOGs which form at the final coalescence of a merger will typically have already formed the bulk of their stellar mass. As such, the bump DOGs and PL DOGs in our simulations tend to have relatively large stellar masses, 1011, comparable to observations (Lonsdale et al., 2009; Bussmann et al., 2009). Because similar types of galaxies form SMGs and bright (Jy) DOGs (e.g. massive mergers), there is substantial overlap between the physical properties of bright DOGs and SMGs. Generally, only the halo masses are well-constrained for DOGs. As such, the remaining physical properties (stellar, BH, gas masses) shown in Figure 13 serve as a prediction.
The growth story for black holes is markedly different from that of the stars. Black holes in mergers undergo the bulk of their growth during the final merging (see, e.g., Figure 5 from Narayanan et al., 2008). As such, because the PL phase tends to follow the bump phase in these high-redshift merger models, on average, the black holes in PL DOGs will be larger than those in bump DOGs.
We can utilise this growth history of stellar and black hole masses in mergers to provide a test for our evolutionary model for mergers to transition from an SMG phase to a PL DOG phase (e.g., Figure 4). Merger remnants, in our simulations, lie on the - relation owing to the termination of the starburst event by AGN feedback, and self-regulation of black hole growth (Di Matteo et al., 2005; Robertson et al., 2006; Hopkins et al., 2007; Younger et al., 2008b; Li et al., 2007). Because the black holes grow substantially during the final coalescence of a merger, one might expect that the black holes in SMGs will be smaller, on average than those in PL DOGs if SMGs are to evolve into PL DOGs as these models suggest (Figure 4). In contrast, their stellar masses will be roughly comparable as the stellar masses are already in place at final merging.
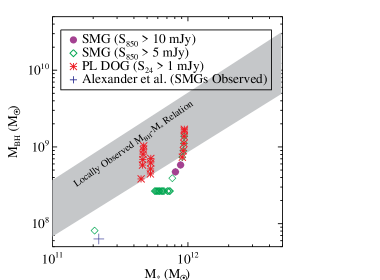
To test this, we compare the location of all bright SMGs and bright ( 1 mJy) DOGs in our simulation sample on the - relation (Figure 14). We bin the SMGs into average ( mJy) and bright ( mJy) bins. The extremely bright ( mJy) SMGs constitute a cleaner test as they are always galaxies at the peak of their starburst, whereas lower flux density sources (e.g., 5 mJy) SMGs can be either lower mass galaxies at the peak of their starburst, or more luminous galaxies both pre and post-starburst (Narayanan et al., 2009, 2010). Nevertheless, we include lower flux density ( mJy) SMGs for the purposes of comparison with existing data sets.
Figure 14 shows a direct prediction for our model. Most SMGs will lie below the present-day - relation as their black holes have significant growth they will undergo throughout the remainder of the merger (e.g., Alexander et al., 2008). They typically have stellar masses ranging from M☉, with the more common SMGs tending toward the lower end of this mass range555Indeed comparison to the compilation of SMGs by Alexander et al. (2008) (the blue cross) shows that the average observed SMG is more similar to our SMG models which form lower mass galaxies. . Bright PL DOGs, which occur contemporaneously with or later than SMGs in a merger’s evolution (e.g., Figure 4) will range from falling below the present-day - relation, to directly on/above it.
6.2.2 of DOGs
Forthcoming facilities which probe both sides of the peak of the SED of DOGs (e.g., Herschel, ALMA) will place strong constraints on the effective dust temperature. These dust temperatures will serve as a test for the predicted SEDs of DOGs from our models.
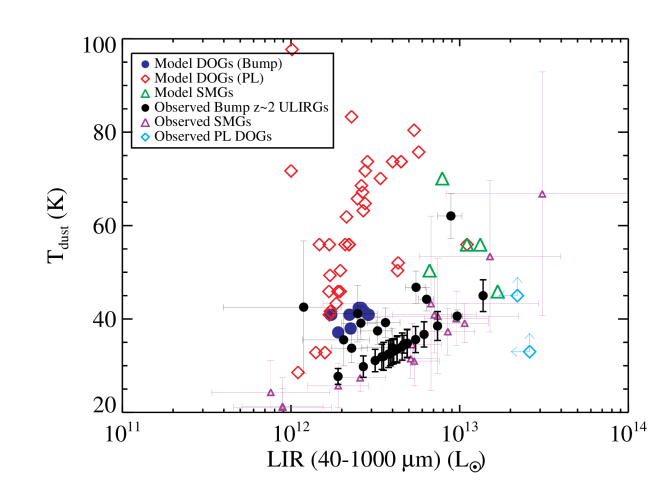
In Figure 15, we plot the predicted dust temperature of our model DOGs as a function of their FIR luminosity (40-1000 µm). The dust temperature is derived by converting the rest-frame wavelength of the SED peak to a temperature (using Wien’s displacement law), and is calculated for every snapshot where 24/ 1000 and 100 Jy (we utilise the lower flux density limit for completeness). For reference, we show all times when the model galaxies would be visible as SMGs (mJy as well). While deriving from the full SED is a different approach than that typically used by observers (who fit the observed data with SEDs varying and the dust spectral index, , which are degenerate with one another), we prefer this method: Utilising the entire model SED avoids any assumptions about , which is observed to fall within a relatively large range of for 2 SMGs and DOGs (Kovács et al., 2006; Bussmann et al., 2009).
For star-forming galaxies (including bump galaxies and SMGs), there is a general trend for brighter sources to have hotter dust temperatures (which is largely a selection effect for galaxies selected for cold dust emission). PL DOGs typically have hotter dust temperatures than bump DOGs and SMGs. These features are consistent with observations of both high redshift galaxies (e.g., Bussmann et al., 2009; Casey et al., 2009; Younger et al., 2009; Kovács et al., 2006, 2010) and local ULIRGs (e.g., Sanders & Mirabel, 1996). For example, Figure 15 also shows 2 bump ULIRGs from Younger et al. (2009) and Kovács et al. (2010), SMGs from Kovács et al. (2006), and two lower limits from PL DOGs from Bussmann et al. (2009) as black circles, purple triangles, and cyan diamonds, respectively. The ULIRGs from the Younger et al. (2009) sample were selected based on their stellar bump (Huang et al., 2009), and are thus bump galaxies. For the bump ULIRGs of Kovács et al. (2010), we divided the luminosity by a factor of 2 to convert from LIR to , based on the approximate conversion for Mrk 231. Both the bump ULIRGs and SMGs span a similar range in -LIR space as these simulations. Dust temperature determinations for bright PL DOGs will provide a more stringent test of these models as they are expected to show a larger range of dust temperatures than either SMGs or bump galaxies.
6.2.3 The CO Line Widths from DOGs
Narayanan et al. (2008, 2009) found that CO traces the global kinematics of a galaxy. The CO line widths can constrain the masses and dynamical states of galaxies which form DOGs, and thus constitute a testable prediction of these models. For example, while in an isolated disc galaxy, the line width is reflective of the virial velocity of the galaxy. In a merger, the CO linewidths may increase by a factor , owing to multiple galaxies being in the observational beam and the temporary disruption of molecular discs. In this picture, galaxies which owe their origin to mergers will exhibit larger CO line widths than secularly evolving galaxies.
In order to examine the predicted CO line widths from DOGs, we employ turtlebeach, a 3D non-local thermodynamic equilibrium molecular line radiative transfer code (Narayanan et al., 2006, 2008, 2009). turtlebeach is an iterative Monte Carlo code which considers both radiative and collisional processes in determining the molecular excitation (and, hence, source functions), and assumes statistical equilibrium in the levels (Narayanan et al., 2008, 2009). For galaxy-scale simulations, we implement a subgrid procedure for including a mass spectrum of giant molecular clouds as singular isothermal spheres, which follow the Galactic mass spectrum (Rosolowsky, 2005) and mass-radius relationship (e.g., Solomon et al., 1987). Once the level populations have converged from the Monte Carlo code, the equation of radiative transfer is integrated through the grid to build the emergent spectrum.
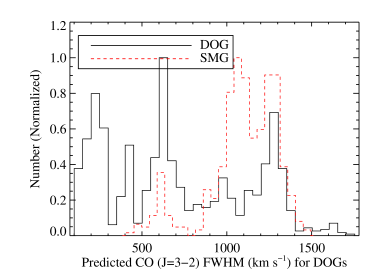
In Figure 16, we plot the range of CO (J=3-2) FWHM for all model galaxies in Table 1 when they classify as a luminous ( 300 Jy) DOG at =2. As a comparison, we plot the CO FWHM from the same model galaxies when they would classify as an SMG ( 5 mJy). The line widths are viewing angle dependent, and, as such, we include the line widths from 100 random sightlines for each model galaxy. The ranges are plotted in histogram form, with each random sightline of each snapshot qualifying as an individual galaxy for the histogram. It is crucial to note that the histogram does not represent a probability distribution function. Rather, the ordinate values are meaningless as the galaxies are not drawn from a cosmological simulation representing true mass functions and merger rates. The robust quantity to take from Figure 16 is the range of predicted CO line widths for DOGs and SMGs.
The line widths from DOGs show a large range, from 100 km s-1 to km s-1. This owes to the fact that both relatively minor mergers (e.g., DOG9) as well as massive major mergers (e.g., DOG1) form DOGs. The former are in a relatively dynamically relaxed state, and can be viewed along some viewing angles in a face-on configuration, causing small line widths. The latter almost always have relatively large line widths. The CO line widths from SMGs, in contrast, are typically quite large, ranging from 500-1500 km s-1. This owes to their origin in massive major mergers (Narayanan et al., 2010). Hence, DOGs which may be in a disc-like configuration at times, are expected to espouse a much larger range of CO line widths than SMGs. Tentative observational evidence suggests that this may indeed be the case (Greve et al., 2005; Tacconi et al., 2006, 2008; Yan et al., 2010).
6.3 Analysis Tools: IR SED Templates
We provide public SED templates of 2 DOGs both to serve as a testable prediction for these models, as well as an analysis tool for forthcoming JWST, Herschel, 1.1mm and ALMA observations. The templates are at model spectral resolution covering 968 wavelengths between approximately 0.3 micron and 3 mm. The SEDs are provided at =2.0, the mean redshift for DOGs, and are calculated utilising every model in the simulation sample. The templates are provided as a function of total infrared luminosity (1-1000 µm). The templates as well as an IDL script to read them in (and redshift them to arbitrary redshifts) may be found at http://www.cfa.harvard.edu/dnarayan/DOG_SED_Templates.html.
7 Discussion
7.1 The Role of DOGs in Galaxy Evolution
The models presented here suggest that the bright DOGs are the result of mergers, whereas the fainter DOGs can have diverse origins. At the high flux density end ( 300 Jy at ), DOGs represent the coalescence phase of massive, gas rich galaxy mergers residing in large ( M☉) halos. Bolometrically, these galaxies are amongst the most luminous at 2, and form stars at rates of SFR 500 M☉yr-1. Forming bulges with masses a few M☉ during the course of their mergers, these galaxies likely are precursors to massive present-day spheroids. These merger-driven DOGs share an intimate link with SMGs, and represent objects actively transitioning between having their IR luminosity dominated by reprocessed stellar radiation to being dominated by a dust-enshrouded AGN. These massive mergers provide a natural avenue for supermassive black hole growth, fueling the growth of M☉ black holes.
The bright DOGs (Jy) typically are undergoing either a starburst (here, roughly 500 M☉yr-1) or contain an actively accreting AGN ( M☉yr-1). These phenomena are most easily achieved via mergers. As was seen in Figure 8, 1:1 mergers are not necessary, and more “minor” mergers (here, 1:3) can form bright DOGs. Given the increasing relative number densities of minor mergers (e.g., Fakhouri & Ma, 2008; Hopkins et al., 2009), it may be that these sorts of mergers dominate bright DOG formation. It is interesting to note that the higher mass-ratio mergers (e.g., 1:10) are not dissimilar qualitatively from galaxies which are accreting massive amounts of cold gas from their parent halo at 2 (e.g., “Stream Fed Galaxies”; Kereš et al., 2005; Birnboim et al., 2007; Dekel et al., 2008, 2009; Kereš et al., 2009).
At lower (24 µm) flux densities (100 Jy), DOGs can result from either galaxy mergers or galaxies undergoing secular evolution, not in any active stage of heightened star formation or AGN activity. These galaxies tend to have lower SFRs (50-100 M☉yr-1), though are of comparable mass as their merging counterparts. In order to be selected as DOGs, these galaxies must be viewed in an edge-on configuration which maximizes the dust reddenning. These galaxies may have overlap with the high redshift BzK population, and (in these simulations) always have their infrared luminosity dominated by star formation. DOGs form a continuum, then, of galaxies, parameterised by their 24 µm luminosity. As such, there is, of course, overlap between merging and non-merging DOG populations in this sequence.
Quantifying the exact number statistics of types of galaxies (e.g galaxy mass, merger mass ratio) in a given luminosity bin requires convolving light curves with cosmological galaxy merger rates, a task that is outside the scope of this paper. That said, these model results do point us toward some understanding of the physical form of DOGs at various luminosities. Figure 8 demonstrates that mergers dominate the high flux density end, whereas isolated disc galaxies contribute to the fainter population. Generically, we can say that the lower flux density DOGs, commonly identified in the deep, narrow field surveys, are likely to be a different breed than higher flux density DOGs which are typically uncovered by the wide-area Spitzer surveys.
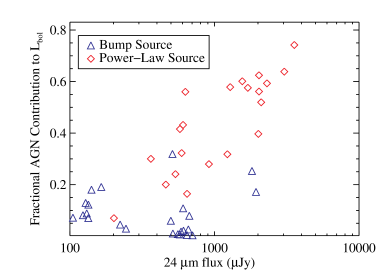
The idea that DOGs have luminosity-dependent physical properties has already been seen in observational data sets. For example, there is some evidence that more luminous DOGs are more likely to harbor AGN. D08 noted that at increasing 24 µm flux densities, a larger fraction of galaxies are X-ray detected and have PL mid-IR SEDs. Similarly, a number of studies have shown that luminous DOGs (Jy) may be Compton thick and contain obscured AGN (Fiore et al., 2008; Fiore et al., 2009; Georgantopoulos et al., 2009; Sacchi et al., 2009). In our simulations, we see that brighter sources have increasing contribution to the bolometric luminosity by AGN (Figure 17). While assessing whether or not these AGN are Compton thick is outside the scope of this work, we can make some crude estimates along these lines. If we assume that the molecular ISM in our simulations is uniformly distributed in the nuclear regions (as is thought to be the case for local mergers; Downes & Solomon, 1998), and not terribly clumpy, then we find some sightlines towards the nucleus may be marginally Compton thick ( cm-2). However, a full investigation assessing the sightline dependence of column densities as well as the assumptions regarding the cold-phase clumping will be necessary to fully address whether these simulated DOGs are Compton thick.
Further evidence for luminosity-dependent physical properties in DOGs comes from Melbourne et al. (2009), who found an increasing concentration and decreasing half-light radius with increasing 24 µm flux density in DOGs. Finally, Brodwin et al. (2008) found that DOGs exhibit luminosity-dependent clustering, such that the most luminous DOGs in their sample (Jy) tend to reside in M☉ halos, while less luminous ( Jy) DOGs are associated with lower mass M☉ halos. All of these are generally consistent with our picture for more luminous DOGs to be represented by high-redshift mergers, and less luminous DOGs displaying less star formation and AGN activity (Figure 17).
8 Summary and Conclusions
Utilising a combination of polychromatic radiative transfer calculations and hydrodynamic simulations of high-redshift galaxy evolution, we have formulated a physical model for the formation and evolution of 2 Dust-Obscured Galaxies. We have utilised the very similar models as those employed in previous studies aimed at investigating the formation and evolution of a similar class of 2 ULIRGS: the Submillimetre Galaxy population.
While the uncertainty in the models is dominated by small-scale physics which is unresolved by the simulations, our methodology allows us to make the following general conclusions regarding the origin of DOGs, and their relationship to other high- ULIRGs:
-
•
DOGs are a diverse class of galaxies, ranging from secularly evolving star-forming disc galaxies (forming stars at 50-100 M☉yr-1) to extreme gas-rich galaxy mergers forming stars at 1000 M☉yr-1.
-
•
The most luminous DOGs ( 300 Jy) are well represented by mergers of massive ( M☉) galaxies. These galaxies are actively transitioning from being starburst dominated to being AGN dominated. At decreasing 24 µm flux densities ( 100 Jy), DOGs may either be galaxy mergers, or secularly evolving disc galaxies with more modest (50-100 M☉yr-1) SFRs.
-
•
Luminous, merger-driven DOGs naturally transition from having a bump-like mid-IR SED to a power-law (PL) shape, as the dominant power source transitions from star formation to the central AGN. That said, there is an overlap period where star-formation dominated sources can appear as PL galaxies.
-
•
The most luminous DOGs assemble both significant stellar masses ( M☉), as well as contribute toward the growth of supermassive ( M☉) black holes.
-
•
Merger-driven DOGs overlap with the 2 Submillimetre Galaxy population. SMGs generally represent the earlier, starburst-dominated phase of the DOGs evolution. This can be tested via the location of SMGs and DOGs on the - relation.
In advance of Herschel, JWST and ALMA, we provide the following testable predictions for our model of DOG formation:
-
•
We quantify the expected range of black hole, H2, stellar, and halo masses for luminous ( 300 Jy) DOGs as well as SMGs.
-
•
We provide dust temperatures for DOGs selected at various 24 µm flux density limits.
-
•
We detail the location of SMGs and bright ( 1 mJy) DOGs on the - relation as a test for the modeled evolutionary scenario that SMGs evolve into PL DOGs.
-
•
We provide a prediction for the CO line widths from DOGs, and suggest that they will be of order the largest observed line widths at high redshift, comparable to 2 SMGs.
Finally, we provide model SED templates for =2 DOGs as a function of total infrared luminosity (LIR= 1-1000 µm). These are provided publicly, along with an IDL script for easily reading in the templates at http://www.cfa.harvard.edu/ dnarayan/DOG_SED_Templates.html
Acknowledgments
We are grateful to Ranga-Ram Chary, Vandana Desai, Brandon Kelly, Kai Noeske, Jason Melbourne and Alex Pope for helpful conversations. D.N. thanks the NOAO in Tucson for hospitality, where part of this study was conducted. The authors are grateful to the W.M. Keck Foundation for hosting the Napa Galaxy Evolution workshop where the ideas for much of this project came about. AD is supported by NOAO, which is operated by the Association of Universities for Research in Astronomy (AURA) under a cooperative agreement with the National Science Foundation. C.C.H. was funded by an NSF Graduate Research Fellowship. T.C. and M.B. acknowledge support from the W.M. Keck Foundation. RSB acknowledges financial assistance from HST grant GO10890, which is provided by NASA through a grant from the Space Telescope Science Institute which is operated by AURA under NASA contract NAS5-26555. PJ was supported by programs HST-AR-10678 and 10958, provided by NASA through a grant from the Space Telescope Science Institute, which is operated by the Association of Universities for Research in Astronomy, Incorporated, under NASA contract NAS5-26555, and by Spitzer Theory Grant 30183 from the Jet Propulsion Laboratory. Support for PFH was provided by the Miller Institute for Basic Research in Science, University of California, Berkeley. The simulations in this paper were run on the Odyssey cluster supported by the Harvard FAS Research Computing Group.
References
- Alexander et al. (2005) Alexander D. M., Bauer F. E., Chapman S. C., Smail I., Blain A. W., Brandt W. N., Ivison R. J., 2005, ApJ, 632, 736
- Alexander et al. (2008) Alexander D. M. et al., 2008, AJ, 135, 1968
- Armus et al. (2007) Armus L., Charmandaris V., Bernard-Salas J. et al., 2007, ApJ, 656, 148
- Barnes & Hernquist (1996) Barnes J. E., Hernquist L., 1996, ApJ, 471, 115
- Barnes & Hernquist (1991) Barnes J. E., Hernquist L. E., 1991, ApJ, 370, L65
- Baugh et al. (2005) Baugh C. M. et al., 2005, MNRAS, 356, 1191
- Birnboim et al. (2007) Birnboim Y., Dekel A., Neistein E., 2007, MNRAS, 380, 339
- Blain et al. (2004) Blain A. W., Chapman S. C., Smail I., Ivison R., 2004, ApJ, 611, 725
- Blitz & Rosolowsky (2006) Blitz L., Rosolowsky E., 2006, ApJ, 650, 933
- Borys et al. (2005) Borys C., Smail I., Chapman S. C., Blain A. W., Alexander D. M., Ivison R. J., 2005, ApJ, 635, 853
- Bouché et al. (2007) Bouché N. et al., 2007, ApJ, 671, 303
- Bournaud et al. (2008) Bournaud F., Daddi E., Elmegreen B. G. et al., 2008, A&A, 486, 741
- Bouwens et al. (2004) Bouwens R. J., Thompson R. I., Illingworth G. D. et al., 2004, ApJ, 616, L79
- Brand et al. (2006) Brand K., Dey A., Weedman D. et al., 2006, ApJ, 644, 143
- Brodwin et al. (2008) Brodwin M., Dey A., Brown M. J. I. et al., 2008, ApJ, 687, L65
- Bullock et al. (2001) Bullock J. S., Kolatt T. S., Sigad Y., Somerville R. S., Kravtsov A. V., Klypin A. A., Primack J. R., Dekel A., 2001, MNRAS, 321, 559
- Bussmann et al. (2009) Bussmann R. S., Dey A., Borys C. et al., 2009, ArXiv e-prints/0909.2650
- Bussmann et al. (2009) Bussmann R. S., Dey A., Lotz J. et al., 2009, ApJ, 693, 750
- Calura et al. (2008) Calura F., Pipino A., Matteucci F., 2008, A&A, 479, 669
- Caputi et al. (2007) Caputi K. I., Lagache G., Yan L. et al., 2007, ApJ, 660, 97
- Casey et al. (2009) Casey C. M., Chapman S. C., Beswick R. J. et al., 2009, MNRAS, pp 1231–+
- Castor et al. (1975) Castor J., McCray R., Weaver R., 1975, ApJ, 200, L107
- Ceverino et al. (2010) Ceverino D., Dekel A., Bournaud F., 2010, MNRAS, pp 440–+
- Chapman & Casey (2009) Chapman S. C., Casey C. M., 2009, MNRAS, 398, 1615
- Chapman et al. (2004) Chapman S. C. et al., 2004, ApJ, 611, 732
- Chapman et al. (2003) Chapman S. C., Windhorst R., Odewahn S., Yan H., Conselice C., 2003, ApJ, 599, 92
- Chary & Elbaz (2001) Chary R., Elbaz D., 2001, ApJ, 556, 562
- Cox et al. (2006) Cox T. J., Jonsson P., Primack J. R., Somerville R. S., 2006, MNRAS, 373, 1013
- Croom et al. (2005) Croom S. M., Boyle B. J., Shanks T. et al., 2005, MNRAS, 356, 415
- Daddi et al. (2008) Daddi E., Dannerbauer H., Elbaz D., Dickinson M., Morrison G., Stern D., Ravindranath S., 2008, ApJ, 673, L21
- Daddi et al. (2004) Daddi E. et al., 2004, ApJ, 617, 746
- Daddi et al. (2005) Daddi E. et al., 2005, ApJ, 631, L13
- Daddi et al. (2009) Daddi E. et al., 2009, ArXiv/0911.2776
- Davé et al. (2009) Davé R., Finlator K., Oppenheimer B. D., Fardal M., Katz N., Kereš D., Weinberg D. H., 2009, MNRAS Accepted: arXiv/0909.4078
- Dekel et al. (2008) Dekel A., Birnboim Y., Engel G. et al., 2008, ArXiv e-prints
- Dekel et al. (2009) Dekel A., Birnboim Y., Engel G. et al., 2009, Nature, 457, 451
- Desai et al. (2009) Desai V., Soifer B. T., Dey A. et al., 2009, ApJ, 700, 1190
- Dey et al. (2009) Dey A. et al., 2009, in W. Wang, Z. Yang, Z. Luo, & Z. Chen ed., Astronomical Society of the Pacific Conference Series Vol. 408 of Astronomical Society of the Pacific Conference Series, The Pedigrees of DOGs (Dust-Obscured Galaxies). pp 411–+
- Dey et al. (2008) Dey A., Soifer B. T., Desai V. et al., 2008, ApJ, 677, 943
- Di Matteo et al. (2005) Di Matteo T., Springel V., Hernquist L., 2005, Nature, 433, 604
- Dickinson et al. (2003) Dickinson M., Papovich C., Ferguson H. C., Budavári T., 2003, ApJ, 587, 25
- Donley et al. (2007) Donley J. L., Rieke G. H., Pérez-González P. G., Rigby J. R., Alonso-Herrero A., 2007, ApJ, 660, 167
- Dopita et al. (2005) Dopita M. A., Groves B. A., Fischera J. et al., 2005, ApJ, 619, 755
- Downes & Solomon (1998) Downes D., Solomon P. M., 1998, ApJ, 507, 615
- Draine & Li (2007) Draine B. T., Li A., 2007, ApJ, 657, 810
- Dwek (1998) Dwek E. 1998, ApJ, 501, 643
- Elmegreen (2009) Elmegreen B. G. 2009, ArXiv e-prints
- Elmegreen & Burkert (2010) Elmegreen B. G., Burkert A., 2010, ApJ, 712, 294
- Elmegreen et al. (2009) Elmegreen D. M., Elmegreen B. G., Marcus M. T., Shahinyan K., Yau A., Petersen M., 2009, ApJ, 701, 306
- Elmegreen et al. (2007) Elmegreen D. M., Elmegreen B. G., Ravindranath S., Coe D. A., 2007, ApJ, 658, 763
- Fakhouri & Ma (2008) Fakhouri O., Ma C.-P., 2008, MNRAS, 386, 577
- Farrah et al. (2008) Farrah D., Lonsdale C. J., Weedman D. W. et al., 2008, ApJ, 677, 957
- Fiore et al. (2008) Fiore F., Grazian A., Santini P. et al., 2008, ApJ, 672, 94
- Fiore et al. (2009) Fiore F., Puccetti S., Brusa M. et al., 2009, ApJ, 693, 447
- Förster Schreiber et al. (2009) Förster Schreiber N. M. et al., 2009, ApJ, 706, 1364
- Genzel et al. (2006) Genzel R. et al., 2006, Nature, 442, 786
- Georgantopoulos et al. (2009) Georgantopoulos I., Akylas A., Georgakakis A., Rowan-Robinson M., 2009, ArXiv e-prints
- Greve et al. (2005) Greve T. R. et al., 2005, MNRAS, 359, 1165
- Groves et al. (2008) Groves B., Dopita M. A., Sutherland R. S., Kewley L. J., Fischera J., Leitherer C., Brandl B., van Breugel W., 2008, ApJS, 176, 438
- Hernquist (1990) Hernquist L. 1990, ApJ, 356, 359
- Hopkins (2004) Hopkins A. M. 2004, ApJ, 615, 209
- Hopkins et al. (2009) Hopkins P. F., Bundy K., Croton D. et al., 2009, ArXiv e-prints
- Hopkins et al. (2005a) Hopkins P. F. et al., 2005a, ApJ, 625, L71
- Hopkins et al. (2005b) Hopkins P. F. et al., 2005b, ApJ, 630, 705
- Hopkins et al. (2006) Hopkins P. F. et al., 2006, ApJS, 163, 1
- Hopkins et al. (2008) Hopkins P. F. et al., 2008, ApJS, 175, 356
- Hopkins & Hernquist (2010) Hopkins P. F., Hernquist L., 2010, MNRAS, 402, 985
- Hopkins et al. (2007) Hopkins P. F., Hernquist L., Cox T. J., Robertson B., Krause E., 2007, ApJ, 669, 45
- Hopkins et al. (2007) Hopkins P. F., Lidz A., Hernquist L., Coil A. L., Myers A. D., Cox T. J., Spergel D. N., 2007, ApJ, 662, 110
- Hopkins et al. (2007) Hopkins P. F., Richards G. T., Hernquist L., 2007, ApJ, 654, 731
- Hopkins et al. (2010) Hopkins P. F., Younger J. D., Hayward C. C., Narayanan D., Hernquist L., 2010, MNRAS, 402, 1693
- Houck et al. (2005) Houck J. R., Soifer B. T., Weedman D. et al., 2005, ApJ, 622, L105
- Huang et al. (2009) Huang J.-S., Faber S. M., Daddi E. et al., 2009, ApJ, 700, 183
- John (1988) John T. L. 1988, A&A, 193, 189
- Jonsson (2006) Jonsson P. 2006, MNRAS, 372, 2
- Jonsson et al. (2006) Jonsson P., Cox T. J., Primack J. R., Somerville R. S., 2006, ApJ, 637, 255
- Jonsson et al. (2010) Jonsson P., Groves B. A., Cox T. J., 2010, MNRAS, pp 186–+
- Juvela (2005) Juvela M. 2005, A&A, 440, 531
- Kennicutt (1998) Kennicutt Jr. R. C. 1998, ApJ, 498, 541
- Kereš et al. (2009) Kereš D., Katz N., Fardal M., Davé R., Weinberg D. H., 2009, MNRAS, 395, 160
- Kereš et al. (2005) Kereš D., Katz N., Weinberg D. H., Davé R., 2005, MNRAS, 363, 2
- Kovács et al. (2006) Kovács A. et al., 2006, ApJ, 650, 592
- Kovács et al. (2010) Kovács A., Omont A., Beelen A. et al., 2010, ArXiv e-prints
- Lacy et al. (2004) Lacy M., Storrie-Lombardi L. J., Sajina A. et al., 2004, ApJS, 154, 166
- Le Floc’h et al. (2005) Le Floc’h E., Papovich C., Dole H. et al., 2005, ApJ, 632, 169
- Leitherer et al. (1999) Leitherer C. et al., 1999, ApJS, 123, 3
- Li & Draine (2001) Li A., Draine B. T., 2001, ApJ, 554, 778
- Li et al. (2007) Li Y., Hernquist L., Robertson B. et al., 2007, ApJ, 665, 187
- Lidz et al. (2006) Lidz A., Hopkins P. F., Cox T. J., Hernquist L., Robertson B., 2006, ApJ, 641, 41
- Lonsdale et al. (2009) Lonsdale C. J., Polletta M. d. C., Omont A. et al., 2009, ApJ, 692, 422
- Lotz et al. (2008) Lotz J. M., Jonsson P., Cox T. J., Primack J. R., 2008, MNRAS, 391, 1137
- Melbourne et al. (2009) Melbourne J., Bussman R. S., Brand K. et al., 2009, AJ, 137, 4854
- Melbourne et al. (2008) Melbourne J., Desai V., Armus L. et al., 2008, AJ, 136, 1110
- Menéndez-Delmestre et al. (2007) Menéndez-Delmestre K., Blain A. W., Alexander D. M. et al., 2007, ApJ, 655, L65
- Menéndez-Delmestre et al. (2009) Menéndez-Delmestre K., Blain A. W., Smail I. et al., 2009, ApJ, 699, 667
- Michałowski et al. (2009) Michałowski M. J., Hjorth J., Watson D., 2009, ArXiv e-prints
- Mihos & Hernquist (1994) Mihos J. C., Hernquist L., 1994, ApJ, 431, L9
- Mihos & Hernquist (1996) Mihos J. C., Hernquist L., 1996, ApJ, 464, 641
- Mo et al. (1998) Mo H. J., Mao S., White S. D. M., 1998, MNRAS, 295, 319
- Murphy et al. (2009) Murphy E. J., Chary R.-R., Alexander D. M., Dickinson M., Magnelli B., Morrison G., Pope A., Teplitz H. I., 2009, ApJ, 698, 1380
- Narayanan et al. (2009) Narayanan D., Cox T. J., Hayward C. C., Younger J. D., Hernquist L., 2009, MNRAS, 400, 1919
- Narayanan et al. (2008) Narayanan D., Cox T. J., Kelly B. et al., 2008, ApJS, 176, 331
- Narayanan et al. (2009) Narayanan D., Hayward C. C., Cox T. J., Hernquist L., Jonsson P., Younger J. D., Groves B., 2009, MNRAS in press: arXiv/0904.0004
- Narayanan et al. (2010) Narayanan D., Hayward C. C., Cox T. J., Hernquist L., Jonsson P., Younger J. D., Groves B., 2010, MNRAS, 401, 1613
- Narayanan et al. (2006) Narayanan D., Kulesa C. A., Boss A., Walker C. K., 2006, ApJ, 647, 1426
- Narayanan et al. (2008) Narayanan D., Li Y., Cox T. J. et al., 2008, ApJS, 174, 13
- Pérez-González et al. (2005) Pérez-González P. G., Rieke G. H., Egami E. et al., 2005, ApJ, 630, 82
- Pope et al. (2008) Pope A., Bussmann R. S., Dey A. et al., 2008, ApJ, 689, 127
- Pope et al. (2008) Pope A., Chary R.-R., Alexander D. M. et al., 2008, ApJ, 675, 1171
- Reddy et al. (2008) Reddy N. A., Steidel C. C., Pettini M., Adelberger K. L., Shapley A. E., Erb D. K., Dickinson M., 2008, ApJS, 175, 48
- Richards et al. (2006) Richards G. T., Lacy M., Storrie-Lombardi L. J. et al., 2006, ApJS, 166, 470
- Rieke et al. (2009) Rieke G. H., Alonso-Herrero A., Weiner B. J., Pérez-González P. G., Blaylock M., Donley J. L., Marcillac D., 2009, ApJ, 692, 556
- Rigby et al. (2004) Rigby J. R., Rieke G. H., Maiolino R. et al., 2004, ApJS, 154, 160
- Robertson et al. (2006) Robertson B., Hernquist L., Cox T. J., Di Matteo T., Hopkins P. F., Martini P., Springel V., 2006, ApJ, 641, 90
- Rosolowsky (2005) Rosolowsky E. 2005, PASP, 117, 1403
- Rudnick et al. (2006) Rudnick G., Labbé I., Förster Schreiber N. M. et al., 2006, ApJ, 650, 624
- Sacchi et al. (2009) Sacchi N., La Franca F., Feruglio C. et al., 2009, ArXiv e-prints
- Sajina et al. (2007) Sajina A., Yan L., Armus L., Choi P., Fadda D., Helou G., Spoon H., 2007, ApJ, 664, 713
- Sakamoto et al. (1999) Sakamoto K. et al., 1999, ApJ, 514, 68
- Sanders & Mirabel (1996) Sanders D. B., Mirabel I. F., 1996, ARA&A, 34, 749
- Sanders et al. (1988) Sanders D. B., Soifer B. T., Elias J. H., Madore B. F., Matthews K., Neugebauer G., Scoville N. Z., 1988, ApJ, 325, 74
- Shaver et al. (1996) Shaver P. A., Wall J. V., Kellermann K. I., Jackson C. A., Hawkins M. R. S., 1996, Nature, 384, 439
- Shen et al. (2007) Shen Y., Strauss M. A., Oguri M. et al., 2007, AJ, 133, 2222
- Shi et al. (2009) Shi Y., Rieke G., Lotz J., Perez-Gonzalez P. G., 2009, ApJ, 697, 1764
- Simpson & Eisenhardt (1999) Simpson C., Eisenhardt P., 1999, PASP, 111, 691
- Soifer et al. (2008) Soifer B. T., Helou G., Werner M., 2008, ARA&A, 46, 201
- Solomon et al. (1987) Solomon P. M., Rivolo A. R., Barrett J., Yahil A., 1987, ApJ, 319, 730
- Springel (2005) Springel V. 2005, MNRAS, 364, 1105
- Springel et al. (2005a) Springel V., Di Matteo T., Hernquist L., 2005a, ApJ, 620, L79
- Springel et al. (2005b) Springel V., Di Matteo T., Hernquist L., 2005b, MNRAS, 361, 776
- Springel & Hernquist (2002) Springel V., Hernquist L., 2002, MNRAS, 333, 649
- Springel & Hernquist (2003) Springel V., Hernquist L., 2003, MNRAS, 339, 289
- Swinbank et al. (2004) Swinbank A. M. et al., 2004, ApJ, 617, 64
- Swinbank et al. (2008) Swinbank A. M. et al., 2008, MNRAS, 391, 420
- Tacconi et al. (2006) Tacconi L. J. et al., 2006, ApJ, 640, 228
- Tacconi et al. (2008) Tacconi L. J. et al., 2008, ApJ, 680, 246
- Tacconi et al. (2010) Tacconi L. J. et al., 2010, Nature, 463, 781
- Tyler et al. (2009) Tyler K. D., Floc’h E. L., Rieke G. H. et al., 2009, ApJ, 691, 1846
- Valiante et al. (2007) Valiante E., Lutz D., Sturm E., Genzel R., Tacconi L. J., Lehnert M. D., Baker A. J., 2007, ApJ, 660, 1060
- Vázquez & Leitherer (2005) Vázquez G. A., Leitherer C., 2005, ApJ, 621, 695
- Vladilo (1998) Vladilo G. 1998, ApJ, 493, 583
- Weedman et al. (2006a) Weedman D. et al., 2006a, ApJ, 653, 101
- Weedman et al. (2006b) Weedman D. W. et al., 2006b, ApJ, 651, 101
- Weingartner & Draine (2001) Weingartner J. C., Draine B. T., 2001, ApJ, 548, 296
- Yan et al. (2005) Yan L., Chary R., Armus L. et al., 2005, ApJ, 628, 604
- Yan et al. (2007) Yan L., Sajina A., Fadda D. et al., 2007, ApJ, 658, 778
- Yan et al. (2010) Yan L., Tacconi L. J., Fiolet N. et al., 2010, ApJ, 714, 100
- Younger et al. (2008a) Younger J. D. et al., 2008a, ApJ, 688, 59
- Younger et al. (2008b) Younger J. D. et al., 2008b, ApJ, 686, 815
- Younger et al. (2009) Younger J. D., Hayward C. C., Narayanan D., Cox T. J., Hernquist L., Jonsson P., 2009, MNRAS, 396, L66
- Younger et al. (2009) Younger J. D., Omont A., Fiolet N. et al., 2009, MNRAS, 394, 1685