The evolution of Black Hole scaling relations in galaxy mergers
Abstract
We study the evolution of black holes (BHs) on the and planes as a function of time in disk galaxies undergoing mergers. We begin the simulations with the progenitor black hole masses being initially below , on and above the observed local relations. The final relations are rapidly established after the final coalescence of the galaxies and their BHs. Progenitors with low initial gas fractions () starting below the relations evolve onto the relations , progenitors on the relations stay there and finally progenitors above the relations evolve towards the relations, but still remaining above them . Mergers in which the progenitors have high initial gas fractions () evolve above the relations in all cases . We find that the initial gas fraction is the prime source of scatter in the observed relations, dominating over the scatter arising from the evolutionary stage of the merger remnants. The fact that BHs starting above the relations do not evolve onto the relations, indicates that our simulations rule out the scenario in which overmassive BHs evolve onto the relations through gas-rich mergers. By implication our simulations thus disfavor the picture in which supermassive BHs develop significantly before their parent bulges.
Subject headings:
galaxies: active — galaxies: evolution — galaxies: interactions — methods: numerical1. Introduction
Observations in recent years have revealed a strong correlation in the local Universe between the central supermassive black holes (BHs) and their host galaxies as manifested in the relation between the BH mass and the bulge velocity dispersion, (e.g. Ferrarese & Merritt, 2000; Tremaine et al., 2002; Gültekin et al., 2009;), the bulge stellar mass (e.g. Magorrian et al., 1998; Häring & Rix, 2004), the concentration of light in the galaxy (e.g. Graham et al., 2001) and the bulge binding energy, (e.g. Aller & Richstone, 2007). The evolution of these relations with redshift is still unclear with some studies finding evolution in the (Woo et al., 2006, 2008) and (Peng et al., 2006; Treu et al., 2007; Decarli et al., 2009) relations, with the high redshift BHs being overmassive for a fixed and compared to the local relations, whereas other studies are consistent with no redshift evolution in the observed correlations (Gaskell, 2009; Jahnke et al., 2009). A possible explanation for this discrepancy lies in the uncertainties in observational selection biases and in the evolution in the intrinsic scatter that is typically stronger for larger BH masses (Lauer et al., 2007).
The observed correlations are typically explained using theoretical models relying on some form of self-regulated BH mass growth, in which gas is fed to the central black hole until the black hole releases sufficient energy to unbind the gas and blow it away in momentum- or pressure-driven winds (e.g. Silk & Rees, 1998; Fabian, 1999; Burkert & Silk, 2001; Ciotti & Ostriker, 2007; Ciotti et al., 2009). The observed correlations and their evolution with redshift have been reproduced in semi-analytic models (e.g. Croton et al., 2006; Somerville et al., 2008), in self-consistent numerical simulations of both isolated galaxies and galaxy mergers (Di Matteo et al., 2005; Springel et al., 2005b; Robertson et al., 2006) as well as in galaxies simulated in a full cosmological setting (Sijacki et al., 2007; Di Matteo et al., 2008; Booth & Schaye, 2009). The key assumption in these models is that the galaxies undergo a brief radiatively-efficient quasar phase triggered by gas-rich galaxy mergers (e.g. Tacconi et al., 2002; Hopkins et al., 2006, 2008) during which the bulk of the BH growth is taking place and the observed correlations are established.
In a previous paper (Johansson et al., 2009, hereafter J09), we showed that the merger remnants of both equal- and unequal-mass mergers of disk and elliptical galaxies satisfy the observed and correlations. In this Letter, we study for the first time in detail the evolution of the BH scaling relations during disk galaxy mergers using a new sample of high resolution simulations including a self-consistent formulation for BH feedback. We seed the BHs initially with masses corresponding to locations below, on and above the observed relations. Thus, in contrast to previous studies we study here for the first time also overmassive BHs lying initially above the observed relations. The BH scaling relations are defined for merger remnants that have reached their final dynamical state and it is not obvious if the scaling relations are valid during the merging process and at what stage the galaxies evolve onto the relations.
| Model | a𝑎aa𝑎aInitial BH mass in | a𝑎aa𝑎afootnotemark: | Mass ratio | b𝑏bb𝑏bFinal BH mass in | c𝑐cc𝑐cFinal stellar velocity dispersion in | d𝑑dd𝑑dFinal bulge mass in | ||||||
| 11B2BH | 1.0 | 1.0 | 1:1 | 25 | 0.2 | 120 000 | 480 000 | 200 000 | 800 000 | 459 | 183.8 | 5.07 |
| 31B2BH | 1.0 | 1.0 | 3:1 | 25 | 0.2 | 80 000 | 320 000 | 133 333 | 533 333 | 271 | 151.8 | 1.90 |
| 31B8BH | 1.0 | 1.0 | 3:1 | 25 | 0.8 | 320 000 | 80 000 | 133 333 | 533 333 | 1136 | 181.6 | 2.97 |
| 31B2BH1 | 1.0 | 1.0 | 3:1 | 100 | 0.2 | 80 000 | 320 000 | 133 333 | 533 333 | 82.5 | 144.7 | 1.26 |
| 11O2BH | 159 | 159 | 1:1 | 25 | 0.2 | 120 000 | 480 000 | 200 000 | 800 000 | 600 | 174.6 | 3.38 |
| 31O2BH | 159 | 36.4 | 3:1 | 25 | 0.2 | 80 000 | 320 000 | 133 333 | 533 333 | 253 | 132.0 | 1.55 |
| 31O8BH | 159 | 36.4 | 3:1 | 25 | 0.8 | 320 000 | 80 000 | 133 333 | 533 333 | 1698 | 155.2 | 3.02 |
| 11A2BH | 477 | 477 | 1:1 | 25 | 0.2 | 120 000 | 480 000 | 200 000 | 800 000 | 1200 | 164.2 | 3.35 |
| 31A2BH | 477 | 109 | 3:1 | 25 | 0.2 | 80 000 | 320 000 | 133 333 | 533 333 | 652 | 128.7 | 1.59 |
| 31A8BH | 477 | 109 | 3:1 | 25 | 0.8 | 320 000 | 80 000 | 133 333 | 533 333 | 842 | 122.3 | 1.21 |
2. Simulations
The simulations were performed using the TreeSPH-code GADGET-2 (Springel, 2005) on the local Altix 3700 Bx2 machine. The code includes radiative cooling for a primordial composition of hydrogen and helium. Star formation and the associated supernova feedback is included using the sub-resolution model of Springel & Hernquist (2003). In this model the ISM is treated as a two-phase medium (McKee & Ostriker, 1977; Johansson & Efstathiou, 2006) in which cold clouds are embedded in a tenuous hot gas at pressure equilibrium. BH feedback is modeled using the Springel et al. (2005b) effective model in which the BH sink particles accrete gas from the surrounding medium according to a Bondi-Hoyle-Lyttleton parametrization
| (1) |
with the maximum accretion rate set by the Eddington limit. Here and are the density and sound speed of the surrounding gas, respectively, is the velocity of the BH relative to the surrounding gas and is a dimensionless efficiency parameter. Following J09 a total of 0.5% of accreted the rest mass energy is then injected as thermal energy into the gas surrounding the BH particle. Throughout this paper we use the BH repositioning method that ensures rapid merging of the BHs once the two BHs reside in the same parent galaxy. We assume that the BHs merge instantly if they enter the smoothing length of each other and if their relative velocity is below the local sound speed.
The progenitor galaxies are setup following the method of Springel et al. (2005b) and as detailed in J09 with all primary galaxies having , corresponding to a virial mass of 111 is defined such that analogous to the Milky Way. The dark matter profiles in all model galaxies are described by a Hernquist (1990) profile constructed using the concentration parameter of the corresponding NFW halo (Navarro et al., 1997). The dark matter halos are populated with exponential disks with a baryonic mass fraction of and a stellar Hernquist bulge with a fraction of the total virial mass, . The disk is setup with a fractional gas content of , with the rest being disk stars, with the scale lengths of the disk and bulge computed as detailed in J09. The secondary models in the unequal-mass mergers are identical to the primary models, except for the fact that all components are scaled down in mass by a factor of three.
In setting up the primary galaxy disks we use a relatively high numerical resolution of 300,000 disk particles of which a fraction are gaseous, 100,000 bulge particles and 400,000 dark matter particles. Each gas particle can only spawn a single stellar particle resulting in a constant particle mass resolution of for all baryonic particles and for the dark matter particles. The gravitational softening length was set to for all baryonic particles and the BHs and to for the dark matter particles. Finally we insert a seed black hole at rest in the center of each galaxy model, where we vary the BH mass depending on if the models should lie initially below (B-series), on (O-series) or above (A-series) the observed local BH scaling relations.
We adopt orbital geometry G13 (Naab & Burkert, 2003) for all simulations in this paper. This geometry corresponds to the inclinations and the arguments of the pericenter for the primary and secondary galaxies, respectively. The galaxies approach each other on a parabolic orbit where the initial separation of the progenitors is and the pericentric distance is , where , and , are the virial and disk scale radii for the primary and secondary galaxies, respectively. All simulations were evolved for a total of with the merger typically taking place at . The main numerical parameters and final properties of all 10 simulations are summarized in Table 1.
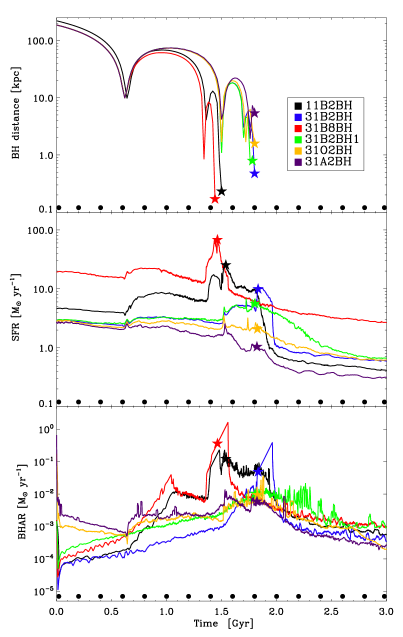
The parameters governing the multi-phase feedback are as detailed in J09 resulting in a star formation rate (SFR) of for our primary galaxy. The accretion parameter (Eq. 1) can essentially be seen as an empirical correction factor that translates from the resolvable low mean density to the time-averaged small-scale density at the location of the BH. We found that for the BHs reach Eddington limited mass growth during the merger. This is not the case for the value used in J09 (see Fig. 1). The corresponding evolution on the plane is such that the 3B2BH1 simulation does not evolve onto the relation, whereas the 3B2BH evolves onto the relations reproducing the lower resolution results from J09 (see Fig. 2). We conclude that as the spatial resolution in the simulations is increased the corresponding value needs to be decreased in order to reproduce the lower resolution runs. Thus, we adopt for all subsequent simulations. Finally, we note that our results do not depend critically on as long as the condition of Eddington limited mass growth during the merger is fulfilled.
3. Methodology
We plot in Fig. 1 the relative distance between the BHs, the total SFR and the total BH accretion rate for a subsample of six simulations. In addition, we overplot filled circles at time intervals of throughout the 3 Gyr simulation indicating the time at which the galaxies are extracted for analysis. This gives a total of 16 snapshots during the merger. We perform the analysis using all stellar particles found in a sphere with a radius of centered on the BH of the corresponding galaxy. The repositioning technique employed in this study ensures that the BHs always trace the highest density central structure of their parent halo.
The inclusion of a massive BH initially has a marked effect on the star formation and BH accretion histories of the mergers (see Fig. 1). The higher the initial BH masses the lower the resulting SFRs are throughout the merger. The SFRs are suppressed by a factor of in the O-series and a factor of in the A-series simulations compared to the B-merger series. In addition, massive BHs suppress the peak BH accretion rate during final coalescence by a factor of .
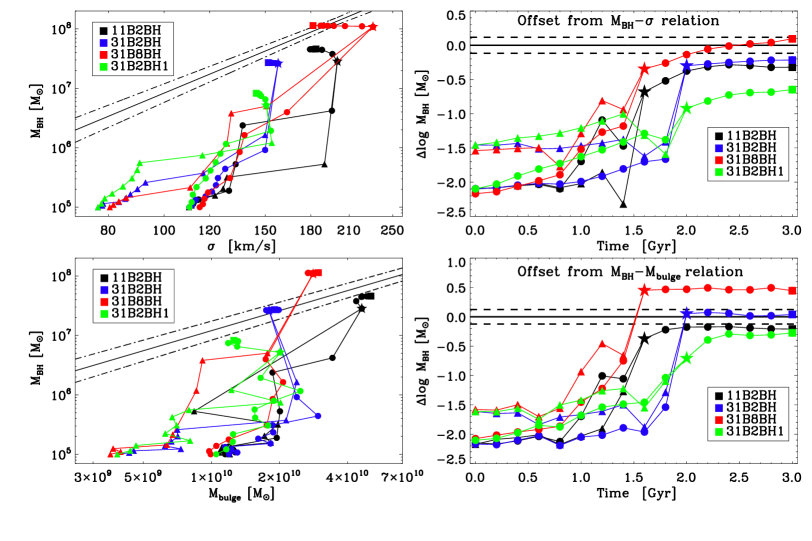
Following observational estimates we calculate from each snapshot the line-of-sight stellar velocity dispersion inside the effective radius using 50 randomly projected realizations of the galaxies. Together with the extracted BH masses we then plot the evolution of the BHs during the mergers on the plane (top left panels in Figs. 2-4). Here we also overplot the observed local relation (, , , , Tremaine et al., 2002) as a solid line with the dashed lines indicating the errors. In the top right-hand panels of Figs. 2-4 we calculate as a function of time the relative offset of the simulated BH masses from the ones predicted by the relation defined as,
| (2) |
where a positive indicates an overmassive and a negative an undermassive BH with respect to the observed correlation (the relation in this instance). The dashed lines in the plots give the mean error in the velocity dispersion range probed by our simulations.
In the bottom panels of Figs. 2-4 we plot the evolution of the BHs on the plane, with the total bulge masses derived following the method outlined in Naab & Trujillo (2006). Artificial images smoothed with a Gaussian filter were created of every snapshot seen from 50 random projections by binning the central 30 kpc into 128x128 pixels. We then fit both a pure Sérsic as well as an exponential disk and Sérsic bulge component simultaneously . Here are the effective radii and the Sérsic indices of the bulge component, is the scale length of the disk, are the central surface densities and is chosen so that encloses half the total mass. We then solve for the best fit bulge-to-total (B/T) ratio for each projection and give the total stellar bulge mass as the mean of the best fit values. In addition, we overplot the observed local relation with errors , , , Häring & Rix, 2004) together with the corresponding evolution of as a function of time in the bottom right panels.
4. Results
4.1. Mergers with starting below the relations
We plot in Fig. 2 the evolution of our B-merger sample on the planes of the two BH scaling relations. For this sample the initial BH mass is always set to similarly to J09 and thus rendering the BH initially dynamically unimportant.
All models show initially relatively modest evolution towards the observed relations, with the first passage at primarily only seen as a mild increase in and . In the phase when the galaxies are falling back towards the second encounter both and are increasing more rapidly, due to stronger merger-induced tidal disturbances. After the second encounter the galaxies rapidly merge within , with the shorter timescales corresponding to the equal-mass merger and the merger with the higher initial gas fraction of (see Fig. 1).
This evolution is qualitatively similar to the early results of Naab et al. (2006); Dasyra et al. (2006), who found that the velocity dispersion increases primarily in two phases, with mild increase after the first encounter and very rapid evolution at the time of the coalescence. In Dasyra et al. (2006) the authors also conjectured that the BHs would fall on the already after the first encounter if a constant fraction of 1% of the central gas supply would be accreted onto the BH. However, these early studies were purely hydrodynamical, lacking self-consistent BH growth and feedback.
We find that although the BHs evolve towards the relation during the merger, the final relations are only established at the time of the final coalescence of the BHs. Typically the velocity dispersions of the remnants are somewhat too large immediately after the merger. The effective velocity dispersion then slowly decreases due to some low-level residual star formation with the stars preferentially settling in a disk-like structure, with this effect being stronger in high-gas fraction mergers. However, this effect is less strong in low-gas fraction and low mass ratio mergers, as star formation and BH mass growth are more strongly terminated in these mergers after final coalescence (Fig. 1, see also Springel et al., 2005a; Johansson et al., 2008). On the other hand, we find that the bulge mass is established on a short timescale immediately after coalescence with the pre-coalescence bulge mass typically being markedly lower.
The prime driver for the scatter is caused by the initial gas fraction of the progenitor galaxies, with the scatter produced by the evolutionary stage of the merger remnants after the final coalescence being only a secondary effect, as can be seen in the relatively modest evolution between coalescence (star symbols) and the final merger remnant state (square symbols).
4.2. Mergers with starting on the relations
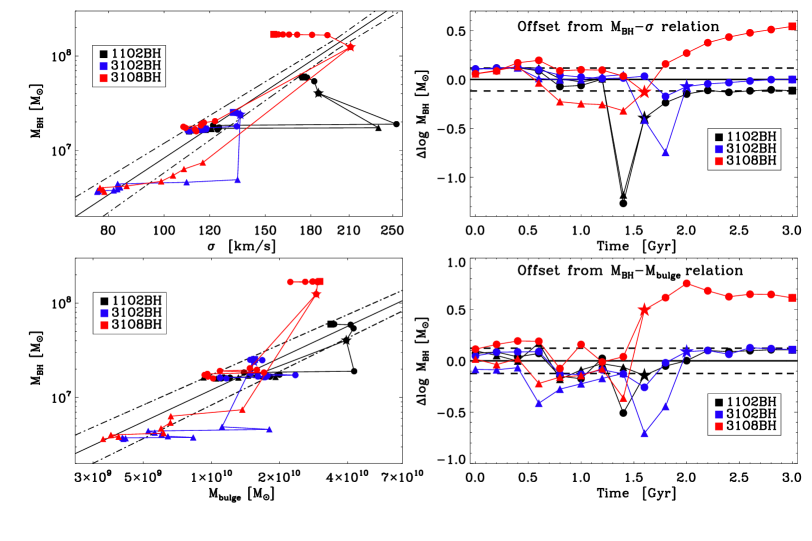
In Fig. 3 we study the evolution of the O-merger sample, for which we set the initial seed BH mass such that the model galaxies lie on the observed relations .
Both the primary and secondary galaxies in the mergers typically evolve initially along the observed relations, but after the first encounter before final coalescence the secondary galaxy typically evolves horizontally off the relations, again due to the tidal disturbances after the first passage (Fig. 3). However, after the merging of the BHs all remnants again evolve rapidly onto the relations, with the exception of the high gas fraction merger, which evolves off the relation. Thus for progenitors with initially low gas fractions () the BH feedback is able to self-regulate the growth of the BHs maintaining them on the relation. For very high gas fractions the BH growth is too efficient with the self-regulation being unable to maintain the galaxies on the observed relations.
4.3. Mergers with starting above the relations
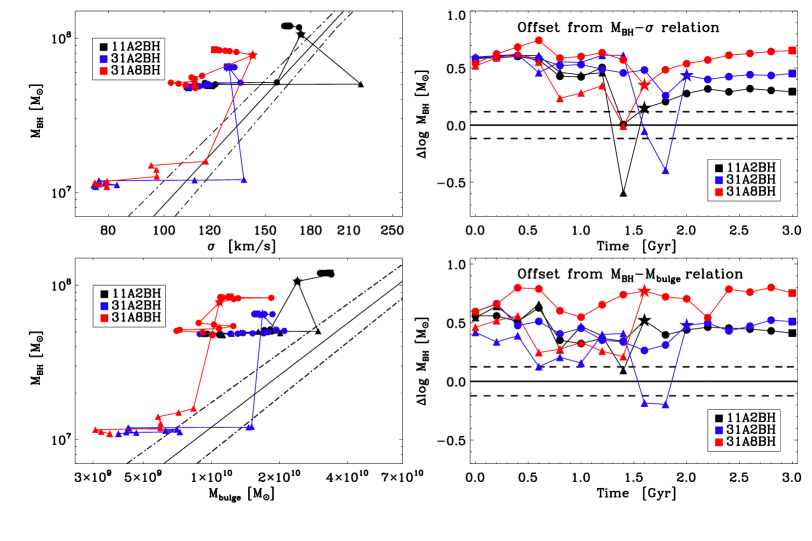
Finally, motivated by the observations of Woo et al. (2006, 2008) we run simulations in which the BHs were initially overmassive by a factor of three .
The evolution of this A-merger sample is shown in Fig. 4. Again we see initially weak evolution with the initial offset maintained, but after the first encounter the secondary BH evolves horizontally towards the observed relation and in some instances even below the relations. After the merger all remnants again evolve above the relations. However, the final merger remnants of the low gas fraction () simulations have a lower offset by dex compared to the initial state. This effect is stronger in the 1:1 merger, which is experiencing a more violent encounter, with more gas channeled to the center and thus stronger self-regulation of the BH. The high gas fraction merger () on the other hand evolves even further away from the observed relations increasing the offset typically by dex.
5. Discussion
In this Letter, we have studied the evolution of galaxy mergers on the and planes as a function of time. We have shown that progenitors with low initial gas fractions () starting below the relations evolve onto the relations, progenitors on the relations stay there and progenitors above the relations evolve towards the relations, but still remaining above them. Progenitors with high initial gas fractions () evolve above the relations in all cases, with the initial gas fraction thus being the prime source of scatter in the observed relations (see also Hopkins et al. 2007). The evolution for all mergers is initially slow with the observed relations typically being rapidly established during a relatively short phase centered at the time of final coalescence of the BHs.
The observations of Woo et al. (2006, 2008) indicate that the BHs at high redshifts were typically overmassive by a factor of for a fixed and compared to the local relation. These BHs could plausibly have been formed during a brief quasar phase (e.g. Hopkins et al., 2006) triggered during the mergers of very gas-rich galaxies, thus resulting in overmassive BH masses for their given and , as seen in our simulation series. However, this being the case it is not obvious how these galaxies would evolve onto the local observed relations until the present day. Another binary merger with massive BHs in place does not bring the galaxies onto the relations (O- and A-series), with high gas fractions mergers moving them even further away from the relations. Potentially, the bulge mass could be increased by dry minor mergers (e.g. Naab et al., 2009), whereas internal secular processes could be responsible for increasing the velocity dispersion. However, it is not obvious how both the velocity dispersion and the bulge mass could be increased at a fixed BH mass. Finally, another possibility could be that some of the BHs undergoing mergers are ejected in a sling-shot effect (Saslaw et al., 1974), thus decreasing the total BH mass.
The fact that the BHs starting below the relations evolve onto the relation, whereas the ones above do not, indicates that our simulations rule out the scenario in which overmassive BHs evolve onto the relations through gas-rich mergers, whereas undermassive BHs can evolve onto the relations in galaxy mergers. Thus, given the numerical limitations inherit in our simulations, our results disfavor the picture in which supermassive BHs develop significantly before their parent bulges.
Finally, our current BH accretion and feedback prescription seems to describe the growth of BH during the merger phase adequately. However, it is not obvious that the present description is also valid during the secularly driven low accretion phase after the merger is completed. Some initial steps to improve the prescription have been taken by developing an entirely new momentum driven feedback prescription (DeBuhr et al., 2009). Recent observations (Schawinski et al., 2007, 2009) have indicated that there is a time lag of between the peak of star formation and the onset of AGN activity. Our current model has difficulties in reproducing this and thus developing models that shed light on this discrepancy might also ultimately help us understanding in how, when and why the BHs in galaxies evolve onto the observed relations.
References
- Aller & Richstone (2007) Aller, M. C. & Richstone, D. O. 2007, ApJ, 665, 120
- Booth & Schaye (2009) Booth, C. M. & Schaye, J. 2009, MNRAS, 398, 53
- Burkert & Silk (2001) Burkert, A. & Silk, J. 2001, ApJ, 554, L151
- Ciotti & Ostriker (2007) Ciotti, L. & Ostriker, J. P. 2007, ApJ, 665, 1038
- Ciotti et al. (2009) Ciotti, L., Ostriker, J. P., & Proga, D. 2009, ApJ, 699, 89
- Croton et al. (2006) Croton, D. J., et al., 2006, MNRAS, 365, 11
- Dasyra et al. (2006) Dasyra, K. M., et al., 2006, ApJ, 651, 835
- DeBuhr et al. (2009) DeBuhr, J., Quataert, E., Ma, C.-P., & Hopkins, P. 2009, ArXiv e-prints, arXiv:0909.2872
- Decarli et al. (2009) Decarli, R., et al., 2009, MNRAS in press, ArXiv e-prints, arXiv:0911.2988
- Di Matteo et al. (2008) Di Matteo, T., Colberg, J., Springel, V., Hernquist, L., & Sijacki, D. 2008, ApJ, 676, 33
- Di Matteo et al. (2005) Di Matteo, T., Springel, V., & Hernquist, L. 2005, Nature, 433, 604
- Fabian (1999) Fabian, A. C. 1999, MNRAS, 308, L39
- Ferrarese & Merritt (2000) Ferrarese, L. & Merritt, D. 2000, ApJ, 539, L9
- Gaskell (2009) Gaskell, C. M. 2009, ArXiv e-prints, arXiv:0908.0328
- Graham et al. (2001) Graham, A. W., Erwin, P., Caon, N., & Trujillo, I. 2001, ApJ, 563, L11
- Gültekin et al. (2009) Gültekin, K., et al., 2009, ApJ, 698, 198
- Häring & Rix (2004) Häring, N. & Rix, H.-W. 2004, ApJ, 604, L89
- Hernquist (1990) Hernquist, L. 1990, ApJ, 356, 359
- Hopkins et al. (2006) Hopkins, P. F., Hernquist, L., Cox, T. J., Di Matteo, T., Robertson, B., & Springel, V. 2006, ApJS, 163, 1
- Hopkins et al. (2007) Hopkins, P. F., Hernquist, L., Cox, T. J., Robertson, B., Krause, E., 2007, ApJ, 669, 45
- Hopkins et al. (2008) Hopkins, P. F., Hernquist, L., Cox, T. J., & Kereš, D. 2008, ApJS, 175, 356
- Jahnke et al. (2009) Jahnke, K., et al., 2009, ApJ, 706, L215
- Johansson & Efstathiou (2006) Johansson, P. H. & Efstathiou, G. 2006, MNRAS, 371, 1519
- Johansson et al. (2008) Johansson, P. H., Naab, T., & Burkert, A. 2008, Astronomische Nachrichten, 329, 956
- Johansson et al. (2009) —. 2009, ApJ, 690, 802
- Lauer et al. (2007) Lauer, T. R., Tremaine, S., Richstone, D., & Faber, S. M. 2007, ApJ, 670, 249
- Magorrian et al. (1998) Magorrian, J., et al., 1998, AJ, 115, 2285
- McKee & Ostriker (1977) McKee, C. F. & Ostriker, J. P. 1977, ApJ, 218, 148
- Naab & Burkert (2003) Naab, T. & Burkert, A. 2003, ApJ, 597, 893
- Naab et al. (2006) Naab, T., Jesseit, R., & Burkert, A. 2006, MNRAS, 372, 839
- Naab et al. (2009) Naab, T., Johansson, P. H., & Ostriker, J. P. 2009, ApJ, 699, L178
- Naab & Trujillo (2006) Naab, T. & Trujillo, I. 2006, MNRAS, 369, 625
- Navarro et al. (1997) Navarro, J. F., Frenk, C. S., & White, S. D. M. 1997, ApJ, 490, 493
- Peng et al. (2006) Peng, C. Y., et al., 2006, ApJ, 649, 616
- Robertson et al. (2006) Robertson, B., et al., 2006, ApJ, 641, 90
- Saslaw et al. (1974) Saslaw, W. C., Valtonen, M. J., Aarseth, S. J., 1974, ApJ, 190, 253
- Schawinski et al. (2007) Schawinski, K., et al., 2007, MNRAS, 382, 1415
- Schawinski et al. (2009) Schawinski, K., et al., 2009, ApJ, 692, L19
- Sijacki et al. (2007) Sijacki, D., Springel, V., di Matteo, T., & Hernquist, L. 2007, MNRAS, 380, 877
- Silk & Rees (1998) Silk, J. & Rees, M. J. 1998, A&A, 331, L1
- Somerville et al. (2008) Somerville, R. S., Hopkins, P. F., Cox, T. J., Robertson, B. E., & Hernquist, L. 2008, MNRAS, 391, 481
- Springel (2005) Springel, V. 2005, MNRAS, 364, 1105
- Springel et al. (2005a) Springel, V., Di Matteo, T., & Hernquist, L. 2005a, ApJ, 620, L79
- Springel et al. (2005b) —. 2005b, MNRAS, 361, 776
- Springel & Hernquist (2003) Springel, V. & Hernquist, L. 2003, MNRAS, 339, 289
- Tacconi et al. (2002) Tacconi, L. J., et al., 2002, ApJ, 580, 73
- Tremaine et al. (2002) Tremaine, S., et al., 2002, ApJ, 574, 740
- Treu et al. (2007) Treu, T., Woo, J.-H., Malkan, M. A., & Blandford, R. D. 2007, ApJ, 667, 117
- Woo et al. (2006) Woo, J.-H., Treu, T., Malkan, M. A., & Blandford, R. D. 2006, ApJ, 645, 900
- Woo et al. (2008) —. 2008, ApJ, 681, 925