Excitation of Trapped Waves in Simulations of Tilted Black Hole Accretion Disks with Magnetorotational Turbulence
Abstract
We analyze the time dependence of fluid variables in general relativistic, magnetohydrodynamic simulations of accretion flows onto a black hole with dimensionless spin parameter . We consider both the case where the angular momentum of the accretion material is aligned with the black hole spin axis (an untilted flow) and where it is misaligned by (a tilted flow). In comparison to the untilted simulation, the tilted simulation exhibits a clear excess of inertial variability, that is, variability at frequencies below the local radial epicyclic frequency. We further study the radial structure of this inertial-like power by focusing on a radially extended band at found in each of the three analyzed fluid variables. The three dimensional density structure at this frequency suggests that the power is a composite oscillation whose dominant components are an over dense clump corotating with the background flow, a low order inertial wave, and a low order inertial-acoustic wave. Our results provide preliminary confirmation of earlier suggestions that disk tilt can be an important excitation mechanism for inertial waves.
Subject headings:
accretion, accretion disks — black hole physics — MHD — turbulence — waves — X-rays: binaries1. Introduction
Quasi-periodic oscillations (QPOs) are observed in the X-ray light curves of many black hole X-ray binaries (see Remillard & McClintock 2006 for a recent review). They have also been observed in extragalactic ultraluminous X-ray sources (Strohmayer & Mushotzky, 2003; Strohmayer et al., 2007) and in one active galactic nucleus (Gierliński et al., 2008). The origin of these phenomena is still far from clear. One class of models centers on trapped wave modes within the accretion flow. In particular, a variety of modes have been proposed in hydrodynamic models of geometrically thin accretion disks (e.g. Wagoner 1999; Kato 2001). Axisymmetric inertial-acoustic modes (“-” or “inner -modes”) and axisymmetric inertial modes (“-” or “-modes”) 111Throughout this paper we will use the term inertial mode and -mode interchangeably. We prefer to avoid the use of the term -mode, whose primary restoring force is generally due to entropy gradients. In disks, the primary restoring force for inertial modes is due to specific angular momentum gradients. can be trapped due to the existence of the innermost stable circular orbit around a black hole, which produces a maximum in the radial profile of the radial epicyclic frequency. Non-axisymmetric inertial modes can also be radially trapped between inner and outer Lindblad resonances.
The very existence of inertial modes in accretion disks has been challenged recently, as numerical simulations appear to show that magnetorotational (MRI) turbulence suppresses them. This has been demonstrated in local shearing box simulations (Arras et al., 2006), whose boundary conditions would artificially trap a discrete axisymmetric mode spectrum. Power spectra from these simulations show discrete acoustic modes and a radial epicyclic oscillation, but no inertial modes. This behavior has also been seen in global simulations of accretion disks in a pseudo-Newtonian potential: hydrodynamic disks exhibit trapped axisymmetric inertial modes, whereas MHD turbulent disks do not (Reynolds & Miller, 2008). It appears that axisymmetric inertial modes, which necessarily have frequencies at or below the local radial epicyclic frequency, are particularly vulnerable to nonlinear damping by MRI turbulence, which has a power spectrum that peaks near the orbital frequency. Non-axisymmetric inertial modes can have higher frequencies and might be less vulnerable to MRI turbulence, but there has as yet been no convincing demonstration of the existence of a trapped inertial mode spectrum in any MHD simulation.
Another reason why discrete inertial modes may not be present in accretion disks with MRI turbulence is that even subthermal magnetic fields can extend the inner trapping radius of the propagation zone of both axisymmetric and non-axisymmetric inertial modes down to the innermost stable circular orbit (ISCO) (Fu & Lai, 2009). Unless inertial waves can reflect off the plunging region of the flow, standing waves will no longer be sustainable.
On the other hand, it has been suggested that warps and eccentricity in disks may play a fundamental role in a nonlinear excitation mechanism of inertial modes in geometrically thin accretion disks (Kato, 2004a, 2008; Ferreira & Ogilvie, 2008). These large scale deformations interact with trapped -modes giving rise to intermediate modes. These intermediate modes then couple back to the warp or eccentricity to produce positive feedback on the original -mode oscillations (see Ferreira & Ogilvie 2008 for a more detailed explanation of this coupling mechanism).
Fragile et al. (2007) recently completed fully general relativistic, MHD simulations of accretion disks with misaligned black hole spin and disk angular momentum vectors (“tilted disks”). These tilted disks are strongly warped near the black hole and exhibit global epicyclic oscillations superimposed on the turbulence in the flow (Fragile & Blaes, 2008). These oscillations manifest themselves as eccentric orbits of fluid elements in the disk, albeit with a flip in orientation of the elliptical orbits across the midplane of the disk. Tilted disks may therefore provide favorable conditions for the nonlinear excitation of inertial modes.
Here we report the results of a search for trapped modes in simulations of both an untilted and tilted disk. In agreement with previous work, we do not observe the presence of modes in the untilted simulation. However, at the same numerical resolution, we observe significant excess power with frequencies characteristic of inertial waves in the tilted disk. Because of the complexity of the background flow, the physical nature of this power is difficult to determine. Nevertheless, its spatial structure appears to confirm that this is partly inertial in character. This may represent preliminary confirmation of the warp/eccentricity excitation mechanism, showing that it can be strong enough to overcome damping due to MRI turbulence. It also shows that trapping, in the sense of radial localization of power, can be maintained even in the presence of magnetic fields.
This paper is organized in the following manner. In section 2 we briefly review the simulation parameters and discuss our power spectrum analysis of the simulation data. Section 3 presents power spectra from both untilted and tilted geometries, evidence that the latter may be dominated by inertial-like variability, and an analysis of the three dimensional structure of the power at a particular frequency within this inertial regime. We summarize our conclusions in section 4.
2. Simulations and Time Series Analysis
We analyze the two high resolution simulations of Fragile et al. (2007) and Fragile & Blaes (2008): an untilted simulation (90h) with the initial fluid angular momentum aligned with the spin axis of the Kerr black hole, and a simulation (915h) with the initial fluid angular momentum tilted by relative to the spin axis of the hole. The black hole spacetime in each simulation is described using Kerr-Schild coordinates, and has a spin parameter . Apart from the tilt, both simulations start with identical initial conditions: a torus with pressure maximum centered at , where , seeded with weak poloidal magnetic field loops that follow the equipressure surfaces. Both simulations evolve the disk through ten test particle orbital periods calculated at the initial pressure maximum (a time unit hereafter generically referred to as an “orbit”).
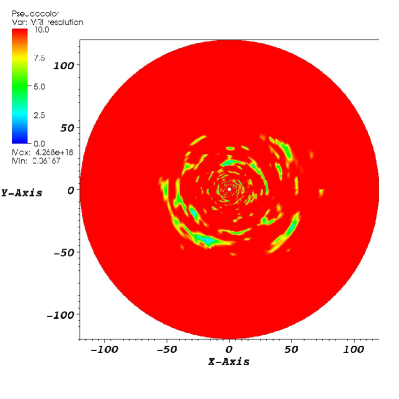
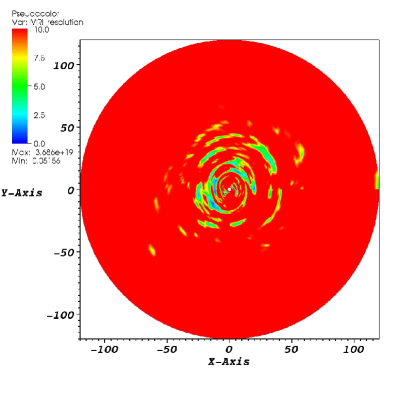
Again apart from the tilt, these simulations run on essentially the same nested grids with equivalent peak resolution of zones realized throughout the bulk of the simulation domain. These grids have sufficient spatial resolution at all radii to reasonably capture the MRI. As discussed in Stone et al. (1996), several grid zones are required per critical MRI wavelength (, where is the Alfvén velocity, is the square of the magnetic field, is the fluid mass density, and is the local orbital frequency) to ensure a convergent treatment of the instability and associated turbulence. As illustrated in figure 1, there are at least grid zones per critical wavelength, apart from small, isolated, transient patches where the field is weak.
We restrict our analysis to a poloidal sector of grid zones within of the original outer torus midplane at all radii and azimuthal angles. Within this region, we uniformly sample fluid variables at each grid zone times per orbit (that is, times per orbital period of the direct ISCO on the black hole equatorial plane). Our timing analysis begins four orbital periods after the start of each simulation to ensure fully developed accretion and MRI turbulence, then extends for six additional orbits.
We study the time variation of three fluid variables, namely, the rest mass density as measured in the fluid’s rest frame and the radial and poloidal components of the 3-velocity: and . Here, are the general relativistic 4-velocity components expressed in tilted Kerr-Schild coordinates (Fragile et al., 2007), measured at zone centers.
We search for quasi-periodic activity in these variables through analysis of radially dependent temporal power spectra. The three variables are measured in each grid zone at regular time intervals, and linear secular changes are subtracted from the zone’s time series as in Schnittman et al. (2006). Other authors have used more elaborate and physically-motivated fitting functions to accomplish this “pre-whitening.” For example, Reynolds & Miller (2008) advocate exponential forms because of the secular spreading of mass within the disk which, in our simulation and depending on the location of a given cell with respect to the initial torus, can act to increase or decrease density. On the other hand, in a tilted configuration, another significant secular change is Lense-Thirring precession with a period of roughly orbits. In the six analyzed orbits, the disk’s angular momentum vector precesses roughly about the black hole’s spin axis. This precession induces some fraction of the full period of a sinusoidal modulation at the precession frequency. Whether this results in an increase or decrease in density is determined by the location of the given zone with respect to the initial torus. Since these two effects are completely independent of each other and can act to either increase or decrease the local density, it is possible for the two to act in opposition. We employ, therefore, a simpler linear (i.e. model-independent) fit to remove secular changes. Finally, these pre-whitened time series are windowed using a Bartlett window, zero padded and fast Fourier transformed to produce the zones’ raw spectra (Press et al., 1992).
In calculating the final radially dependent, temporal power spectrum, we average our spectra on shells of constant coordinate radius and divide by appropriate background scaling factors to enhance the radial contrast between features using physically relevant scales. Symbolically,
| (1) | |||||
where , , and are the pre-whitened, windowed, padded, and Fourier transformed fluid variables as functions of space and frequency. The weight factors and are the mean square density and squared average sound speed, , respectively. The radial profiles of these weight factors are shown in figure 2. We choose the sound speed as an appropriate scaling speed for both acoustic and inertial modes because both mode types involve fluid oscillations with vertical structure of order the disk scale height, , and frequencies comparable to the orbital frequency, . Thus, the relevant velocity scale is which, by vertical hydrostatic equilibrium, is approximately equal to the sound speed.


3. Results
Figure 3 depicts the radial power spectrum in the untilted and tilted simulations. In the untilted simulation, three spectral features are prominent. First, high power at large radii in all variables reflects artificially enhanced variability by the extremely low background density and sound speed weight factors in those regions (see figure 2). Very little material is present in these regions since the simulated time period is short when compared with the diffusion time required to spread the disk to such large radii.
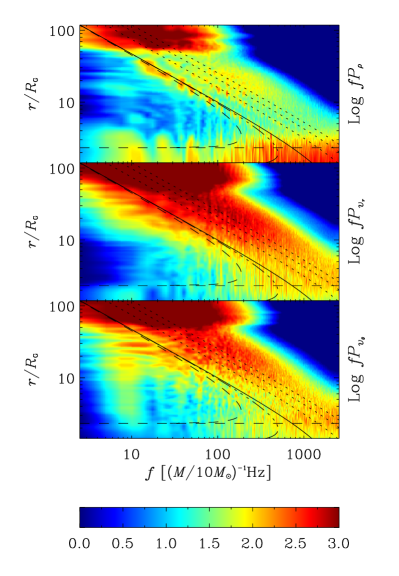
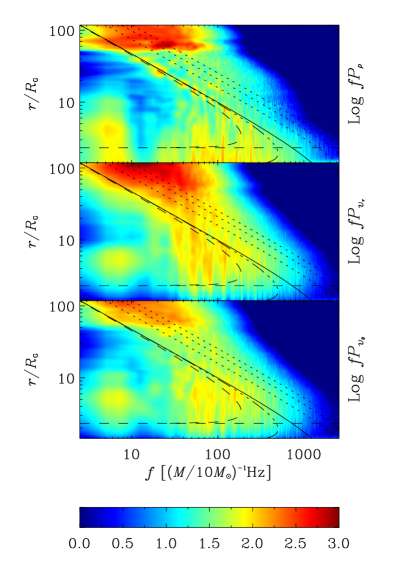
Second, density variability at high frequencies near and within the ISCO is present. We do not fully understand this behavior. Similar variability seems absent in this simulation’s velocity variables and, as will be discussed later, in all three variables in the tilted simulation. This suggests that the feature is physical (i.e. it is not a relic of the Fourier transform procedure) and reflects a fundamental difference in the accretion flow between the two disk configurations. For a detailed comparison of the titled and untilted flow patterns, see Fragile et al. (2007).
Third, significant power tracks the orbital frequency (or, arguably, the vertical epicyclic frequency) in the density spectrum. Reynolds & Miller (2008) suggest that this power is a result of local vertical epicyclic oscillations and would predict higher order acoustic oscillations with frequencies
| (2) |
where is a vertical quantum number, is the adiabatic index (which is in our simulations), and is the vertical epicyclic frequency (Blaes et al., 2006).222Note that for our Kerr spacetime, in contrast to the pseudo-Newtonian spacetime used by Reynolds & Miller (2008). Their simulations did, in fact, exhibit modes with frequencies with , because they employed an isothermal vertical profile with an adiabatic equation of state. Our simulations are better described by an adiabatic profile and equation of state, thus acoustic waves should obey the dispersion relation 2.
While such vertical acoustic modes aptly explain the features seen in Reynolds & Miller’s (2008) simulations, they do not appear to correctly describe our spectra. Even though we cannot claim the power more closely tracks the orbital frequency than the vertical epicyclic frequency, it appears that the higher order diagonal tracks tightly follow harmonics of the orbital frequency with integer coefficients (indicated by dotted lines in figure 3) rather than those curves described by equation 2 relating to the vertical epicyclic frequency. In particular, we note this agreement even at frequencies higher than the vertical epicyclic frequency maximum. Additionally, tracks do not appear strongly in the polar velocity spectrum as would be expected if acoustic motion in that direction were present. Hence, we argue that the fundamental dynamics giving rise to our tracks is not related to vertical acoustic motion.
An alternative interpretation for the power along the orbital frequency and its harmonics in our simulations is that they represent non-axisymmetric clumps orbiting the central black hole on Keplerian trajectories. One would not expect the presence of such orbiting clumps in the Reynolds & Miller (2008) simulations (Reynolds, 2009). They employed a azimuthal wedge with periodic boundary conditions in , so their lowest order, non-axisymmetric structure would, in our language, have at least an azimuthal quantum number . These high modes would manifest as fluid oscillations at a frequency but would likely be dominated by turbulence in both Reynolds & Miller’s (2008) simulations and our own. In addition, it could be that the low clumps that we see in our simulations dominate the vertical acoustic waves that they saw in their wedge.
The tilted simulation’s power spectrum, shown in figure 3, similarly exhibits power along the orbital frequency and its harmonics and spurious variability at large radii. In contrast to the untilted configuration’s spectra, no high frequency variability appears near or within the ISCO in any variable. A characteristically different shape to the overall spectra is evident: while the untilted spectra are dominated by acoustic-like variability (i.e. variability at frequencies larger than the orbital frequency), the tilted spectra exhibit considerably more power at inertial-like frequencies (i.e. frequencies smaller than the orbital frequency, particularly those bounded above by the radial epicyclic frequency). To visualize the stark contrast between the the untilted and tilted power spectra, figure 4 displays the power integrated in radius between () and . It is clear that the tilted simulation is contrastingly dominated by power at frequencies characteristic of inertial variability, whereas the untilted simulation is not. We believe this power has not been previously observed in MHD simulations.


Figures 3 and 4 may also indicate higher power peaks amid the continuum of inertial-like variability. Localized in frequency and extended in radius, such peaks suggest coherent variability arguably spanning the region from the spacetime’s ISCO to the radius at which the orbital frequency equals the oscillation frequency. Additionally, power seems to leak inwards of the ISCO, particularly in the density spectrum. We can identify matching peaks in each of the three fluid variables at corresponding frequencies, suggesting that the features are physical in nature and are not numerical artifacts. Among these, power at is elevated above the continuum in the density and radial velocity spectra and exhibits a minimal though identifiable excess in the polar velocity spectrum. We hope to characterize the nature of the general power at inertial frequencies by carefully analyzing the three dimensional structure of the variability at .
Isothermal diskoseismic models of untilted, flat disks indicate that perturbations with local radial wave number obey the dispersion relation (Okazaki et al., 1987),
| (3) |
where is the Doppler-shifted wave frequency and is the radial epicyclic frequency.333Okazaki et al. (1987) assume an isothermal equation of state and vertical profile. For an adiabatic equation of state and vertical profile, the acoustic factor must be slightly modified as in equation 2 above. However, for the important and modes, both dispersion relations agree. Physically, these two modes exhibit no vertical oscillation and a bulk vertical oscillation of the local center of mass, respectively. There is therefore no internal compression, and the thermodynamics are irrelevant. Wave propagation is only possible where and equation 3 is quadratic in , so it is clear that two distinct oscillation modes exist for a given frequency and set of vertical and azimuthal wave numbers and , respectively. As summarized in Ferreira & Ogilvie (2008), modes that have pressure as their dominant restoring force (-modes) can exist at radii where and , while modes whose dominant restoring force is inertial in character (-modes) can lie where . Outside a given mode’s trapping region (i.e. where is imaginary), the oscillation damps exponentially. Unfortunately, this diskoseismic theory applies to perturbations of a geometrically thin, flat accretion disk. It is therefore difficult to compare its predictions directly to a pressure supported, moderately tilted disk due to the nonlinear effects of spatially varying tilt and twist and significant vertical thickness.
Power at displays complex radial structure. Two local maxima appear just inside the inner and outer edges of the radial epicyclic frequency, and another lies just within the orbital frequency’s corotation radius. The first two features may imply a superposition of modes trapped within respective resonances, while the third has the characteristics of the aforementioned Keplerian clumps. There is also significant mode power well inside the equatorial test particle ISCO, which might be due to several factors. Pressure gradients can sustain stable fluid element orbits down to a smaller effective ISCO radius. Additionally, mode power may manifest itself inside this effective ISCO due to active accretion; any mode with a trapping radius close to the plunging region may regularly slough off material to smaller radii at the mode frequency. Such fluid pulses would reveal themselves in spectra as higher power at all radii within the plunging region.
To quantify the radial structure and better understand the physical nature of the variability, we extract its spatial structure from the real and imaginary parts of the Fourier transform of our fluid variables. Diskoseismic eigenmodes possess well defined azimuthal wave numbers and parity with respect to the disk equatorial plane. Because a tilted disk lacks both axisymmetry and vertical reflection symmetry, its wave eigenmodes need not be characterized by such quantum numbers. Still, in order to connect to the analytic theory of untilted disks, we project the density structure onto six orthogonal basis functions with well-defined and parity. Figure 5 depicts 3D isosurfaces of the real part of the eigenfunction and its projections; an animation of these isosurfaces may be found online with this publication. A clear structure with even parity is the dominant component, accounting for roughly of the total power. The next two most powerful components are the and modes with odd parity, possessing roughly and of the total power, respectively.
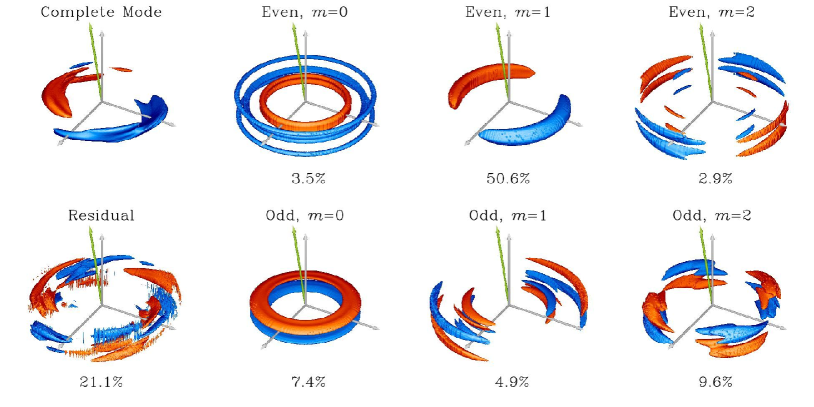
The radial distribution of power in each of these projected modes sheds light on the physical nature of the oscillations. Figure 6 illustrates the total power and each of its three most dominant mode components as a function of radius. Additionally, vertical dotted lines indicate the zeros of for each mode’s quantum numbers and horizontal lines show the regions in which is positive, that is, the mode propagation regions. For the (odd, ) and (odd, ) modes, local maxima occur within predicted trapping regions, suggesting that where the feature is most significant, the former behaves as an -mode bound by the radial epicyclic frequency, and the latter is a -mode trapped between and a reflecting boundary near the plunging region. Conversely, the (even, ) mode peaks near the orbital frequency (indicated by the vertical, black dotted line) and well inside a region forbidden by the diskoseismic models. Recalling the trail of high power peaks tracking the orbital frequency in figure 3, we speculate that this (even, ) component is an orbiting clump and not a trapped inertial or acoustic mode.
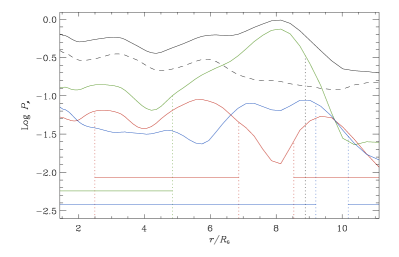
However, we note an alternative explanation for power in the (odd, ) and (odd, ) components. Consider the following: suppose we have a pure (even, ) mode but that its rotation axis is slightly misaligned with the -axis of a cylindrical coordinate system. If we decompose this configuration with respect to the true -axis, we will find some small amount of power has spilled into the other modes, most notably into the (odd, ) and (odd, ) modes. In a practice, it is difficult to accurately determine the position of the disk midplane, and it is possible our decomposition mixes power between modes. However, the correlations between the predicted mode trapping regions and the radial power profile suggest the power distribution is not entirely a numerical artifact.
In addition to the nonlinear excitation of trapped waves by warps and eccentric orbits within the disk flow, a titled accretion flow may be more conducive to mode trapping because of the distinct character of its plunging region. In contrast with an untilted disk which has a largely axisymmetric plunging region, mass accretion at small radii in our tilted simulation is confined to two discrete plunging streams (Fragile et al., 2007). Thus, it is conceivable that the azimuthal sections of the inner disk away from these streams provide significant radial reflection of traveling waves in the disk.
4. Conclusions
Previous work has demonstrated that inertial modes are vulnerable to disruption by MRI turbulence (Arras et al., 2006; Reynolds & Miller, 2008). Our Fourier analysis of the untilted simulation, a configuration devoid of tilt or eccentricity, corroborates this conclusion. However, nonlinear analytic calculations (Kato, 2004a, 2008; Ferreira & Ogilvie, 2008) have indicated that disk warps and eccentricity may excite inertial modes; both of these features are generically present in tilted accretion flows. Though the analysis of the variability in our tilted simulation at does not appear to be wholly inertial (or even acoustic) in nature, the presence of two weak, odd parity, and components provides some support for this hypothesis.
Evidence that disk tilt is connected with the excitation of inertial or acoustic waves is twofold. First, fundamentally different shapes in the spectra from the untilted and tilted simulations implies a correlation between tilt and the power at frequencies characteristic of inertial waves. Second, the radial structure of the variability suggests a superposition of modes, at least one of which may be described as inertial in nature in the context of relevant analytic models. Together, these clues establish the presence of variability unique to a tilted geometry which appears to be at least partially inertial in character.
Recalling that a tilted disk configuration naturally yields a low frequency QPO activity in black hole X-ray binaries and speculating that our work’s inertial-like variability may be related to high frequency QPO activity in the same systems, we advocate further numerical exploration of these tilted geometries. Torques associated with the Kerr spacetime can produce a bodily precession of the tilted disk at frequencies within the and range associated with the low frequency QPO. Because this precession frequency is strongly dependent on the radial extent of the disk in this model, it readily explains the observed correlation between the LFQPO’s frequency and disk flux (Remillard & McClintock, 2006; Fragile & Blaes, 2008; Ingram et al., 2009). Similarly, our current work shows inertial or acoustic variability excited and maintained by the disk tilt that exhibits frequencies of order the radial epicyclic frequency maximum. Such frequencies fall within the observed range of to for HFQPOs in stellar mass black hole systems.
HFQPOs are only observed when a system’s X-ray emission exhibits the characteristics of the steep power-law state (cf. Remillard & McClintock 2006 for a review of the properties of X-ray black hole binaries), and we must acknowledge, however, that our simulations are almost certainly not accurate representations of that state. For instance, since they neither account for radiative cooling nor capture all forms of dissipation, our simulations likely do not reproduce some of the key features found in various models for the state’s structure (e.g. the energetically significant corona in Done, Gierliński, & Kubota 2007). However, we are confident that our simulations and analysis provide insight into the dynamical effects of a tilted accretion flow, particularly, the excitation of inertial and acoustic modes.
We thank Chris Done, Paul Henisey, Mami Machida, Phil Marshall, Gordon Ogilvie, Chris Reynolds, and Alexander Tchekhovskoy for useful conversations, and Sam Cook for his help with data transport and preparation. We also thank the anonymous referee for comments that significantly improved this paper. This work was supported in part by NSF grant AST-0707624. The work of BTF was supported by FCT (Portugal) through grant SFRH/BD/22251/2005. PCF acknowledges support from NSF grant AST-0807385 and an American Astronomical Society International Travel Grant. We are also grateful to the Nordic Institute for Theoretical Astrophysics for hosting a workshop on QPOs where much of this work was completed.
References
- Arras et al. (2006) Arras, P., Blaes, O., & Turner, N. J. 2006, ApJ, 645, L65
- Blaes et al. (2006) Blaes, O. M., Arras, P., & Fragile, P. C. 2006, MNRAS, 369, 1235
- Done, Gierliński, & Kubota (2007) Done, C., Gierliński, M., & Kubota, A. 2007, A&AR,15, 1
- Ferreira & Ogilvie (2008) Ferreira, B. T., & Ogilvie, G. I. 2008, MNRAS, 386, 2297
- Fragile et al. (2007) Fragile, P. C., Blaes, O. M., Anninos, P., & Salmonson, J. D. 2007, ApJ, 668, 417
- Fragile & Blaes (2008) Fragile, P. C., & Blaes, O. M. 2008, ApJ, 687, 757
- Fu & Lai (2009) Fu, W., & Lai, D. 2009, ApJ, 690, 1386
- Gierliński et al. (2008) Gierliński, M., Middleton, M., Ward, M., & Done, C. 2008, Nature, 455, 369
- Ingram et al. (2009) Ingram, A., Done, C., & Fragile, P. C. 2009, MNRAS, 397, L101
- Kato (2001) Kato, S. 2001, PASJ, 53, 1
- Kato (2004a) Kato, S. 2004a, PASJ, 56, 905
- Kato (2008) Kato, S. 2008, PASJ, 60, 111
- Okazaki et al. (1987) Okazaki, A. T., Kato, S., & Fukue, J. 1987, PASJ, 39, 457
- Press et al. (1992) Press, W. H., Teukolsky, S. A., Vetterling, W. T., & Flanner, B. P. 1992, Numerical Recipes in C (2nd ed.; Cambridge, MA: Cambridge UP)
- Remillard & McClintock (2006) Remillard, R. A., & McClintock, J. E. 2006, ARA&A, 44, 49
- Reynolds & Miller (2008) Reynolds, C. S., & Miller, M. C. 2008, ApJ, 692, 869
- Reynolds (2009) Reynolds, C. S. 2009, private communication
- Schnittman et al. (2006) Schnittman, J. D., Krolik, J. H., & Hawley, J. F. 2006, ApJ, 651, 1031
- Stone et al. (1996) Stone, J. M., Hawley, J. F., Gammie, C. F., & Balbus, S. A. 1996, ApJ, 463, 656
- Strohmayer & Mushotzky (2003) Strohmayer, T. E., & Mushotzky, R. F. 2003, ApJ, 586, L61
- Strohmayer et al. (2007) Strohmayer, T. E., Mushotzky, R. F., Winter, L., Soria, R., Uttley, P., & Cropper, M. 2007, ApJ, 660, 580
- Wagoner (1999) Wagoner, R. V. 1999, Phys. Rep., 311, 259