Testing Standard Cosmology with Large Scale Structure
Abstract
The galaxy power spectrum contains information on the growth of structure, the growth rate through redshift space distortions, and the cosmic expansion through baryon acoustic oscillation features. We study the ability of two proposed experiments, BigBOSS and JDEM-PS, to test the cosmological model and general relativity. We quantify the latter result in terms of the gravitational growth index , whose value in general relativity is . Significant deviations from this value could indicate new physics beyond the standard model of cosmology. The results show that BigBOSS (JDEM-PS) would be capable of measuring with an uncertainty (0.054), which tightens to (0.038) if we include Stage III data priors, marginalizing over neutrino mass, time varying dark energy equation of state, and other parameters. For all dark energy parameters and related figures of merit the two experiments give comparable results. We also carry out some studies of the influence of redshift range, resolution, treatment of nonlinearities, and bias evolution to enable further improvement.
keywords:
Cosmology - Cosmological parameters — Cosmology - Large-scale structure of the Universe — Cosmology - Observations1 Introduction
Surveys of large-scale structure in the universe provide a rich resource for testing our understanding of cosmology. Future surveys will cover nearly the full sky to redshifts far deeper than are currently studied, mapping out some 10 billion years of history. The great statistical power and leverage from depth will allow detailed examination of the cosmological framework by carrying out a simultaneous fit of a substantial suite of relevant parameters. One particularly attractive prospect is the capability to put to the test the predictions of Einstein gravity for the growth of structure and its consistency with the cosmic expansion history.
We consider next-generation surveys mapping the distribution of galaxies in three dimensions to redshifts of order . A goal of this study is to determine the capabilities of such surveys. In particular we aim to estimate realistic constraints from a global parameter fit on the gravitational growth index , which can characterize deviations from general relativity. The second goal is to examine how the survey characteristics such as redshift range, resolution, and galaxy selection affect those capabilities.
In Sec. 2 we review the formalism for extracting cosmological information from galaxy correlation measurements in terms of the matter power spectrum, and discuss the anisotropic distortion due to measuring in redshift space (rather than position space). We discuss the relevant set of cosmological parameters in Sec. 3 and their influence on the matter power spectrum. The results are analyzed with emphasis on the role of degeneracies between factors that influence growth, including the gravitational growth index, the dark energy equation of state, and neutrino mass. In Sec. 4 we turn to astrophysical and survey characteristics and analyze the effect of the bias level of the selected galaxy populations, the form of the small-scale velocity damping, the spectroscopic survey redshift resolution, and the redshift range of the survey. This allows quantitative comparison of the capabilities of next-generation (Stage IV) experiments from both ground and space, as well as nearer term (Stage III) experiments. We conclude in Sec. 5 with a summary of the prospects for testing the standard cosmology and revealing clues to dark energy or the breakdown of Einstein gravity.
2 Methodology
The future dark energy experiments considered in this paper aim at measuring galaxy positions in three dimensions to study baryon acoustic oscillations and other aspects of the matter power spectrum including its evolution through the growth of structure. The matter power spectrum contains important cosmological information through its evolving amplitude, its shape including the turnover reflecting the transition from radiation to matter domination and the suppression due to massive neutrino free streaming, and the baryon acoustic oscillation features serving as a standard ruler.
One aspect of particular interest is the distorted, anisotropic mapping between the real space density field and the measurements in redshift space, caused by peculiar velocities (Kaiser, 1987; Hamilton, 1998). This redshift space distortion has attracted recent attention as a possible technique for detecting deviations from general relativity (see Peebles (2002); Linder (2008); Guzzo et al. (2008) for early work) as it depends on the relation between the density and velocity fields, which can be altered by modifying the gravitational theory.
Thus the observed galaxy power spectrum contains several types of cosmological information. The autocorrelation function is defined as the excess probability of finding masses at a separation :
| (1) | |||||
| (2) |
where is the mean mass density and is the density contrast. The mass power spectrum is then the Fourier transform of the autocorrelation function:
| (3) |
with the wave vector. Due to spatial isotropy, only the magnitude will enter.
We do not observe the power spectrum in real space, however, but obtain the radial position through redshift measurements, convolving the real distance with additional redshifts due to peculiar velocities. This leads to the redshift-space power spectrum gaining an angular dependence through the linear Kaiser factor (Kaiser, 1987) multiplying the isotropic, real space mass power spectrum :
| (4) |
where is the cosine of the angle that makes with the line of sight. For notational simplicity, we suppress the tilde from now on. We work in the linear regime, where the continuity equation between the galaxy peculiar velocity field and the galaxy mass overdensity is linear (see for example Hamilton (1998)).
The dimensionless growth rate is given by
| (5) |
where is the scale factor, and is the growth factor, i.e. the amplitude or . We also need to take into account that galaxies, not directly mass density, are observed. The bias relates the galaxy overdensity to the total mass overdensity through .
By looking at the angular dependence of the power spectrum at each ,
| (6) |
where is the normalization of the power spectrum, we can in principle fit for , and , hence allowing us to measure and provided we have an appropriate measurement of . This is challenging in practice due to noise. Another possible route to separating out the bias involves the use of higher order correlation functions (Scoccimarro et al., 1999).
Although we have three measurable quantities (the three coefficients of the fourth order polynomial in Eq. 6) and three unknowns, we cannot determine all of them because the second is the geometric mean of the other two. This is because we work in the linear regime and general relativity, where the galaxy density and peculiar velocity fields are perfectly correlated. But should one of these hypothesis be relaxed (as in modified gravity models or with non-linearities e.g. Finger-of-God effects), we need to introduce the correlation coefficient between the fields (White et al., 2009; Uzan, 2009)
| (7) |
where the subscript g denotes the galaxy density field, and v the divergence of the peculiar velocity field. Ideally this correlation would be predicted by the physical theory (Desjacques et al., 2009); allowing instead to be completely free significantly degrades the constraints on (White et al., 2009). We do not consider this situation further in this article, instead assuming the standard correlation of unity, since we restrict our analysis to the linear regime and many classes of gravity theory maintain the correlation in this regime.
To incorporate a measure of the sensitivity to the gravity theory we use the gravitational growth index formalism of Linder (2005), which parameterizes the growth factor as
| (8) |
so
| (9) |
where
| (10) |
is the ratio of matter density to the total energy density at scale size . The summation runs over all the different components of the universe: matter, dark energy, curvature and radiation. The gravitational growth index will be a parameter of key interest. It can distinguish other theories from Einstein gravity – (see for example Linder (2005); Linder et al. (2007); Guzzo et al. (2008)). The merit of a large scale structure survey in terms of its gravitational probative power may be conveniently quantified by the uncertainty . The Figure of Merit Science Working Group (Albrecht et al., 2009) found that for the suite of future Stage III experiments, expected to be completed before the proposed Joint Dark Energy Mission (JDEM) program, the anticipated uncertainty is .
The standard technique for making such parameter estimation predictions is the Fisher matrix (Tegmark et al., 1997). For a survey covering a volume where the mean galaxy number density is , the element of the Fisher matrix for parameters and is obtained as an integral over the space of modes (Tegmark, 1997), by:
| (11) |
The accessible modes are weighted due to shot noise according to an effective volume (Feldman et al., 1994):
| (12) |
The constraint leverage comes mostly from regions where , that is .
In order to avoid the uncertainties associated with treatment of non-linearities, we truncate the Fisher matrix integral at a maximum value . We take /Mpc, which is the scale where departures from linear theory begin to become significant (see, e.g., the analysis of Percival et al. (2009)). See Sec. 4.2 for a further investigation of non-linear effects.
The information about comes from two different parts of the power spectrum. The real space, isotropic part, corresponding to no redshift space distortions, or (observations transverse to the line of sight) in the linear regime, is proportional to the growth factor squared:
| (13) |
Note that surveys lacking sufficient redshift resolution are only sensitive to the transverse modes due to smearing along the line of sight (see, e.g., Padmanabhan (2008)). Using Eq. (8), the information carried by this part involves
| (14) |
The redshift space distortions in the power spectrum give further information through the parameter , which with Eqs. (5) and (8) reads
| (15) |
Therefore, if we define the anisotropic part alone as
| (16) |
it carries information on through
| (17) |
This factor gives a sense of the information from the redshift distortions.
Because the measurements become noisier when subdivided into angular bins, and because a substantial majority of the information resides in the spherically averaged power spectrum (Shoji et al., 2009), analyses frequently use the one dimensional, spherically averaged power spectrum
| (18) |
This incorporates information from both the original isotropic power spectrum and the redshift distortion anisotropies, and may be most familiar in terms of the factor of Eisenstein et al. (2005). In particular, the sensitivity to arises from
| (19) |
In Sec. 3, we will investigate the relative importance of the transverse, anisotropic, spherically averaged, as well as full versions of the power spectrum for constraints on the gravitational growth index and other parameters.
3 Parameter Constraints
The constraints on expected from nearer term (Stage III) surveys are not that informative, as mentioned, with compared to a difference (Lue et al., 2004; Linder, 2005; Linder et al., 2007) between general relativity and DGP gravity (Dvali et al., 2000; Deffayet et al., 2002) for example. We therefore turn to Stage IV experiments and assess their potential for a more accurate test of the standard cosmological model.
We consider two versions of Stage IV power spectrum experiments: BigBOSS (Schlegel et al., 2009) is a proposed ground-based wide field spectroscopic survey and JDEM-PS (Gehrels et al., 2009) is a proposed space-based wide field grism survey. Both aim at measuring the three dimensional spatial distribution of galaxies to study baryon acoustic oscillations and the growth of structure. Both experiments would use the Stage III experiment BOSS (Schlegel et al., 2009), detecting luminous red galaxies (LRG) out to , as a springboard to higher redshifts. BigBOSS would extend mapping of LRG out to and to the southern sky and both experiments would supplement LRG with different classes of emission line galaxies (EL) out to .
Following Schlegel et al. (2009); Gehrels et al. (2009); Slosar (2009), we give in Table 1 the redshift range, survey solid angle , expected target galaxy bias factors and , mean galaxy number density , and wavelength resolution of the spectrographs to be used (so the redshift resolution ). We consider variations in redshift, number density, and bias in Sec. 4.
| BigBOSS | LRGa | EL |
|---|---|---|
| range | ||
| (deg2) | ||
| (/Mpc)3 | ||
| JDEM-PS | LRGa | EL |
| range | ||
| (deg2) | ||
| (/Mpc)3 | ||
To calculate the power spectrum as a function of redshift and cosmological parameters we used the Boltzmann equation code CMBeasy (Doran, 2005). Using two sided derivatives together with convergence tests we can accurately calculate the sensitivity derivatives with respect to each parameter. These then enter into the Fisher matrix calculations of the parameter estimation, taking into account the correlations between parameters. The data points are taken to be the power spectrum evaluated at the centers of 10 (or 11) redshift bins from , i.e. at . For JDEM-PS, we divide the bin containing into two pieces: using LRG and using EL.
The parameter set involves 9 parameters. Note that when testing the gravitational framework, i.e. exploring beyond-Einstein gravity through quantitative estimation of , it is crucial to include all parameters that could act in a similar manner on the growth and growth rate. Therefore we include a time varying dark energy equation of state and massive neutrinos. The parameter list, and the fiducial value around which the Fisher matrix expands, is
-
1.
, gravitational growth index
-
2.
, the bias for LRG (see Table 1)
-
3.
, the bias for EL (see Table 1)
-
4.
, dark energy density today
-
5.
, massive neutrino energy density today
-
6.
, reduced baryon energy density today
-
7.
, reduced Hubble constant
-
8.
, dark energy equation of state today
-
9.
, dark energy equation of state time variation
The values for , and are WMAP-5 best fit parameters (Hinshaw et al., 2009). Note that the fiducial is the value predicted by General Relativity for CDM (and is quite insensitive to the dark energy equation of state); the fiducial is taken to avoid issues of stepping over . Dark energy perturbations are included in CMBeasy. We assume there is no spatial curvature. In the remainder of this section we take the fiducial , and we will investigate the effect of a different fiducial in the next section. Note that the neutrino energy density fraction is related to the sum of the neutrino masses by . For a reasonable current upper bound eV (Seljak et al., 2009), this implies 0.006. We take , or eV as the fiducial.
Adding together the information from the redshift slices independently (note this is not generally a good approximation for slices thinner than our ), we obtain the full Fisher matrix. We do not explicitly add any CMB information (except later when adding Stage III Fisher matrices, which assume Planck data).
Concentrating on testing the gravitational growth index, we now explore in more detail what affects the constraints on using information only from the galaxy power spectrum. The constraints are computed to be
| (20) | |||||
| (21) |
The importance of including dark energy properties, neutrino masses, and other cosmological parameters in the parameter estimation is highlighted by the much tighter constraints obtained if we neglect their influence, including only itself and the galaxy biases. In this case we obtain overly optimistic estimates: and . Thus, taking into account the correlations with other cosmological parameters is essential. The correlation matrices for the two experiments are shown in Tables 2 and 3; we have replaced the unit diagonal with the uncertainties on each parameter.
To obtain an overall view of how tightly correlated a parameter is with the other variables, we employ the global correlation coefficient – the largest correlation of that parameter with any linear combination of all other parameters. This is given by
| (22) |
We show those vectors in Table 4. Note the high degree of correlation, indicating the importance of crosschecks by other data and techniques.
;
Examining the marginalized parameter estimations along the diagonals of Tables 2 and 3, we see that as expected the power spectrum information is especially strong in constraining and . One can determine at the level the growth index and present equation of state , while and have uncertainties of order unity. The growth index and equation of state parameters estimation is similar for the two experiments: , and for the ground-based BigBOSS and , and for the space-based JDEM. We find the usual high anti-correlation between and , and a strong correlation between and .
Regarding the neutrino mass parameter, neutrino oscillation experiments indicate that neutrinos do have mass (Maltoni et al., 2008; Kayser, 2008), but this is not always included in parameter estimation despite its correlations. We demonstrate the effect of neglecting this ingredient, finding that it gives overly optimistic constraints on by a factor of three to four. The results in Table 5 illustrate the influence of neutrinos in three ways, including their mass as a free parameter, including their mass but fixing its value, and neglecting their mass so they act as a relativistic species. At the level of neutrino energy density used as fiducial, , and over the range /Mpc used for the power spectrum, the parameter value does not strongly affect determination of and is mainly degenerate with the bias parameters. However it is crucial to include neutrino mass because the difference between treating them as relativistic vs. nonrelativistic energy density is still important.
| Case | BigBOSS | JDEM-PS |
|---|---|---|
| Massive neutrinos, free | 0.043 | 0.054 |
| Massive neutrinos, fixed | 0.042 | 0.053 |
| Relativistic neutrinos | 0.014 | 0.013 |
It is interesting to explore where the main information on the gravitational growth index comes from between the transverse and anisotropic parts (Eqs. 13 and 16), and to compare with the spherically averaged case (Eq. 18). Note that we have defined the anisotropic part to isolate the redshift distortion, imagining one could remove all shape () dependence and only focus on the angular dependence. This seems unrealistic and is only included as a toy model to highlight the influence on the growth rate ; the constraints on become 0.023 for BigBOSS and 0.021 for JDEM-PS (note that the parameter space is much reduced, with the baryon density, neutrino density, and not entering). Table 6 shows the more realistic parts.
| Case | BigBOSS | JDEM-PS |
|---|---|---|
| Transverse (Eq. 13) | 0.126 | 0.128 |
| Spherically averaged (Eq. 18) | 0.081 | 0.065 |
| Full (Eq. 4) | 0.043 | 0.054 |
Note the full power spectrum with redshift space distortions has the greatest information on the growth index, with a factor 2 better constraints than the spherically averaged power spectrum and a factor 3 better than the transverse (zero redshift distortion or 2D) modes, for the BigBOSS case. BigBOSS achieves these improvements due in large part to its high resolution that lets it probe the redshift distortions more successfully.
Finally, a Stage IV power spectrum experiment will not exist in isolation. Previous experiments, using several methods, will be carried out and the complementarity between methods offers leverage to tighten the cosmology constraints. To study the impact of Stage III priors on the parameters we use the Stage III matrix given by the FoMSWG website (Albrecht et al., 2009) (without double counting the BOSS information), rotated into the basis. Summing the Fisher matrices of our analysis and of Stage III, we extract the constraints on cosmology shown in Table 7.
| BigBOSS+III | JDEM-PS+III | |
|---|---|---|
| 0.031 | 0.038 | |
| 0.105 | 0.094 | |
| 0.340 | 0.289 |
The complementarity of the other methods (supernova distances, CMB power spectra, and weak lensing shear) from Stage III in breaking degeneracies tightens the constraints on produced by BigBOSS and JDEM-PS by a factor of 1.4. Stage IV experiments using these techniques will further reduce the uncertainties on , either directly or indirectly through constraining other, correlated cosmological parameters.
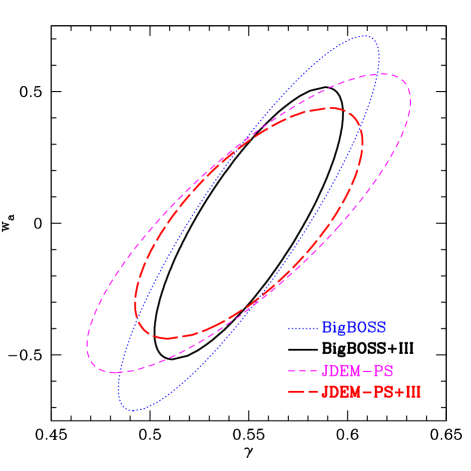
BigBOSS from the ground and JDEM-PS from space appear comparable in their cosmology reach. For the marginalized uncertainties, BigBOSS does better on the gravitational growth index by a factor 1.26 while JDEM-PS does better on the equation of state time variation by a factor 1.27. We exhibit the joint 68% confidence contours in Fig. 1 where we see that the JDEM-PS contours are slightly fatter, having an overall area 1.23 times the BigBOSS constraints. Treating the inverse area of the parameter estimation contours as a figure of merit (FoM), Table 8 lists the ratios of FoM’s for the BigBOSS plus Stage III and JDEM-PS plus Stage III experiments.
| BigBOSS/JDEM-PS | BigBOSS+III/JDEM-PS+III | |
|---|---|---|
| 0.93 | 0.99 | |
| 1.16 | 1.20 | |
| 1.21 | 1.23 | |
| 0.88 | 0.86 |
4 Survey Characteristics
In this section we investigate the influence of different survey parameters in the determination of the gravitational growth index . We discuss the influence of the redshift resolution , the model for non-linear redshift distortions (i.e. the small scale velocities appearing in the Finger-of-God effect), the uncertainty in the bias parameter shown in Table 1, and in particular the survey redshift range and design. We will use the information coming from the full power spectrum as defined in Eq. (4). To clarify the effects we do not include information from Stage III experiments.
4.1 Redshift Resolution
The effect of the uncertainty in the redshift measurement is incorporated by including a Gaussian suppression factor in the power spectrum in -space:
| (23) |
We include this factor in the Poissonian noise factor entering the effective volume, Eq. (12), but do not vary it with cosmology.
A simple rule of thumb can be derived for the minimal resolution to achieve in order to neglect the influence of redshift uncertainties. Given that we truncate the integral defined in the Fisher matrix at /Mpc to exclude non-linear redshift distortions, this resolution effect will start to be significant when . This yields or . This is near the JDEM-PS minimal resolution, but this estimate is for the worst-case scenario (, , ), so redshift uncertainties should not be an issue for JDEM-PS/BigBOSS. For experiments with larger redshift measurement uncertainties, however, the effect on cosmology determination can be significant as shown for the full numerical computations in Table 9.
| (/Mpc) | BigBOSS | JDEM-PS | |
|---|---|---|---|
| 20 | 0.0067 | 0.110 | 0.124 |
| 200 | 0.067 | 0.044 | 0.054 |
| 0.043 | 0.054 |
As expected, the BigBOSS/JDEM-PS values /Mpc are sufficient for the cosmology estimation in our studies. However, two issues must also be kept in mind: including information from /Mpc would increase the resolution requirements, and high resolution plays a key role in cleanly selecting the galaxy populations, e.g. avoiding line confusion in emission line galaxies.
4.2 Non-linearities
We can examine how a better understanding of the transition to the non-linear part of the power spectrum could lead to an improvement in determining . Instead of truncating the integral in Eq. (11) entering the Fisher matrix at , we can choose to implement a streaming model representing Fingers of God effects (see for example Peebles (1980)), where we integrate over all but multiply the power spectrum by a damping factor, either Lorentzian or Gaussian. This is supposed to model an exponential or Gaussian probability distribution function for the peculiar velocities of galaxies. We investigate the three forms of the small-scale velocity damping factors:
| (24) | |||||
| (25) | |||||
| (26) |
where is the Heaviside function. We use /Mpc for all cases. Table 10 shows the effects on the determination of the gravitational growth index.
| Case | BigBOSS | JDEM-PS |
|---|---|---|
| Cutoff | 0.043 | 0.054 |
| Gaussian | 0.024 | 0.026 |
| Lorentzian | 0.019 | 0.021 |
We see that the statistical uncertainty on is largest if we simply cut out all translinear information, by about a factor 2. Thus we have adopted the most conservative method to predict ; the information might not be completely lost on translinear scales, but only attenuated by Finger-of-God effects. Adopting a Gaussian or Lorentzian damping model allows extraction of some information, with the choice of model affecting the results at the level. However, an exponential or Gaussian probability distribution function for the streaming model is still not completely accurate, and along with the reduced statistical uncertainty on could come a systematic bias. Thus we retain the conservative, cutoff method. Taking into account a halo model, for example Tinker (2007), could allow a more detailed investigation of the proper treatment of the translinear regime. Issues of nonlinear bias could also arise beyond the /Mpc adopted in this paper.
4.3 Redshift Range and Survey Design
While the survey volume due to the solid angle simply scales the parameter estimation as in the statistical treatment without priors, the influence of redshift range is more complex and interesting. Since the galaxy population used also depends on redshift we simultaneously investigate the influence of the galaxy bias values.
Table 11 shows the results for considering the populations, and their associated redshift ranges, one at a time and also in combination with different values (0.8 vs. 1.2) for the emission line galaxy population bias.
| Populations | BigBOSS | JDEM-PS |
|---|---|---|
| LRG, | 0.067 | 0.115 |
| EL, | 0.574 | 0.187 |
| EL, | 0.503 | 0.197 |
| LRG + EL, | 0.043 | 0.054 |
| LRG + EL, | 0.042 | 0.053 |
As found in Linder (2008), most of the constraint on comes from the redshift range , which mostly corresponds to the LRG population. The reason is simple: the cosmological information on enters the power spectrum through the factor , so at higher redshifts where is closer to , the sensitivity to decreases. The value of the EL bias adopted does not have a significant effect, especially when in combination with the low redshift, LRG sample. Furthermore, note that the EL only case for JDEM-PS, which includes all the information from JDEM-PS itself and none of the data to be provided by BOSS, only determines , even though the sample extends down to . For JDEM-PS, the BOSS data enable an improvement of almost a factor 4 in the growth index parameter determination.
These consequences of redshift range raise an important question: what is the science reach of the BigBOSS survey if the EL sample is shifted from to ? This not only changes the redshift range of the EL sample information but creates an overlap between LRG and EL information. The generalization of Eq. (11) to multiple galaxy populations (McDonald et al., 2008; White et al., 2009) reads:
| (27) |
where X and Y are indices describing pairs of galaxy populations, and is the covariance matrix of the power spectra. Adapting the BigBOSS specifications from Table 1 by shifting the EL sample to retains the science leverage and in fact delivers a mild improvement of 8%:
| BigBOSS standard | (28) | ||||
| (29) |
Moreover, a redshift maximum of 1.7 reduces the technical complexity of the data acquisition and analysis, greatly ameliorating issues of line confusion and reduced signal-to-noise that occur over . (Note that for Ly- enters the spectral range and the issues again disappear.) The overlap of LRG and EL populations with very different biases in the same redshift range also offers the possibility of crosscorrelation and reduction of sample variance (McDonald et al., 2008). Thus, these results motivate shifting the EL redshift range to , achieving (and 0.030 with Stage III information).
4.4 Galaxy Samples
The values of the galaxy number densities and biases listed in Table 1 come from the references given. While it is beyond the scope of this paper to do detailed survey design, we can explore whether some variations in the adopted values matter.
As we have seen in the previous subsection, a change in the constant bias of the ELG population from 0.8 to 1.2 has a 2% effect on determining . We now consider an evolving model for bias. Motivated by Padmanabhan et al. (2006) we take with fiducial , and motivated by Sumiyoshi et al. (2009) we take with fiducial .
The constraints on the dark energy parameters , , improve by 4%, 2%, 6% for BigBOSS and degrade by 5%, 11%, 10% for JDEM-PS. These changes are due to altered covariances between the bias parameters and the dark energy parameters, involving an interplay between the factor in the effective volume and the Fisher sensitivity . Note that the latter quantity goes as , so an increased bias decreases the Fisher element. However, increasing the bias increases the effective volume through raising . In the BigBOSS case, this second factor is more than sufficient to compensate for the reduced sensitivity. However, JDEM-PS has such a high galaxy number density that the change in has little effect on the effective volume, leaving only the reduced sensitivity. Updating Table 8 for the evolving bias case, Table 12 shows further gains in the figures of merit for BigBOSS relative to JDEM-PS.
| BigBOSS/JDEM-PS | BigBOSS+III/JDEM-PS+III | |
|---|---|---|
| 1.19 | 1.12 | |
| 1.45 | 1.41 | |
| 1.52 | 1.42 | |
| 1.13 | 1.07 |
Regarding the number densities used for the galaxy populations, these come from selection functions of the survey with respect to the intrinsic populations within the detection limits. In general, target selection is a complicated procedure and these numbers represent a sculpted target sample not a flux- or volume-limited distribution. We consider one simple variation in the BigBOSS ELG distribution, motivated by the previous subsection where the redshift range was shifted from to . Such a shift was found to slightly improve the cosmology constraints, and it also reduces the amount of time needed to observe the galaxies. If we take advantage of this by now looking at a survey plan with four times the number density of ELG in the range (and unchanged), we find further improvements in determination of , , by 2%, 4%, 3% relative to the uniform number density in case of the previous subsection.
These calculations show that the basic point of ground and space surveys being capable of delivering comparable cosmology constraints is not very sensitive to these variations in the survey design. Detailed experiment design and optimization, however, is beyond the scope of this paper. We have not considered other experiments such as the Euclid space mission (Cimatti et al., 2009), since it includes other cosmological probes on a par with the power spectrum measurement, and 21 cm mapping surveys such as SKA (see Peterson et al. (2009); Morales & Wyithe (2009)), since neutral hydrogen gas measurement techniques and precision constraints are not as fully developed.
5 Conclusions
The three-dimensional distribution of large scale structure contains information on both the cosmological parameters and testing gravity. We have studied the capabilities of next-generation power spectrum experiments from the ground, BigBOSS, and from space, JDEM-PS, to use the baryon acoustic oscillations, power spectrum shape, and redshift space distortions to test standard cosmology.
The main conclusion is that the two experiments could achieve comparable constraints. We emphasized the importance of including simultaneously the parameters that affect growth – the gravitational growth index characterizing deviations from general relativity, the dark energy equation of state value and its time variation, and neutrino mass. Including these and other cosmological parameters we estimate the uncertainty on determination of the gravitational growth index to be 0.043 for BigBOSS, 0.054 for JDEM-PS, or 0.031 and 0.038 respectively when combined with nearer-term, Stage III experiments. This represents nearly an order of magnitude improvement over Stage III knowledge.
We have also studied the survey characteristics and confirm that the power spectrum at redshifts has strong leverage. This makes the luminous red galaxy component of the survey quite important. Furthermore, our results demonstrate that shifting the redshift range of the emission line galaxy survey of BigBOSS from to can improve the constraints, while adding benefits such as reduced technical complexity and line confusion and increased signal-to-noise and the ability to crosscorrelate galaxy populations of different biases.
Lyman- forest spectra from BigBOSS quasars at , which we have neglected, will further advance the determination of cosmological parameters.
The prospects for testing standard cosmology and in particular general relativity are promising. Improved understanding of the translinear density regime and velocities would further extend the number of usable power spectrum modes, while complementarity with other Stage IV experiments utilizing supernova distances, CMB measurements, and weak lensing data would give powerful leverage on both the gravitational growth index and other cosmological parameters. The capability of probing beyond-Einstein gravity opens up a new window for our understanding of cosmic acceleration and fundamental physics.
Acknowledgments
AS thanks N. Mostek, N. Padmanabhan and D. Schlegel for various insights about BigBOSS and JDEM and R. de Putter for valuable help on CMBeasy. EL thanks M. White and gratefully acknowledges support from a Chaire Blaise Pascal grant and hospitality from LPNHE and APC Paris. This work has been supported in part by the Director, Office of Science, Office of High Energy Physics, of the U.S. Department of Energy under Contract No. DE-AC02-05CH11231.
References
- Albrecht et al. (2009) A. Albrecht et al., Findings of the JDEM Figure of Merit Science Working Group, 2009, arXiv:0901.0721
- Cimatti et al. (2009) A. Cimatti et al., Euclid Assessment Study Report for the ESA Cosmic Visions, 2009, arXiv:0912.0914
- Deffayet et al. (2002) C. Deffayet, G. Dvali, G. Gabadadaze, Accelerated Universe from Gravity Leaking to Extra Dimensions, 2002, Phys. Rev. D 65, 044023, arXiv:astro-ph/0105068
- Desjacques et al. (2009) V. Desjacques & R.K. Sheth, Redshift Space Correlations and Scale-dependent Stochastic Biasing of Density Peaks, 2009, arXiv:0909.4544
- Doran (2005) M. Doran, CMBEASY, an Object Oriented Code for the Cosmic Microwave Background, 2005, JCAP, 0510, 011, arXiv:astro-ph/0302138
- Dvali et al. (2000) G. Dvali, G. Gabadaze, M. Porrati, 4D Gravity on a Brane in 5D Minkowski Space, 2000, Phys. Lett. B 485, 208, arXiv:hep-th/0005016
- Eisenstein et al. (2005) D.J. Eisenstein et al., Detection of the Baryon Acoustic Peak in the Large-Scale Correlation Function of SDSS Luminous Red Galaxies, 2005, ApJ 633, 560, arXiv:astro-ph/0501171
- Feldman et al. (1994) H.A. Feldman, N. Kaiser, J.A. Peacock, Power Spectrum Analysis of Three-Dimensional Redshift Surveys, 1994, ApJ, 426, 23, arXiv:astro-ph/9304022
- Gehrels et al. (2009) N. Gehrels, Report on the Science Coordination Group activities for the Joint Dark Energy Mission, 2009, http://jdem.gsfc.nasa.gov/docs/SCG_Report_final.pdf
- Guzzo et al. (2008) L. Guzzo et al., A Test of the Nature of Cosmic Acceleration Using Galaxy Redshift Distortions, 2008, Nature 451, 541, arXiv:0802.1944
- Hamilton (1998) A.J.S. Hamilton, Linear Redshift Distortions: A Review, 1998, in The Evolving Universe, ed. D. Hamilton, Kluwer Academic, p. 185, arXiv:astro-ph/9708102
- Hinshaw et al. (2009) G. Hinshaw et al., Five-Year Wilkinson Microwave Anisotropy Probe (WMAP) Observations: Data Processing, Sky Maps, and Basic Results, 2009, ApJ Suppl., 180, 225, arXiv:0803.0732
- Kaiser (1987) N. Kaiser, Clustering in Real Space and in Redshift Space, 1987, MNRAS, 227, 1
- Kayser (2008) B. Kayser, Neutrino Mass, Mixing, and Flavor Change, in Review of Particle Properties, 2008, C. Amsler et al. (Particle Data Group), Phys. Lett. B, 667, 1
- Linder (2005) E.V. Linder, Cosmic Growth History and Expansion History, 2005, Phys. Rev. D, 72, 043529, arXiv:astro-ph/0507263
- Linder (2008) E.V. Linder, Redshift Distortions as a Probe of Gravity, 2008, Astropart. Phys., 29, 336, arXiv:0709.1113
- Linder et al. (2007) E.V. Linder, R.N. Cahn, Parameterized Beyond-Einstein Growth, 2007, Astropart. Phys., 28, 481, arXiv:astro-ph/0701317
- Lue et al. (2004) A. Lue, R. Scoccimarro, G.D. Starkman, Probing Newton’s Constant on Vast Scales: DGP Gravity, Cosmic Acceleration and Large Scale Structure, 2004, Phys. Rev. D 69, 124015, arXiv:astro-ph/0401515
- Maltoni et al. (2008) M. Maltoni, T. Schwetz, Three-flavour Neutrino Oscillation Update and Comments on Possible Hints for a Non-zero , 2008, PoS(idm2008)072, arXiv:0812.3161
- McDonald et al. (2008) P. McDonald & U. Seljak, How to Measure Redshift-space Distortions without Sample Variance, 2008, arXiv:0810.0323
- Morales & Wyithe (2009) M.F. Morales, S.B. Wyithe, Reionization and Cosmology with 21 cm Fluctuations, 2009, to appear in ARAA, arXiv:0910.3010
- Padmanabhan et al. (2006) N. Padmanabhan et al., Clustering of Luminous Red Galaxies in the Sloan Digital Sky Survey Imaging Data, 2007, MNRAS, 378, 852, arXiv:astro-ph/0605302
- Padmanabhan (2008) N. Padmanabhan, in http://www-group.slac.stanford. edu/ppa/Reviews/p5/P5_2008_Talks/white.pdf, slide 15
- Peebles (2002) P.J.E. Peebles, From Precision Cosmology to Accurate Cosmology, arXiv:astro-ph/0208037
- Peebles (1980) P.J.E. Peebles, The Large-Scale Structure of the Universe, 1980, Princeton University Press
- Percival et al. (2009) W.J. Percival, M. White, Testing Cosmological Structure Formation using Redshift-space Distortions, 2009, MNRAS, 393, 297, arXiv:0808.0003
- Peterson et al. (2009) J.B. Peterson et al., 21 cm Intensity Mapping, 2009, arXiv:0902.3091
- Schlegel et al. (2009) D. Schlegel et al., The Baryon Oscillation Spectroscopic Survey: Precision measurements of the absolute cosmic distance scale, 2009, arXiv:0902.4680
- Schlegel et al. (2009) D. Schlegel et al., BigBOSS: The Ground-Based Stage IV Dark Energy Experiment, 2009, arXiv:0904.0468
- Scoccimarro et al. (1999) R. Scoccimarro, J.A. Frieman, Hyperextended Cosmological Perturbation Theory: Predicting Non-linear Clustering Amplitudes, 1999, ApJ, 520, 35, arXiv:astro-ph/9811184
- Seljak et al. (2009) U. Seljak et al., 2009, in preparation
- Shoji et al. (2009) M. Shoji, D. Jeong, E. Komatsu, Extracting Angular Diameter Distance and Expansion Rate of the Universe from Two-dimensional Galaxy Power Spectrum at High Redshifts: Baryon Acoustic Oscillation Fitting versus Full Modeling, 2009, ApJ, 693, 1404, arXiv:0805.4238
- Slosar (2009) A. Slosar, BigBOSS vs JDEM/BAO Figures-of-Merit, 2009, unpublished
- Sumiyoshi et al. (2009) M. Sumiyoshi et al., Photometric H alpha and [O II] Luminosity Function of SDF and SXDF Galaxies: Implications for Future Baryon Oscillation Surveys, 2009, arXiv:0902.2064
- Tegmark (1997) M. Tegmark, Measuring Cosmological Parameters with Galaxy Surveys, 1997, Phys. Rev. Lett., 79, 3806, arXiv:astro-ph/9706198
- Tegmark et al. (1997) M. Tegmark, A.N. Taylor, A.F. Heavens, Karhunen-Loève Eigenvalue Problems in Cosmology: How Should We Tackle Large Data Sets?, 1997, ApJ 480, 22, arXiv:astro-ph/9603021
- Tinker (2007) J.L. Tinker, Redshift-Space Distortions with the Halo Occupation Distribution II: Analytic Model, 2007, MNRAS, 374, 477, arXiv:astro-ph/0604217
- Uzan (2009) J.-P. Uzan, Tests of General Relativity on Astrophysical Scales, 2009, GRG special issue on lensing, arXiv:0908.2243
- White et al. (2009) M. White, Y-S. Song, W.J. Percival, Forecasting Cosmological Constraints from Redshift Surveys, 2009, MNRAS, 397, 1348, arXiv:0810.1518