11email: prosati@eso.org
INAF-Osservatorio Astronomico di Trieste, Via Tiepolo 11, 34131 Trieste, Italy
CEA, Laboratoire AIM-CNRS-Université Paris Diderot, Irfu/SAp, Orme des Merisiers, F-91191 Gif-sur-Yvette, France
European Southern Observatory, Alonso de Cordova 3107, Casilla 19001, Santiago, Chile
Department of Astronomy, Universidad de Concepción. Casilla 160-C, Concepción, Chile
National Radio Astronomy Observatory, PO box O, Socorro, NM 87801, USA
Wachovia Corporation, NC6740, 100 N. Main Street, Winston-Salem, NC 27101
Department of Physics and Astronomy, University of Utah, Salt Lake City, UT 84112
Max-Planck-Institut für extraterrestrische Physik, Giessenbachstraße, 85748 Garching, Germany
Astrophysikalisches Institut Potsdam (AIP), An der Sternwarte 16, D-14482 Potsdam, Germany
Department of Physics and Astronomy, Johns Hopkins University, Baltimore, MD21218, USA
Department of Physics, University of California, Davis, One Shields Avenue, Davis, CA 95616, USA
INFN, National Institute for Nuclear Physics, Trieste, Italy
The Oskar Klein Centre, Stockholm University, S–106 91 Stockholm, Sweden
Multi-wavelength study of XMMU J2235.3-2557: the most massive galaxy cluster at ††thanks: Based on observations carried out using the Advanced Camera for Surveys at the Hubble Space Telescope under Program ID 10698; the Very Large Telescope at the ESO Paranal Observatory under Program IDs 274.A-5024(B), 077.A-0177(A,B), 074.A-0023(A), 077.A-0110(A,B)
Abstract
Context. The galaxy cluster XMMU J2235.32557 (hereafter XMM2235), spectroscopically confirmed at , is one of the most distant X-ray selected galaxy clusters. It has been at the center of a multi-wavelength observing campaign with ground and space facilities.
Aims. We characterize the galaxy populations of passive members, the thermodynamical properties and metal abundance of the hot gas, and the total mass of the system using imaging data with HST/ACS ( and bands) and VLT/ISAAC (J and KS bands), extensive spectroscopic data obtained with VLT/FORS2, and deep (196 ks) Chandra observations.
Methods. Chandra data allow temperature and metallicity to be measured with good accuracy and the X-ray surface brightness profile to be traced out to 1′ (or 500 kpc), thus allowing the mass to be reliably estimated. Out of a total sample of 34 spectroscopically confirmed cluster members, we selected 16 passive galaxies (without detectable [OII]) within the central 2′ (or 1 Mpc) with ACS coverage, and inferred star formation histories for subsamples of galaxies inside and outside the core by modeling their spectro-photometric data with spectral synthesis models.
Results. Chandra data show a regular elongated morphology, closely resembling the distribution of core galaxies, with a significant cool core. We measure a global X-ray temperature of keV (68% confidence), which we find to be robust against several systematics involved in the X-ray spectral analysis. By detecting the rest frame 6.7 keV Iron K line in the Chandra spectrum, we measure a metallicity . In the likely hypothesis of hydrostatic equilibrium, we obtain a total mass of . By modeling both the composite spectral energy distributions and spectra of the passive galaxies in and outside the core, we find a strong mean age radial gradient. Core galaxies, with stellar masses in excess of , appear to have formed at an earlier epoch with a relatively short star formation phase (), whereas passive galaxies outside the core show spectral signatures suggesting a prolonged star formation phase to redshifts as low as .
Conclusions. Overall, our analysis implies that XMM2235 is the hottest and most massive bona–fide cluster discovered to date at , with a baryonic content, both its galaxy population and intracluster gas, in a significantly advanced evolutionary stage at 1/3 of the current age of the Universe.
Key Words.:
galaxies: clusters: individual: XMMU J2235.3-2557 - galaxies: evolution - X-rays: galaxies: clusters1 Introduction
Over the past two decades, considerable effort has been devoted to discovering ever more distant galaxy clusters using different observational methods (e.g. Rosati et al., 2002, for a review). These studies have been traditionally motivated by cosmological applications of the cluster abundance at high redshift (e.g. Voit, 2005, for a review), and also by the use of clusters as laboratories to investigate galaxy evolution. Clusters provide a convenient and efficient way of studying large populations of early-type galaxies, which provide stringent tests on galaxy evolution models in the current hierarchical formation paradigm (Renzini, 2006), because they are the most massive galaxies with the oldest stellar populations (at least out to ). Clearly, the higher the redshift the stronger the leverage on theoretical models. In addition, galaxy properties in clusters can be contrasted with those in field surveys, which have multiplied in recent years, thus extending the baseline over which environmental effects can be studied.
X-ray selection of clusters has been central in these studies, as it naturally provides gravitationally bound systems (as opposed to simple overdensities of galaxies) with a relatively simple selection function. Using ROSAT serendipitous surveys, supported by near IR imaging and spectroscopy with 8-10m class telescopes, the redshift envelope was pushed to , with only 5 clusters discovered at , approximately one per square degree (Rosati et al., 2002). The extension of the same technique to XMM-Newton serendipitous surveys has led to the discovery of two clusters at to date, XMMU J2235.32557 at (Mullis et al., 2005) (hereafter M05) and XMMXCS J2215.91738 at (Stanford et al., 2006). See also Lamer et al. (2008) for a newly discovered, high X-ray luminosity massive cluster at .
With the advent of the Spitzer observatory, an alternative and efficient way to unveil distant clusters over large areas (as red galaxy overdensities in the IRAC and optical bands) has been developed. This technique has given notable results, with three clusters spectroscopically confirmed at in the IRAC Shallow Survey (ISCS; Eisenhardt et al., 2008) and one in the SpARCS survey (Wilson et al., 2009).
Detailed investigations of galaxy populations in the X-ray luminous clusters at have been conducted with HST/ACS in combination with the VLT and the Keck telescopes. The study of clusters at (Mei et al., 2006; Demarco et al., 2007; Mei et al., 2009) and the aforementioned systems at (Lidman et al., 2008) and (Hilton et al., 2009), have revealed tight red sequences for the early-type galaxies, with scatters only marginally larger than those in local clusters, implying that most of their stellar mass was assembled at with passive evolution thereafter. While a change in the morphology-density relation of early type galaxies (E+S0 galaxies) has been observed at , elliptical galaxies still dominate the cluster galaxy population up to (Postman et al., 2005; Holden et al., 2007).
A comparison of cluster and field early-types of similar stellar mass has revealed a mild but significant difference between the star formation histories in the two environments (e.g. Gobat et al., 2008; Rettura et al., 2008; van Dokkum & van der Marel, 2007), a result which is predicted by current hierarchical galaxy formation models (e.g. Menci et al., 2008). To date, such comparative studies can only be carried out at , whereas the existence of a substantial population of old, massive, passively evolving early-type galaxies in the field is now well established up to (Kriek et al., 2006; Cimatti et al., 2008).
By pushing cluster studies to higher redshifts, where evolutionary time scales become comparable to the age of the Universe at these redshifts, one would expect to detect significant evolutionary effects. However, as discussed in this paper, this has not been the case so far, even after probing two-thirds of the look-back time, not only for the galaxy populations but also for the thermodynamical properties and chemical enrichment of the hot gas measured with follow-up Chandra observations in clusters.
Our current understanding is that relations, such as the red sequence in the color-magnitude diagram, the morphology-density relation, the relation for the intracluster gas, emerge at . For example, the study of a proto-cluster at identified around a powerful radio galaxy provided evidence of a forming red sequence (Zirm et al., 2008; Kodama et al., 2007), which likely takes 1-2 Gyrs to form (Gobat et al., 2008). It is unfortunate that such a transition in the assembly process of galaxy clusters seems to occur in a redshift range where spectroscopic observation are particularly difficult. In this spirit, we have carried out a multi-wavelength study of one the most distant clusters known, XMMU J2235.32557 (hereafter XMM2235) at , which was the first distant cluster confirmed (M05) as part of the on-going XMM-Newton Distant Cluster Project (XDCP, Boehringer et al., 2005; Fassbender, 2007). In this paper, we use spectro-photometric observations of XMM2235 in the optical/near-IR and X-ray bands to characterize its galaxy population (particularly the passive spectroscopic members) and the thermodynamic status of the hot intracluster gas and to measure its total mass. In section 2, we present the VLT and HST data used in this paper, including an extensive spectroscopic campaign which yielded 34 confirmed cluster members. In section 3, we model the underlying stellar populations of passive galaxies and constrain their star formation histories. In section 4, we present deep Chandra observations of XMM2235, the methods of analysis and the resulting measurements of its temperature, metallicity and mass. In section 5, we discuss the results.
are adopted throughout this paper. In this cosmology, 1′ on the sky corresponds to 0.5 Mpc at
2 VLT and HST Observations
2.1 Optical and near IR data
Following the relatively shallow discovery imaging data obtained with the VLT/FORS2 in the R and z bands (M05), XMM2235 was observed in the J and KS bands with ISAAC on the VLT in January 2006 and August 2007. More recently, deeper and wider-field near IR observations of XMM2235 were obtained with the HAWK-I instrument on the VLT and presented in Lidman et al. (2008).
The ISAAC observations used here consist of a mosaic of pointings, covering , with exposure times of 30 and 20 minutes each in the J and KS filters, respectively (program ID 274.A-5024(B)), with the exception of the central pointing which was observed for 60 and 45 minutes, respectively (ID 077.A-0177(A)). The ISAAC data were reduced with the ESO/MVM software111http://archive.eso.org/cms/eso-data/data-packages/eso-mvm-software-package. Photometric zero points (ZP) were derived by observing one or two standards each night from the photometric catalogue of Persson et al. (1998). All images were laid on an astrometric grid with a pixel scale of 0.15″that was based on VLT/FORS2 images. In order to derive a uniform ZP across the mosaic, we used independent observations obtained with the SofI camera on the ESO-NTT, also reduced with ESO/MVM, for which accurate ZPs were derived with several photometric standards observed before and after the observations. These stars yielded rms scatters of mag in both J and KS. The SofI field includes the central ISAAC field and covers partially the other eight tiles, thus allowing the photometric uniformity across the mosaic to be controlled and independently quantified. The FWHM of all stars in each field was measured, ranging from 0.4 to 0.7″. Gaussian smoothing was used to obtain a uniform PSF in J and KS mosaiced images (with a FWHM of in KS and in J). A sample of 62 stars across the mosaic were selected, using size information from the ACS images and their color, which was restricted to , from the SofI images. These stars were used to to compare photometry across all fields, using SofI ZPs as fiducial ones. As a result, the ZPs in three ISAAC tiles were adjusted by a few % to match the SofI photometry, so as to produce mosaics with a uniform ZP, whose accuracy was estimated to be 0.03 mag in K and 0.04 mag in J as based on the rms scatter from stellar photometry with respect to SofI photometry. We also checked that these ZPs are consistent with 2MASS photometry using a small number of unsaturated stars in the 2MASS catalog.
XMM2235 was observed with the ACS Wide Field Camera on the Hubble Space Telescope on June 27 2005 in the F7755W and F850LP passbands (program ID 10698), as part of the ACS Intermediate Redshift Cluster Survey (Ford et al., 2004). Subsequent ACS visits of XMM2235 took place in 2006 as part of the HST Cluster Supernova Survey (Dawson et al. 2009). This work, however, is based on the first visit only, amounting to an integration of 5060 sec in and 6240 sec in . Analysis of the full HST data set are presented in accompanying papers (Jee et al., 2009, Strazzullo et al. in prep.). The ACS data were processed with the latest version of the “Apsis” pipeline described by Blakeslee et al. (2003). We used the AB photometric system calibrated with the ACS/WFC zero points from Sirianni et al. (2005).
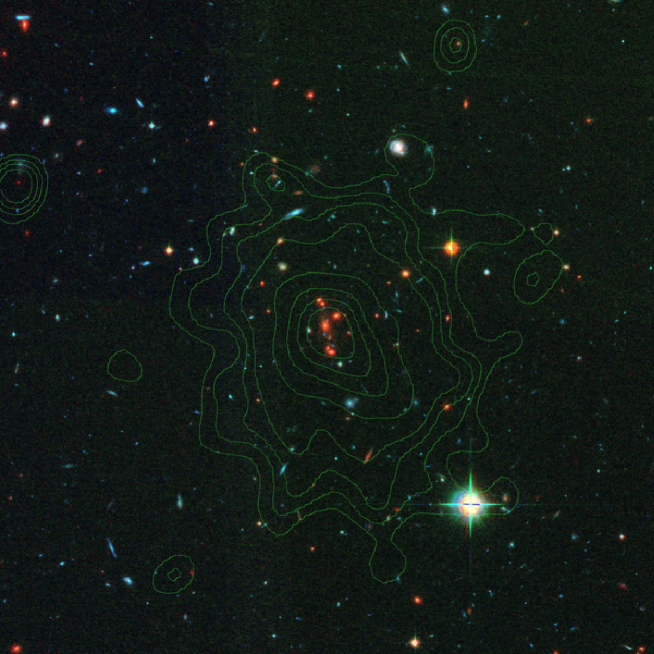
The ISAAC mosaic images were aligned with the ACS images and a four band (, , J and KS) photometric catalog was constructed using SExtractor. Magnitudes were first measured in apertures of 0.75″ radius in the ACS images and 1″ in the ISAAC images, then corrected to 2 and 4″, respectively, to take into account the PSF difference between ACS and ISAAC. Such aperture corrections were derived from the median growth curve of unsaturated stars in the field. Magnitudes were also corrected for galactic extinction according to Schlegel (1998). The adopted corrections are 0.043 mag in , 0.032 in , 0.019 in J and 0.008 in . A color-composite image of XMMU J2235.3-2257 is shown in Fig.1, with the Chandra X-ray contours overlaid in green (see Sect.4). The peak of the X-ray emission is within 2″ of the brightest cluster galaxy (BCG) and is elongated, from the southwest to the northeast, following the distribution of the red cluster galaxies in the core and the major axis of the BCG.
2.2 VLT Spectroscopy
Three separate observing runs were originally devoted to the spectroscopic follow-up study of XMM2235 using FORS2 on the VLT. Two runs were carried out using the MXU mode, programme ID 074.A-0023(A) in October 2004 (see M05) and ID 077.A-0177(B) in July 2006, using two slit masks each. More spectroscopic observations were carried out in July 2006, as part of a program to search for distant Type Ia supernovae hosted by early type galaxies in galaxy clusters at (Dawson et al. 2009). For the latter, the MOS mode of FORS2, which consists of 19 movable slits that can be moved into the focal plane, was used. This allowed rapid follow-up of transient events, such as Type Ia Supernova. In the assignment of slits, transients were given highest priority, likely cluster members were given second priority and other galaxies were given third priority. Two masks were used to follow three transients. Total integration times varied from 2800 seconds in the first mask to 5400 seconds in the second. The number of slits that were used in MXU mode was typically more than double the number that were used in MOS mode, with greater flexibility in placing targets on slits. All observations were carried out with the 300I grism which has a dispersion of /pixel, corresponding to a resolution of for the adopted slit width of 1″. In combination with the OG590 order blocking filter, this configuration provides a wavelength range of . In the 077.A-0177(B) run, the OG590 filter was not used thus extending the coverage down to . For observations with the MXU masks, integration times ranged from 4 to 8 hours, depending on the faintness of the targets in a given mask.
Targets were selected using colors and magnitudes, however not homogeneously throughout the whole observing campaign. Galaxies lying on the red sequence, with , were selected first (M05). Then fainter objects with colors consistent with late and early type galaxies at the cluster redshift were targeted in subsequent masks. As more photometric information (ACS-, ISAAC-) became available after the first run, we adopted new criteria, using K and , colors ranging from the bluest confirmed star-forming member to the reddest member of the red sequence (with a 0.3 mag conservative margin). This corresponded to .
Spectra were reduced with standard techniques using IRAF tasks (see e.g. Demarco et al. (2007)). The RVSAO/XCSAO routine was used to measure redshifts via cross-correlations with a range of template spectra. Redshifts for faint late type galaxies were often derived from the [OII] line alone. Based on signal-to-noise and cross-correlation coefficients (R), spectra were finally assigned quality flags of A,B,C depending on whether the redshifts was considered secure (), acceptable (), and unknown respectively. The first three observing runs yielded 129 redshifts of quality A or B, from 168 extracted spectra, in a field covering (or Mpc). From this sample, 28 redshifts (24 A’s4 B’s) lying within km/s of the median redshift were selected as cluster members, twelve of which (11 A’s1 B’s) are star forming galaxies with a detectable [OII] 3727 Å line (EW([OII]) ). Magnitudes of cluster members range from (the BCG) to the spectroscopic limit of .
More recently, a fourth spectroscopic programme (ID 081.A-0759D, PI: M.Tanaka), mostly aimed at the outskirts of the cluster, was carried out in July-August 2008 with the same 300I grism using two MXU masks. colors were used to target galaxies at the cluster redshift over an area of 3 Mpc radius. These observations yielded 6 extra passive members, two of which are within the central and are therefore included in the sample used in this paper.
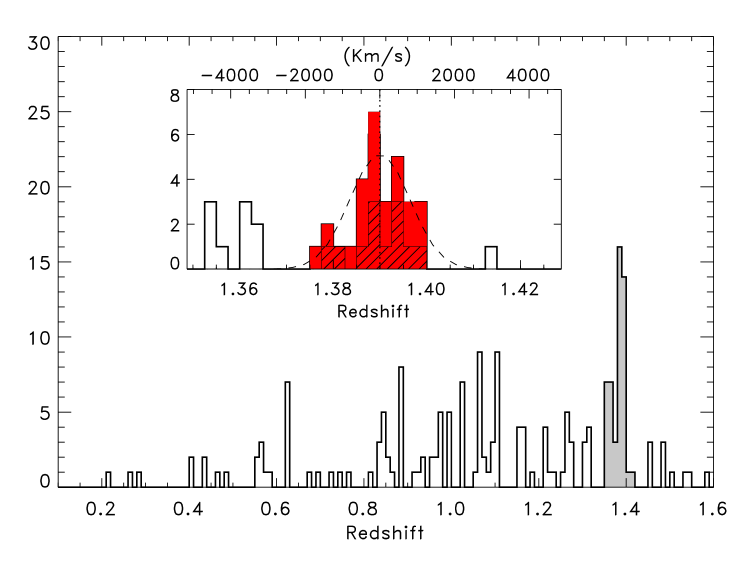
In Fig.2, we show the redshift distribution 30 cluster members, 18 passive and 12 star-forming galaxies. The latter all lie at projected distances larger than kpc. We estimated the velocity dispersion using the ROSTAT algorithm of Beers et al. (1990), which yields km/s with formal boostrap errors. A detailed dynamical analysis of the entire redshift sample will be presented in a forthcoming paper. From the redshift catalog, we defined a sample of 16 passive galaxies, which are covered by the ACS and ISAAC data, and whose spectrophotometric properties are modeled in the following section to age-date their underlying stellar populations. A complete catalog with redshifts from the whole spectroscopic campaign, as well as photometric and morphological measurements using the enhanced HST/ACS observations, HST/NICMOS and VLT/HAWK-I data, will be presented in a forthcoming paper (Strazzullo et al., Nunez et al. in prep.). We have verified that the photometry used in this paper is in very good agreement with the one in the final augmented imaging data set.
3 Star-formation histories of passive members
The spectro-photometric data described in the previous section were used to constrain ages and star formation histories (SFHs) of the 16 passive galaxies (i.e., those with no detectable [OII] emission) covered by the ACS and ISAAC data. To this end, we used the technique described in Gobat et al. (2008), which combines both the spectral energy distributions (SED) and spectra of galaxies to characterize the underlying stellar populations with spectral synthesis models. This generally allows stronger constraints to be obtained, by mitigating inherent degeneracies among stellar population parameters. The same technique was used in Santos et al. (2009) to age date early-type galaxies in a cluster at . ACS imaging shows that all the galaxies have early-type morphologies, however we defer the morphological analysis to another paper (Strazzullo et al. in prep.).
We used a grid of Bruzual&Charlot (2003, BC03) -models, characterized by a delayed exponential star-formation rate (SFR) , where is the time since the onset of star formation and a characteristic time scale (corresponding to the time of the SFR peak). Solar metallicity and a Salpeter initial mass function were adopted. Since spectra extend to rest-frame wavelengths shorter than 3200Å, we used BC03 templates which include the Pickles (1998) stellar library in the mid-UV. SEDs are constrained by the four photometric bands described in Section 2.1: J, KS, , . Stellar masses for the 16 passive galaxies are obtained, together with ages, T, and characteristic times, , by fitting the SEDs with the constraint that T is bound to be less than Gyr, which limits the star formation epoch to . Stellar masses range between and apart from the BCG. The four red galaxies in the core (within 100 kpc radius) all exceed with the BCG being by far the most massive of the four, with .
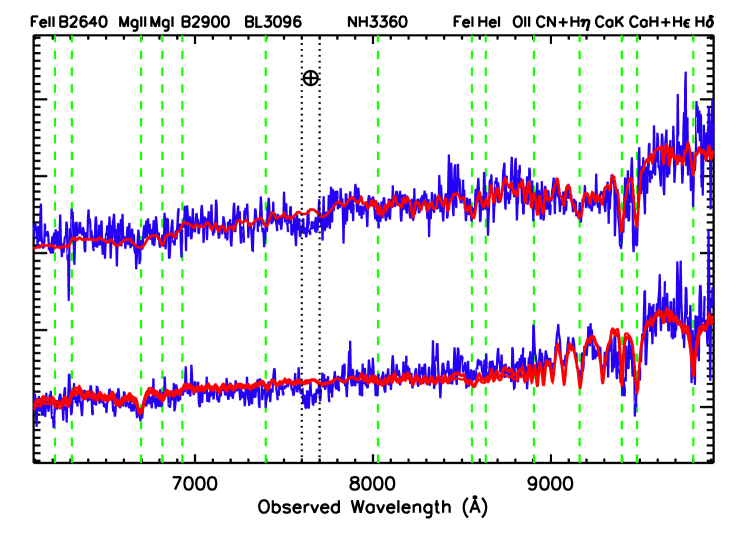
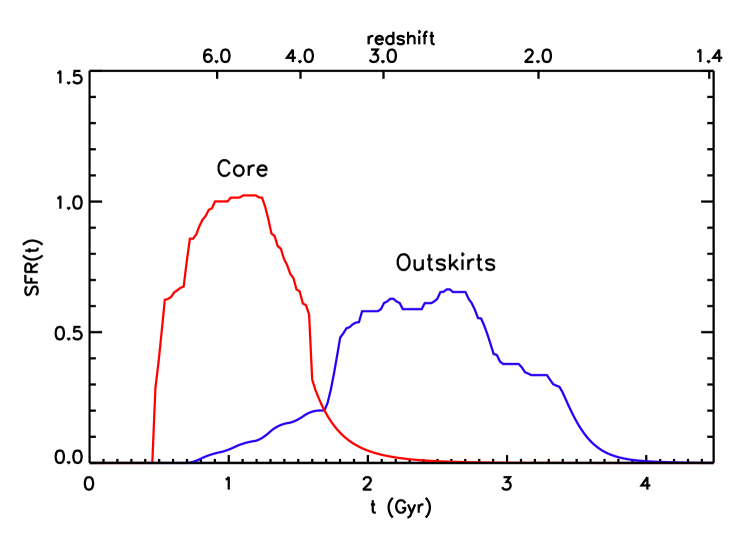
In order to have a more robust estimate of the SFHs of massive passive galaxies in XMM2235, we stacked the SEDs and spectra of all 16 members and then separately the four in the core and the 12 lying in the outskirts at cluster-centric distances kpc (Figs.4 and 4). Note that these coadded spectra have a similar S/N ratio, despite the difference in the number of galaxies in each sample. This is due to the higher luminosities of the core members. The composite spectra have a , making the fit with BC03 models meaningful. As described in Gobat et al. (2008), we reconstruct the SFH for a given subsample by first fitting their average SED, which yields a confidence region in the () space. The subgrid of models within this region is then used to find the best fit solution to the average spectrum. Finally, the SFH which best fits the spectro-photometric data is obtained by computing the mean, at each epoch, of all models lying within the 3 confidence region of the fit to the average composite spectrum and average SED (22 models for the outskirts sample and 13 for the core sample). The result is shown in Fig.5. A stark difference in the derived SFHs of galaxies in the core and the cluster outskirts is apparent. Galaxies in the core have formed their stars at early epochs, with star-formation weighted ages of Gyr, consistent with a single burst of star formation at . Those lying outside the core have Gyr, corresponding to , and a final formation redshift (when 99% of the stellar is assembled) of . We note that the areas of the SFH curves in Fig.5 are arbitrarily normalized to one, since we are only interested in the difference of the SF time scale between the two samples. It is clear that the inferred SFH is model dependent and is generally not a unique solution. The difference in the underlying stellar populations of the two samples is significant, however, and is evident from the inspection of their composite spectra and best fit BC03 models (Fig.4). When compared with galaxies in the core, galaxies in the outskirts show significant post-starforming features (deep balmer lines) as well as a smaller 4000Å break in addition to having a bluer average SED. Galaxies in the outskirts show residual star forming activity about Gyr before the epoch of observation. Note that the [OII] line is not detected even in the stacked spectrum of all the passive galaxies, consistent with no significant star formation at .
These findings are in very good agreement with those of Lidman et al. (2008), who used the mean color and scatter of a high-quality color-magnitude diagram of XMM2235, based on VLT/HAWK-I measurements, to infer a formation redshift of for galaxies in the cluster core ( kpc), in contrast with those outside the core which instead exhibit a larger scatter and bluer colors. The SFHs in Fig.5, which was derived from independent spectro-photometric data, elucidate the difference between these two populations. This result is consistent with a scenario where the central galaxies formed rapidly at high redshift and ceased forming stars early while galaxies outside the immediate core continued star formation for at least 1 Gyr longer, or alternatively formed most of their stars Gyr later.
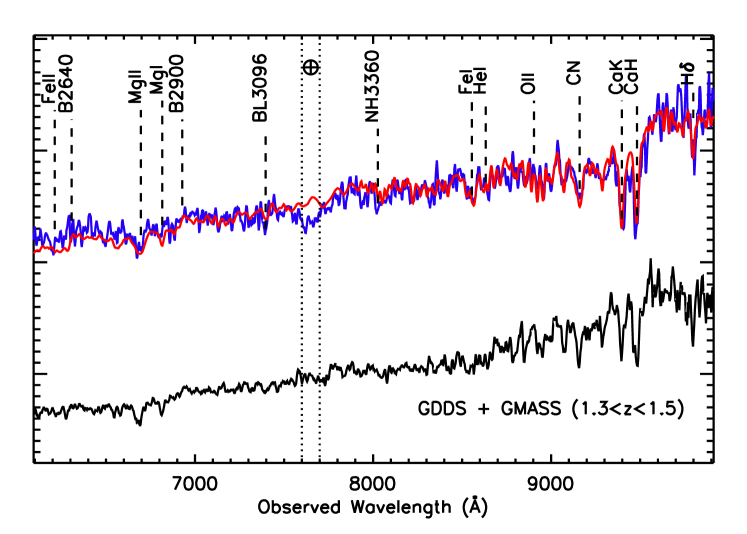
The average spectrum of the 16 passive galaxies and the best fit BC03 model to the spectro-photometric data are shown in Fig.4. For comparison, we also show the composite spectrum of field early-type galaxies at a similar redshift and covering are similar range of stellar masses, which was obtained by combining 11 GDSS (Abraham et al., 2004) and 3 GMASS (Cimatti et al., 2008) spectra in the range . It is interesting to note that, similar to what was found by Gobat et al. (2008) (see also Rettura et al., 2008), who compared the SFHs of early-type galaxies in a massive cluster at with those in the field, the 4000Å break in cluster early-type galaxies appears to be larger than those in field galaxies, suggesting a higher formation redshift or a shorter duration of the star forming phase for early-type galaxies in massive clusters. Menci et al. (2008) found this observational scenario to be in good agreement with expectations from semi-analytic models of galaxy formation in which SFHs of cluster galaxies of a given mass are modulated by environmental effects.
4 Chandra Observations
XMM2235 was observed with the Chandra ACIS–S detector in VFAINT mode in five exposures of 44 ks (Obs ID 6975), 24 ks (Obs ID 6976), 80 ks (Obs ID 7367), 33 ks (Obs ID 7368) and 15 ks (Obs ID 7404). The data were reduced using the Chandra CIAO software V4.1 (December 08 release) and related calibration files, starting from the level 1 event file as described in Rosati et al. (2004). The total effective exposure time is 196 ks after the application of this reduction procedure.
In Fig. 1, we show a color composite image combining the HST/ACS and VLT/ISAAC observations with overlaid Chandra X-ray contours in the soft band. The diffuse X–ray emission from the cluster can be traced out to ( above the background), corresponding to 0.5 Mpc. The Chandra image immediately shows that point sources do not significantly contaminate the cluster emission, as it is sometimes the case in distant clusters (e.g. Stanford et al., 2001; Bignamini et al., 2008).
4.1 X–ray Spectral analysis
We performed a global spectral analysis in an elliptical region with semi-major and semi-minor axes and centered on the peak of the photon distribution (RA, Dec=, J2000), after masking out point sources. In this aperture, which maximizes the S/N, we detected approximately 1900 net counts in the 0.3–10 keV band. The background was obtained from a large annulus around the cluster position, after subtraction of point sources. We also avoided regions where missing columns significantly decrease the background intensity. The background photon file was scaled to the source file by the ratio of the geometrical area. The response matrices and the ancillary response matrices were computed for each exposure with the tool mkwarf and mkacisrmf applied to the extracted regions.
The spectra were analyzed with XSPEC v12.3.1 (Arnaud, 1996) and fitted with a single temperature MEKAL model (Liedahl et al. (1995)), where the ratio between the elements are fixed to the solar value as in Anders & Grevesse (1989, hereafter angr). These values for the solar metallicity have recently been superseded by the new values of Grevesse & Sauval (1998), who used a 0.676 times lower Fe solar abundance (see also Asplund et al., 2005). However, we prefer to report Iron abundance in units of angr since most of the literature still refers to these old values. Since our metallicity depends only on the Fe abundance, updated metallicities can be obtained simply by rescaling by 1/0.676 the values reported here. We modeled the Galactic absorption with the tool tbabs (see Wilms, Allen, & McCray, 2000).
Spectral fits were performed over the energy range 0.5–7 keV. We exclude photons with energy below 0.5 keV in order to avoid systematic biases in the temperature determination due to uncertainties in the ACIS calibration at low energies. We checked that the measured temperature does not depend significantly on the lower bound, , of the energy range (by changing in the range 0.3–1.2 keV, T changes by ). We also exclude energies above 7 keV where the signal is dominated by noise. We used three free parameters in our spectral fits: temperature, metallicity and normalization. The local absorption was frozen to the Galactic neutral hydrogen column density cm-2, as obtained from radio data (Dickey & Lockman, 1990), and the redshift was set to , as measured from the optical spectroscopy. Spectral fits were performed using Cash statistics (as implemented in XSPEC) of source plus background photons, which is preferable for low signal–to–noise spectra. We also performed the same fits with statistics (with a standard binning with a minimum of 20 photons per energy channel in the source plus background spectrum) and verified that our best–fit model gives a reduced for 107 degrees of freedom. All quoted errors below correspond to , or the 68% confidence level for one interesting parameter.
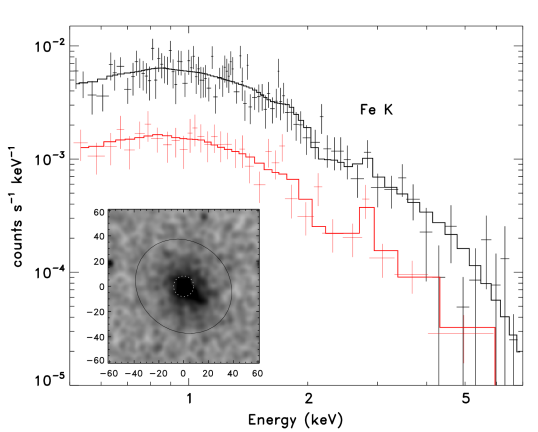
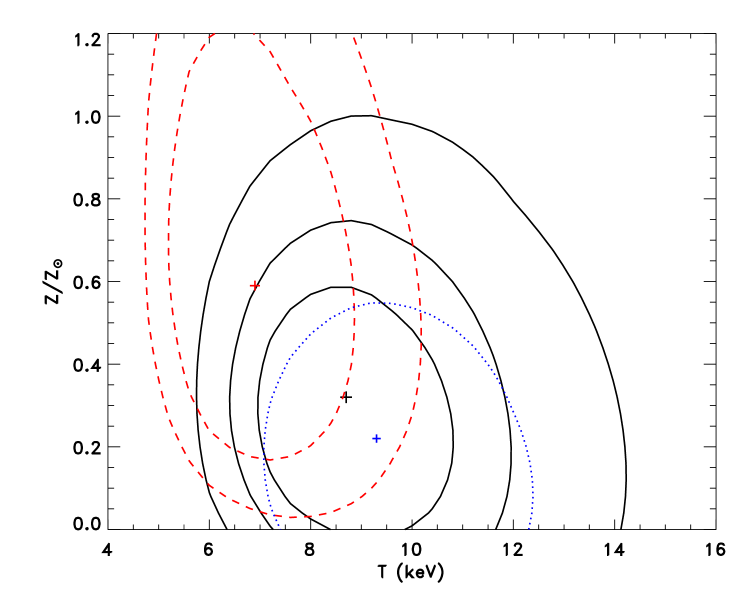
The Chandra folded spectra of XMM2235, extracted from the whole elliptical area and the inner core, are shown in Fig. 6. The corresponding extraction regions are indicated on the inset image. A significant Fe K line is visible at keV. Confidence contours from the spectral fit in the plane are shown in Fig. 7. The fit to the global spectrum gives a best fit temperature of keV, and a best fit metallicity of ( error bars). By leaving Galactic absorption as a free parameter, we obtained cm-2, thus consistent with the Galactic value. In this case, the best fit temperature is consistent (within ) with the aforementioned best fit value. Interestingly, leaving the redshift free, a four parameter fit yields , which shows how accurately the redshift can be determined from the X-ray data alone due to the detection of the iron line.
The best fit model corresponds to an unabsorbed flux within the elliptical aperture of in the 0.5-2 keV band. This corresponds to a luminosity of in the rest frame 0.5-2 keV band, and a bolometric luminosity of . One can use the best fit double -model of the surface brightness profile described below to extrapolate these luminosities at larger radii. For example, values need to be multiplied by a factor 1.3 to encircle the flux within Mpc. Thus, the bolometric luminosity is erg s-1 . We note that the X-ray luminosity and temperature of XMM2235 are consistent with the relation determined for hot clusters at (e.g. Rosati et al., 2002).
We performed several checks in order to assess the robustness of our results against systematics. By changing background regions, e.g. choosing different external circular regions as opposed to the annulus above, the best fit temperature varies by only a few %. More recently, a possible calibration problem of ACIS-S at high energies has been under discussion, which has supposedly been alleviated by the latest calibration files used here. It has been claimed that it biases the temperature of hot low- clusters to higher values, an effect that is limited to 5% when the energy range is restricted to 5 keV (L. David, private communication). We note that by using Chandra calibrations of 2007 shortly after the observations, we obtain a temperature of 9.2 keV (still consistent with the current value at the level), whereas the best fit value remains stable over the last two CIAO software releases. We also note that the bias is reduced, because, at , the exponential Bremsstrahlung cut off is observed at significantly lower energies. By repeating our fit in the energy range keV, we find that the best fit temperature decreases by only 0.04 keV.
As shown below, the Chandra data reveal a significant excess in the center of the X-ray surface brightness (SB) profile of XMM2235, which is usually interpreted as the presence of a cool core. A spectral analysis of the inner 8″(67 kpc) radius, containing only 400 net counts, yields a best–fit temperature keV, and an Iron abundance of (dashed contours in Fig7). This suggests the presence of a cool core with higher Iron abundance, a result that needs significantly more statistics to be confirmed. We also repeated the spectral analysis removing this cool core region of 8.0″radius (the dotted 1- contour in Fig. 7) from the total elliptical region and find keV.
4.2 X-ray spatial analysis and Mass determination
The distribution of the soft X-ray emission is clearly elongated in the NE direction, resembling the distribution of cluster galaxies in the core (see Fig. 1 and also Lidman et al. 2008). Inspection of the surface brightness (SB) profile readily shows the presence of excess emission in the central kpc, which indicates the presence of a cool core, a clear signature of the dynamically relaxed state of the cluster (see Santos et al. (2008) for a discussion of cool cores in this as well as in other high- clusters). Here, we report on the modeling of the SB profile, enabled by the angular resolution and depth of the Chandra observations, which is then used to estimate the mass of XMM2235.
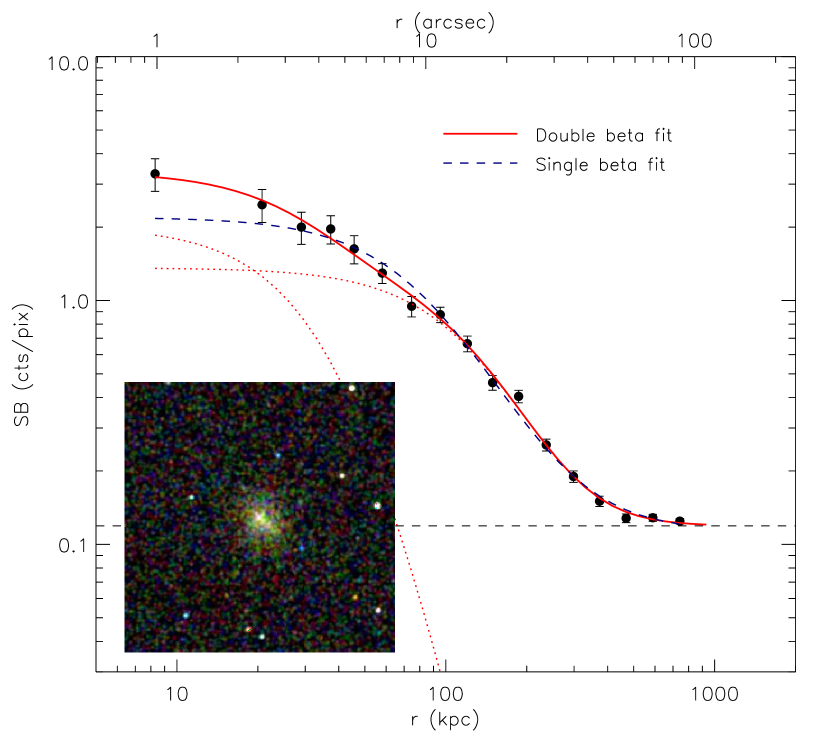
The presence of a cool core is generally revealed by a gas density excess in the central regions of clusters, compared to a single model profile, so as to guarantee hydrostatic equilibrium. This is clearly illustrated in Fig.8. By using a projected single model plus background, , we obtain a poor fit in the inner region with kpc, with a reduced of 2.05. A much better fit is obtained with a double model fit, , which yields kpc, (fixed), kpc, , .
This information, assuming hydrostatic equilibrium and isothermality of the gas, leads to a deprojected gas density profile and to an estimate of the total mass. We defer to a forthcoming paper (Rosati et al. in prep.) a detailed discussion of the X-ray mass profile of XMM2235, with a full deprojection analysis down to the core and a measurement of the gas fraction, as well as independent measurements of the total mass at different radii from a dynamical analysis of all cluster members and the modeling of a strong lensing system. We note here that the total gravitating mass profile at large radii () is very well approximated by a single model for the gas density profile which leads to the well-known expression: , where , is the mean molecular weight in atomic mass unit (), is the gravitational constant, and is the proton mass. Hence, . Using the best fit temperature and the single -model parameters above, one obtains a total mass of . Cluster masses are conveniently measured within , the radius of the sphere within which the cluster overdensity is 500 times the critical density of the Universe at the cluster redshift. Using the scaling relation among , temperature and redshift derived in Ettori et al. (2004) one obtains for XMM2235 Mpc and therefore . To estimate the cluster virial mass, we have to extrapolate our mass measurement to larger radii assuming for example a Navarro, Frenk, & White (1996) profile with concentration . This yields . Note that assuming a lower concentration, e.g. , the virial mass would only be a few % lower. These values for the total mass indicate that XMM2235 is the most massive cluster at discovered to date (see Ettori et al. 2004 for a compilation of the masses of distant clusters derived from Chandra data).
As discussed in Jee et al. (2009), the X-ray mass profile, which is based on the assumptions of hydrostatic equilibrium and an isothermal gas, is found to be in very good agreement with the mass density profile derived from the weak lensing analysis of XMM2235 from deep HST/ACS data, which reveals a significant shear well beyond the X-ray SB limit of 1′ (or 500 kpc). Specifically, using the projection formula for the -profile in Jee et al. (2005), a projected X-ray mass within 1 Mpc of is found, in excellent agreement with the one derived from the shear lensing map. We refer to the Jee et al. (2009) paper for a discussion on how rare the observation of such a massive cluster is, based on the survey volume from which the cluster was discovered and the cluster mass function in CDM cosmology.
5 Discussion and Conclusions
We presented a combination of spectro-photometric data from VLT and HST, as well as deep Chandra observations of the X-ray selected cluster XMMU J2235.32557 at and used them to characterize the galaxy populations of passive members, the thermodynamical properties of the hot gas and the total mass of the system.
Despite surface brightness dimming, due to the high redshift of the cluster, the Chandra data show extended X-ray emission out to Mpc. The X-ray emission has a regular morphology and is clearly elongated in the same way as the distribution of red passive galaxies in the core as well as the major axis of the BCG. An excess of emission in the inner 50 kpc is clearly detected and naturally interpreted as a cool core. The spectral analysis of the Chandra data reveals that XMM2235 has a global temperature of keV (68% confidence), which we find robust against several systematics involved in the X-ray spectral analysis. If we assume hydrostatic equilibrium, a well justified condition given the relaxed appearance and the canonical ratio of the cluster, and an isothermal gas distribution, the X-ray surface brightness profile yields a total mass at large radii ( kpc) of .
Overall, our analysis implies that XMM2235 is the hottest and most massive bona–fide cluster discovered to date at . These findings are corroborated by the weak lensing analysis from deep HST/ACS data (Jee et al., 2009) which provides a mass profile in very good agreement with the X-ray measurement. The presence of a significant cool core is additional evidence of the advanced dynamical state of the cluster (e.g. Fabian, 1994).
In characterizing the passive galaxy population of XMM2235, we have extended the analysis of the ACS Intermediate Redshift Cluster Survey at (Mei et al., 2009; Demarco et al., 2007) to higher redshifts. Using a large sample of spectroscopically identified cluster members, we inferred the SFHs of passive galaxies in the core ( kpc) and in the outskirts by modeling their spectro-photometric data with spectral synthesis models. We find a clear contrast in the underlying stellar populations of the two samples. Core galaxies, all with photometric stellar masses in excess of , appear to have formed at an earlier epoch with a relatively short star formation phase (), whereas passive galaxies outside the core show spectral signatures that suggest a star formation phase that is prolonged to later epochs, to redshifts as low as . The latter are presumably the infalling population of galaxies that are in the process of populating the red sequence. These results are also consistent with their mean color and scatter of the red sequence (Lidman et al., 2008).
The on-going star formation is confined to the outskirts of XMM2235, as galaxy members with a detectable [OII] emission line avoid the inner 250 kpc region. Also in this respect, XMM2235 has already reached an advanced evolutionary stage, as star formation is suppressed in galaxies well before they reach the center, similarly to low redshift massive clusters.
We note that the environmental age gradient we find in XMM2235, as well as in other clusters (e.g. Mei et al., 2009), is significantly steeper than the relatively mild difference found between field and cluster early-type galaxies of similar stellar masses (Gobat et al., 2008). This shows the importance of environmental effects in driving galaxy evolution, in keeping with expectations from hierarchical galaxy formation models (e.g. Menci et al., 2008). It would be interesting to study whether the radial age gradient of galaxy populations becomes larger with increasing redshifts. This would require homogeneous galaxy selection criteria in large samples of distant clusters with homogeneous photometric measurements, a task which might be challenging with current data.
At increasing redshifts, the observational effects of different evolutionary histories of galaxies from cluster to cluster should become apparent. Mild differences have been detected so far in the most distant X-ray luminous clusters (e.g. Mei et al., 2009, in the mean color of the color sequence) of otherwise very homogeneous populations. Hilton et al. (2009) carried out a detailed photometric and morphological study of XMMXCS J2215.9-1738 at , currently the most distant spectroscopically confirmed X-ray luminous cluster. Based on its X-ray temperature and luminosity, as well its velocity dispersion, this cluster is less massive than XMM2235 and appears to be in a younger dynamical state based on its velocity distribution (Hilton et al., 2007). Another striking difference between the two clusters is the lack of a dominant BCG in XMM2215. However, as in XMM2235, the galaxy population of XMM2215 is dominated by early-type galaxies with ages of Gyr, based on the scatter of its red sequence, implying a major episode of star formation at epochs . Unfortunately, it is difficult to directly compare these results with those we obtained for XMM2235 as the mean ages of the early-type galaxies were estimated with different methods. A similar comparative study with optically selected clusters would be very interesting but is still lacking. In general, the study of cluster-to-cluster variance in distant clusters, leading to different evolutionary histories of cluster galaxies, could provide further tests for galaxy evolution models. A robust comparison among different clusters however would require a homogeneous observing campaign with the same set of instruments and filters so as to minimize systematics in photometric measurements and model dependent K-corrections.
Another notable result of our study is the measured metal abundance of the intracluster medium (ICM) from the detection of the Fe-K line in the Chandra spectrum, essentially coming from the cluster core ( kpc where most of the Chandra counts are contained). This extends to even larger look-back times the evidence that the ICM was already significantly enriched in distant clusters, as found in a systematic study of clusters at (Balestra et al., 2007; Maughan et al., 2008), and therefore that metal enrichment of the ICM was mostly complete at early epochs. In light of the derived SFH of the core red galaxies this is not unexpected. Chemical evolution models of elliptical galaxies (e.g. Pipino & Matteucci, 2004) predict that chemical enrichment of massive elliptical galaxies, which experience a short burst of star formation at early epochs, occurs on a time scale of 1 Gyr. Galactic winds distribute metals in the cluster core region on a crossing time scale ( Gyr). As a result, one would expect the metal enrichment of the ICM to be completed by (2 Gyr earlier than the cluster look-back time of 9 Gyr), consistently with the derived SFH of the core galaxies.
It remains somewhat surprising that such a massive cluster, which was discovered from a relatively small survey area (11 deg2), is found with a baryonic content in such an advanced evolutionary stage at an epoch corresponding to 1/3 of the current age of the Universe, both in terms of its galaxy population and of the hot intracluster gas. Further results on the galaxy populations of XMM2235 as well as its mass distribution, taking advantage of an augmented multi-wavelength data set, will be presented in forthcoming papers.
Given its large mass, XMM2235 will also likely be an ideal target for a new array of Sunayev-Zeldovich (SZ) experiments which are already operational (e.g. Staniszewski et al., 2009) or are becoming available. These observations will add independent, important information on the physics of the ICM and the total mass of XMM2235 and will be useful to calibrate the expectations of a new era of SZ cluster surveys.
Acknowledgements.
We acknowledge the excellent support provided by the VLT staff at the Paranal observatory. We thank S.Ettori and S.Borgani for useful discussions. PT acknowledges financial support from contract ASI-INAF I/088/06/0 and from the PD51 INFN grant. JSS acknowledges support by the Deutsche Forschungsgemeinschaft under contract BO702/16-2. RG acknowledges partial support by the DFG cluster of excellence “Origin and Structure of the Universe” (www.universe-cluster.de). GL was supported by the DLR under contract numbers 50OX0201 and 50QR0802.References
- Abraham et al. (2004) Abraham, R. G., Glazebrook, K., McCarthy, P. J., et al. 2004, AJ, 127, 2455
- Anders & Grevesse (1989) Anders, E. & Grevesse, N. 1989, Geochim. Cosmochim. Acta., 53, 197
- Arnaud (1996) Arnaud, K. A. 1996, in Astronomical Society of the Pacific Conference Series, Vol. 101, Astronomical Data Analysis Software and Systems V, ed. G. H. Jacoby & J. Barnes, 17
- Asplund et al. (2005) Asplund, M., Grevesse, N., & Sauval, A. J. 2005, in Astronomical Society of the Pacific Conference Series, Vol. 336, Cosmic Abundances as Records of Stellar Evolution and Nucleosynthesis, ed. T. G. Barnes, III & F. N. Bash, 25
- Balestra et al. (2007) Balestra, I., Tozzi, P., Ettori, S., et al. 2007, A&A, 462, 429
- Beers et al. (1990) Beers, T. C., Flynn, K., & Gebhardt, K. 1990, AJ, 100, 32
- Bignamini et al. (2008) Bignamini, A., Tozzi, P., Borgani, S., Ettori, S., & Rosati, P. 2008, A&A, 489, 967
- Blakeslee et al. (2003) Blakeslee, J. P., Anderson, K. R., Meurer, G. R., Benítez, N., & Magee, D. 2003, in Astronomical Society of the Pacific Conference Series, Vol. 295, Astronomical Data Analysis Software and Systems XII, ed. H. E. Payne, R. I. Jedrzejewski, & R. N. Hook, 257
- Boehringer et al. (2005) Boehringer, H., Mullis, C., Rosati, P., et al. 2005, The Messenger, 120, 33
- Bruzual & Charlot (2003) Bruzual, G. & Charlot, S. 2003, MNRAS, 344, 1000
- Cimatti et al. (2008) Cimatti, A., Cassata, P., Pozzetti, L., et al. 2008, A&A, 482, 21
- Demarco et al. (2007) Demarco, R., Rosati, P., Lidman, C., et al. 2007, ApJ, 663, 164
- Dickey & Lockman (1990) Dickey, J. M. & Lockman, F. J. 1990, ARA&A, 28, 215
- Eisenhardt et al. (2008) Eisenhardt, P. R. M., Brodwin, M., Gonzalez, A. H., et al. 2008, ApJ, 684, 905
- Ettori et al. (2004) Ettori, S., Tozzi, P., Borgani, S., & Rosati, P. 2004, A&A, 417, 13
- Fabian (1994) Fabian, A. C. 1994, ARA&A, 32, 277
- Fassbender (2007) Fassbender, R. 2007, PhD thesis, Ludwig-Maximilians-Universitaet Muenchen, arXiv:0806.0861
- Ford et al. (2004) Ford, H., Postman, M., Blakeslee, J. P., et al. 2004, in Astrophysics and Space Science Library, Vol. 319, Penetrating Bars Through Masks of Cosmic Dust, ed. D. L. Block, I. Puerari, K. C. Freeman, R. Groess, & E. K. Block, 459, arXiv:0408165
- Gobat et al. (2008) Gobat, R., Rosati, P., Strazzullo, V., et al. 2008, A&A, 488, 853
- Grevesse & Sauval (1998) Grevesse, N. & Sauval, A. J. 1998, Space Science Reviews, 85, 161
- Hilton et al. (2007) Hilton, M., Collins, C. A., Stanford, S. A., et al. 2007, ApJ, 670, 1000
- Hilton et al. (2009) Hilton, M., Stanford, S. A., Stott, J. P., et al. 2009, ApJ, 697, 436
- Holden et al. (2007) Holden, B. P., Illingworth, G. D., Franx, M., et al. 2007, ApJ, 670, 190
- Jee et al. (2009) Jee, M. J., Rosati, P., Ford, H. C., et al. 2009, ApJ, 704, 672
- Jee et al. (2005) Jee, M. J., White, R. L., Ford, H. C., et al. 2005, ApJ, 634, 813
- Kodama et al. (2007) Kodama, T., Tanaka, I., Kajisawa, M., et al. 2007, MNRAS, 377, 1717
- Kriek et al. (2006) Kriek, M., van Dokkum, P. G., Franx, M., et al. 2006, ApJ, 649, L71
- Lamer et al. (2008) Lamer, G., Hoeft, M., Kohnert, J., Schwope, A., & Storm, J. 2008, A&A, 487, L33
- Lidman et al. (2008) Lidman, C., Rosati, P., Tanaka, M., et al. 2008, A&A, 489, 981
- Liedahl et al. (1995) Liedahl, D. A., Osterheld, A. L., & Goldstein, W. H. 1995, ApJ, 438, L115
- Maughan et al. (2008) Maughan, B. J., Jones, C., Forman, W., & Van Speybroeck, L. 2008, ApJS, 174, 117
- Mei et al. (2009) Mei, S., Holden, B. P., Blakeslee, J. P., et al. 2009, ApJ, 690, 42
- Mei et al. (2006) Mei, S., Holden, B. P., Blakeslee, J. P., et al. 2006, ApJ, 644, 759
- Menci et al. (2008) Menci, N., Rosati, P., Gobat, R., et al. 2008, ApJ, 685, 863
- Mullis et al. (2005) Mullis, C. R., Rosati, P., Lamer, G., et al. 2005, ApJ, 623, L85
- Navarro et al. (1996) Navarro, J. F., Frenk, C. S., & White, S. D. M. 1996, ApJ, 462, 563
- Persson et al. (1998) Persson, S. E., Murphy, D. C., Krzeminski, W., Roth, M., & Rieke, M. J. 1998, AJ, 116, 2475
- Pickles (1998) Pickles, A. J. 1998, PASP, 110, 863
- Pipino & Matteucci (2004) Pipino, A. & Matteucci, F. 2004, MNRAS, 347, 968
- Postman et al. (2005) Postman, M., Franx, M., Cross, N. J. G., et al. 2005, ApJ, 623, 721
- Renzini (2006) Renzini, A. 2006, ARA&A, 44, 141
- Rettura et al. (2008) Rettura, A., Rosati, P., Nonino, M., et al. 2008, arXiv:0806.4604, ApJ, in press
- Rosati et al. (2002) Rosati, P., Borgani, S., & Norman, C. 2002, ARA&A, 40, 539
- Rosati et al. (2004) Rosati, P., Tozzi, P., Ettori, S., et al. 2004, AJ, 127, 230
- Santos et al. (2009) Santos, J. S., Rosati, P., Gobat, R., et al. 2009, A&A, 501, 49
- Santos et al. (2008) Santos, J. S., Rosati, P., Tozzi, P., et al. 2008, A&A, 483, 35
- Sirianni et al. (2005) Sirianni, M., Jee, M. J., Benítez, N., et al. 2005, PASP, 117, 1049
- Stanford et al. (2001) Stanford, S. A., Holden, B., Rosati, P., et al. 2001, ApJ, 552, 504
- Stanford et al. (2006) Stanford, S. A., Romer, A. K., Sabirli, K., et al. 2006, ApJ, 646, L13
- Staniszewski et al. (2009) Staniszewski, Z., Ade, P. A. R., Aird, K. A., et al. 2009, ApJ, 701, 32
- van Dokkum & van der Marel (2007) van Dokkum, P. G. & van der Marel, R. P. 2007, ApJ, 655, 30
- Voit (2005) Voit, G. M. 2005, Reviews of Modern Physics, 77, 207
- Wilms et al. (2000) Wilms, J., Allen, A., & McCray, R. 2000, ApJ, 542, 914
- Wilson et al. (2009) Wilson, G., Muzzin, A., Yee, H. K. C., et al. 2009, ApJ, 698, 1943
- Zirm et al. (2008) Zirm, A. W., Stanford, S. A., Postman, M., et al. 2008, ApJ, 680, 224