Novel phase diagram for antiferromagnetism and superconductivity in pressure-induced heavy-fermion superconductor Ce2RhIn8 probed by In-NQR
Abstract
We present a novel phase diagram for the antiferromagnetism and superconductivity in Ce2RhIn8 probed by In-NQR studies under pressure (). The quasi-2D character of antiferromagnetic spin fluctuations in the paramagnetic state at = 0 evolves into a 3D character because of the suppression of antiferromagnetic order for 1.36 GPa (QCP: antiferromagnetic quantum critical point). Nuclear-spin-lattice-relaxation rate measurements revealed that the superconducting order occurs in the range 1.36 – 1.84 GPa, with maximum 0.9 K around 1.36 GPa.
pacs:
74.25.Ha; 74.62.Fj; 74.70.Tx; 75.30.KzI I. INTRODUCTION
The heavy-fermion (HF) compounds CeIn3 Mathur ; Knebel and CeTIn5 (T = Co, Rh, Ir) Petrovic1 ; Hegger ; Muramatsu ; Petrovic2 revealed an intimate relationship between antiferromagnetism (AFM) and superconductivity (SC) Kitaoka . CeIn3 has a cubic crystal structure, and it is expected to exhibit the three-dimensional (3D) magnetic interaction. CeIn3 is an antiferromagnet with K at ambient pressure ( = 0), and AFM discontinuously collapses around = 2.46 GPa, suggesting that the quantum phase transition from AFM to paramagnetism (PM) is of the first order SKawasaki1 ; SKawasaki2 . SC appears in a narrow pressure range = 2.28 – 2.65 around , and reaches the maximum value ( 0.25 K) at . Non-Fermi liquid behaviors observed at pressures below evolve into Fermi-liquid behaviors at pressures that just exceed . It was suggested that the first-order quantum phase transition is responsible for the occurrence of SC in CeIn3 SKawasaki2 .
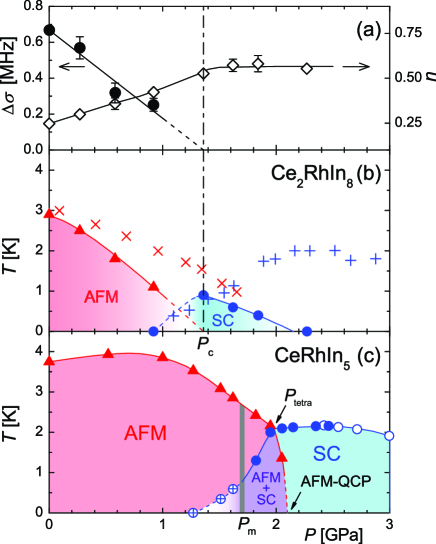
CeRhIn5, which has a tetragonal crystal structure, is also an antiferromagnet with = 3.8 K at =0 Hegger . For CeRhIn5, we have shown that the tetracritical point, where the AFM, AFM+SC, SC, and PM phases are in contact, exists at 1.98 GPa and reaches the maximum value ( 2.2 K) at approximately 2.5 GPa from the AFM quantum critical point (QCP), which lies at 2.1 GPa (see Fig. 5c) Yashima1 . In the region where exceeds 2.1 GPa, non-Fermi liquid behaviors, which were probed by the resistivity measurements Muramatsu , were observed and NQR measurements revealed the development of AFM spin fluctuations Yashima1 . CeTIn5, Ce2TIn8 and, CeIn3 (T = Co, Rh, Ir) are a series of structurally related materials with chemical compositions of the form CemTIn3m+2 with = 1, 2, , respectively. Ce2TIn8 enables us to study the relationship between the structure-based evolution of magnetic characteristics and the onset of unconventional SC in HF systems.
Ce2RhIn8 is an antiferromagnet with = 2.8 K at = 0 Bao . The collinear antiferromagnetic structure with a magnetic wave vector and a magnetic moment of 0.55 per Ce ion was reported from the neutron scattering measurements Bao . The pressure-temperature () phase diagrams of Ce2RhIn8 reported thus far are based on resistivity, ac-susceptibility, and heat-capacity measurements Nicklas ; Ohara ; Ueda ; Lengyel . The resistivity measurements revealed that as increases, monotonously decreases down to 1.2 K at 1.5 GPa; further, SC occurs for 1 GPa and exhibits the maximum ( 2 K) around 2.3 GPa. On the other hand, the heat-capacity measurements indicated that an AFM order survives up to = 1.65 GPa, but no anomalies that signal the onset of SC were observed. The previously reported NQR- measurement was performed to investigate the onset of SC with = 0.9 K at = 1.87 GPa Fukazawa . In this context, a phase diagram for Ce2RhIn8 is not yet fully understood.
II II. Experimental procedure
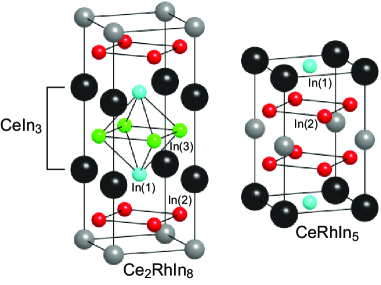
For obtaining NQR measurements, Ce2RhIn8 grown by the self-flux method was moderately crushed into a coarse powder to allow RF pulses to easily penetrate the sample. Hydrostatic pressure was applied using a NiCrAl-BeCu piston-cylinder cell filled with a Si-based organic liquid as the pressure-transmitting medium Kirichenko . To calibrate the pressure at low temperatures, the shift in the of Sn metal was monitored by using the resistivity measurements. Figure 1 illustrates the crystal structure of Ce2RhIn8, which consists of alternating layers of CeRhIn5 and CeIn3. There are three In sites per unit cell, denoted by In(1), In(2), and In(3). In(1) and In(2) are located in the CeRhIn5 layer, shown in Fig. 1, and In(3) is located in the CeIn3 layer. The measurements for the 115In-NQR () spectrum were mainly performed at the 3 transition at In(2) in Ce2RhIn8. Here, is defined by the NQR Hamiltonian, = , where is the asymmetry parameter of the electric field gradient. Using = 16.41 MHz and = 0.43, the NQR frequency of the 3 transition is estimated as 47.4 MHz for In(2) at = 0. When an internal magnetic field is present at the In site during the onset of AFM, the NQR Hamiltonian is perturbed by the Zeeman interaction, which is given by . A broadening of the NQR spectrum due to signals the onset of AFM.
III III. RESULTS AND DISCUSSION
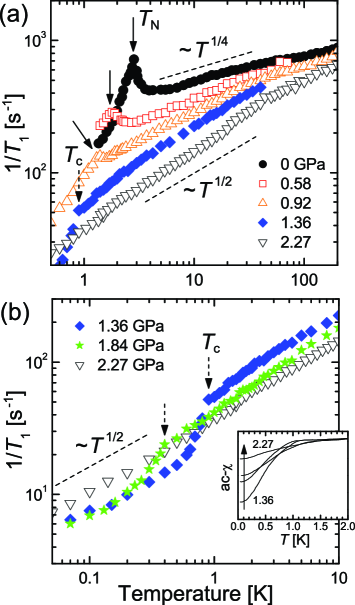
Fig. 2a shows the dependence of at high and GPa in Ce2RhIn8. A distinct peak in is associated with the onset of AFM order at K and = 0 GPa. It was reported from the resistivity measurements that the secondary anomaly () well below was observed in the vicinity of ambient Nicklas . However, it was not observed from the present NQR measurements either, as reported in the previous NQR paper by Fukazawa . Fukazawa . Note that in the PM state, increases up to 200 K at , suggesting that Ce-derived magnetic fluctuations occur in an itinerant regime; this is consistent with the NQR measurement results Fukazawa and the angle-resolved photoemission spectroscopy results Raj . The behavior is consistent with a quasi-2D AFM spin-fluctuations (SFs) model that predicts the relation near an AFM QCP Lacroix . Here, the term quasi-2D AFM SFs implies that the magnetic correlation length in the tetragonal plane develops at a faster rate than that along the c-axis and that the staggered susceptibility with the AFM wave vector is anticipated to obey the Curie-Weiss law as . In this context, it is predicted that the quasi-2D AFM SFs will obey in the vicinity of the AFM QCP, where . As increases, the determined from a peak in decreases to = 1.2 K at = 0.92 GPa. At = 1.36 GPa, a marked decrease in below 0.9 K without an accompanying peak was observed, which was unexpected. As mentioned later, this is because SC sets in below K.
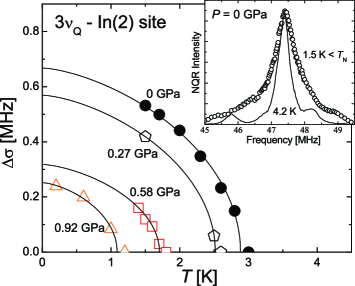
Next, we deal with the possible existence of the AFM-QCP in Ce2RhIn8. The inset in Fig. 3 shows the 3-NQR spectra corresponding to In(2) above and below at . The main peak inherent to In(2) in Ce2RhIn8 is accompanied by two satellite peaks at 45.8 and 48.2 MHz, which are thought to be due to stacking faults in the Ce2RhIn8 that consists of alternating layers of CeRhIn5 and CeIn3 since the spectral intensities of these peaks are almost negligible. In fact, the X-ray diffraction measurements revealed a diffuse scattering suggesting stacking faults along the c-axis of Ce2RhIn8 Koeda . The full width at the half maximum of the 3-NQR spectrum increases due to induced by the AFM moments that develop below . Figure 3 shows the dependence of at In(2) in Ce2RhIn8 for several pressures. Here, , which is approximately proportional to the magnitude of the AFM ordered moment. At , is well fitted by the relation , which is expected in a weak itinerant AFM Nakayama ; Hasegawa , as indicated by the solid line in Fig. 3. Using this relation for under , we tentatively estimate , as shown in Fig. 5a. Note that as increases, decreases linearly and a rough extrapolation to = 0 yields 1.36 GPa. Furthermore, note that as increases, the behavior at = 0 evolves into around , as shown in Fig. 2a. The latter relation is consistent with the 3D-AFM SFs model that predicts the relation near the 3D-AFM QCP Moriya . When assuming a simple power-law dependence for , e.g., with parameters and , the systematic variations of are fitted in the -range from well above (or ) to 30 K to obtain the dependence of , as shown in Fig. 5a. Note that progressively increases up to at GPa and remains almost constant as increases further, indicating that the crossover from the quasi-2D to 3D character of AFM SFs occurs between = 0 and 1.36 GPa.
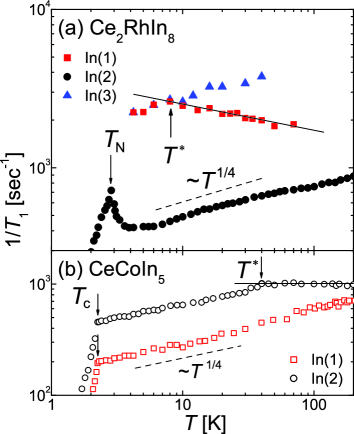
Previous papers reported that at In(1) differs from that at In(2) Fukazawa . We have confirmed that at In(3) resembles the corresponding result for In(2), but above 8 K, at In(1) deviates from the behavior, as shown in Fig. 4a. Note that the In-site dependence of was also observed in CeCoIn5, as shown in Fig. 4b. This is understood in terms of the dependence of the hyperfine-coupling constants at In sites under a crystal electric field (CEF) effect. As a matter of fact, the NMR study reported by Curro . revealed that the energy splitting between the first excited CEF level and the ground state () is estimated at 34 K and hence the hyperfine couplings at In(2) significantly changes around 50 K close to 40 K Curro . Likewise, since in Ce2RhIn8 is estimated at 14 K that was deduced from the magnetic susceptibility and magnetization measurements Ueda , the hyperfine couplings at In(1) in this compound may change around a temperature close to 8 K.
In order to demonstrate the onset of SC in Ce2RhIn8, in Fig. 2b, we present the dependences of at low and = 1.36, 1.84 and 2.27 GPa, where the AFM order collapses. Although the onset of SC is proved by the appearance of SC diamagnetism, as indicated in the inset in Fig. 2b, this diamagnetism cannot be used to identify a transition temperature for bulk SC inherent to Ce2RhIn8 under . In fact, the SC diamagnetism for 1.84 GPa starts to appear from a relatively high onwards. This may be associated with the diamagnetism arising from the CeRhIn5 contained in the sample as an impurity phase. This CeRhIn5 contamination leads to inconsistencies among phase diagrams, depending on the experimental methods Nicklas ; Ohara ; Ueda ; Lengyel . On the other hand, a marked reduction in the dependence of , which is shown in Fig. 2b, provides microscopic evidence for the development of SC in the sample at and 0.4 K and = 1.36 and 1.84 GPa, respectively. In contrast, the value at 2.27 GPa does not yield such evidence, though the diamagnetism starts to appear below 1.5 K. Thus, material-selective NQR- measurements allow us to identify the onset of the SC inherent to Ce2RhIn8 under . It is remarkable that significantly large diamagnetism and SC with K are observed at GPa. These results suggest the intimate relationship between the unconventional SC and the AFM QCP in Ce2RhIn8. Furthermore, it should be noted that SC sets in as a result of the evolution from the quasi-2D to 3D character of AFM SFs. This is in contrast to the fact that the SC dome in CeCoIn5 and CeRhIn5 with 2 K is realized around the quasi-2D AFM QCP but is separated from the phase boundary between the AFM and PM phases. These results demonstrate the intimate relationship between the dimensionality of AFM SFs and the onset of unconventional SC; the 2D character of AFM SFs is favorable to the increase of the in HF SC compounds as well as in high- copper oxides Scott .
As an indication that the symmetry of the SC gap function in Ce2RhIn8 must be considered, we note that at = 1.36 GPa decreases without the appearance of a coherence peak just below and exhibits a large kink well below , associated with the existence of the large residual density of states. These results suggest a dirty -wave SC with line-nodes gap, identical to the case of high- superconductors Ishida . This may be because difficulties in preparing the crystals containing alternating layers of CeRhIn5 and CeIn3 lead to impurities and/or crystal imperfections like stacking faults in Ce2RhIn8. It is well known that the existence of the residual density of states due to the impurity effect results in -linear behavior well below . Unexpectedly, however, the observed behavior well below cannot be simply explained by the impurity effect for unconventional SC; this indicates the persistence of low-lying excitations in the SC state due to the proximity to the AFM QCP. The enhancement of even at temperatures lower than is also observed in the uniformly coexisting state of SC and AFM around the AFM-QCP in CeCu2Si2 YKawasaki1 , CeRhIn5 Yashima3 , CeCo(In1-xCdx)5 Urbano , and CeNiGe3 Harada . However, note that in Ce2RhIn8, the behavior of is observed even in the SC state where the AFM order collapses. In this context, the phase diagram for Ce2RhIn8 is the only one that reveals the following unconventional SC characteristic: 3D-AFM SFs survive in the SC state that occurs in the relatively narrow range 1.36 – 1.84 GPa.
IV IV. CONCLUSION
In conclusion, we have established the phase diagram for Ce2RhIn8 from microscopic In-NQR measurements. The AFM order disappears at 1.36 GPa, where 3D-AFM SFs are dominant. It was demonstrated that the SC order occurs in the narrow range of 1.36 – 1.84 GPa and exhibits = 0.9 K around 1.36 GPa. We state that this phase diagram differs from the previously reported ones Bao because the latter were affected by contamination by impurity phases such as CeRhIn5. The unconventional SC in Ce2RhIn8 occurs under the development of 3D AFM SFs rather than the quasi-2D AFM SFs, as in the case of CeCoIn5Sidorov ; YKawasaki2 ; Yashima2 and CeRhIn5Muramatsu . Noting that the (= 0.9 K) for Ce2RhIn8 is significantly lower than the 2 K) for CeCoIn5 and CeRhIn5, it is suggested that the 2D character of AFM SFs plays a vital role in increasing the in strongly correlated electron systems.
V ACKNOWLEDGMENTS
This work was supported by Grants-in-Aid for Specially Promoted Research (Grant No. 20001004) and for Young Scientists (B) (Grant No. 20740195) from the Ministry of Education, Culture, Sports, Science and Technology (MEXT) of Japan. It was partially supported by the Global COE Program (Core Research and Engineering of Advanced Materials-Interdisciplinary Education Center for Materials Science) from MEXT.
References
- (1) N. D. Mathur, F. M. Grosche, S. R. Julian, I. R. Walker, D. M. Freye, R. K. W. Haselwimmer, and G. G. Lonzarich, Nature 394, 39 (1998).
- (2) G. Knebel, D. Braithwaite, P. C. Canfield, G. Lapertot, and J. Flouquet, Phys. Rev. B 65, 024425 (2001).
- (3) C. Petrovic, P. G. Pagliuso, M. F. Hundley, R. Movshovich, J. L. Sarrao, J. D. Thompson, Z. Fisk, and P. Monthoux, J. Phys.: Cond. Mat. 13, L337 (2001).
- (4) H. Hegger, C. Petrovic, E. G. Moshopoulou, M. F. Hundley, J. L. Sarrao, Z. Fisk, and J. D. Thompson, Phys. Rev. Lett. 84, 4986 (2000).
- (5) T. Muramatsu, N. Tateiwa, T. C. Kobayashi, K. Shimizu, K. Amaya, D. Aoki, H. Shishido, Y. Haga, and Y. Ōnuki, J. Phys. Soc. Jpn. 70, 3362 (2001).
- (6) C. Petrovic, R. Movshovich, M. Jaime, P. G. Pagliuso, M. F. Hundley, J. L. Sarrao, Z. Fisk, and J. D. Thompson, Europhys. Lett. 53, 354 (2001).
- (7) Y. Kitaoka, S. Kawasaki, T. Mito, and Y. Kawasaki, J. Phys. Soc. Jpn. 74, 186 (2005).
- (8) S. Kawasaki, T. Mito, Y. Kawasaki, H. Kotegawa, G.-q. Zheng, Y. Kitaoka, H. Shishido, S. Araki, R. Settai, and Y. Ōnuki, J. Phys. Soc. Jpn. 73, 1647 (2004).
- (9) S. Kawasaki, M. Yashima, Y. Kitaoka, K. Takeda, K. Shimizu, Y. Oishi, M. Takata, T. C. Kobayashi, H. Harima, S. Araki, H. Shishido, R. Settai, and Y. Ōnuki, Phys. Rev. B 77, 064508 (2008).
- (10) M. Yashima, S. Kawasaki, H. Mukuda, Y. Kitaoka, H. Shishido, R. Settai, and Y. Ōnuki, Phys. Rev. B 76, 020509(R) (2007).
- (11) W. Bao, P. G. Pagliuso, J. L. Sarrao, J. D. Thompson, Z. Fisk, and J. W. Lynn, Phys. Rev. B 64, 020401(R) (2001).
- (12) M. Nicklas, V. A. Sidorov, H. A. Borges, P. G. Pagliuso, C. Petrovic, Z. Fisk, J. L. Sarrao, and J. D. Thompson, Phys. Rev. B 67, 020506(R) (2003).
- (13) S. Ohara, Y. Shomi, and I. Sakamoto, Physica B 329, 612 (2003).
- (14) T. Ueda, H. Shishido, S. Hashimoto, T. Okubo, M. Yamada, Y. Inada, R. Settai, H. Harima, A. Galatanu, E. Yamamoto, N. Nakamura, K. Sugiyama, T. Takeuchi, K. Kindo, T. Namiki, Y. Aoki, H. Sato, and Y. Ōnuki, J. Phys. Soc. Jpn. 73, 649 (2004).
- (15) E. Lengyel, J. L. Sarrao, G. Sparn, F. Steglich, and J. D. Thompson, J, Mag. Mag. Mat. 272, 52 (2004).
- (16) H. Fukazawa, T. Okazaki, K. Hirayama, Y. Kohori, G. Chen, S. Ohara, I. Sakamoto, and T. Matsumoto, J. Phys. Soc. Jpn. 76, 124703 (2007).
- (17) A. S. Kirichenko, A. V. Kornilov, and V. M. Pudalov, Instr. Exp. Tech., 48, 813 (2005).
- (18) S. Raj, Y. Iida, S. Souma, T. Sato, T. Takahashi, H. Ding, S. Ohara, T. Hayakawa, G. F. Chen, I. Sakamoto, and H. Harima, Phys. Rev. B 71, 224516 (2005).
- (19) C. Lacroix, A. Solontsov, and R. Ballou, Phys. Rev. B 54, 15178 (1996).
- (20) M. Koeda, T. Fujiwara, M. Hedo, Y. Uwatoko, H. Sagayama, Y. Wakabayashi, and H. Sawa, J. Magn. Magn. Mat. 310, e31-e32 (2007).
- (21) K. Nakayama and T. Moriya, J. Phys. Soc. Jpn. 56, 2918 (1987).
- (22) H. Hasegawa and T. Moriya, J. Phys. Soc. Jpn. 36, 1542 (1974).
- (23) T. Moriya and K. Ueda, Solid State Commun. 15, 169 (1974).
- (24) N. J. Curro, B. Simovic, P. C. Hammel, P. G. Pagliuso, J. L. Sarrao, J. D. Thompson, and G. B. Martins, Phys. Rev. B 64, 180514(R) (2001).
- (25) B. A. Scott, E. Y. Suard, C. C. Tsuei, D. B. Mitzi, T. R. McGuire, B.-H. Chen, D. Walker, Physica C 230, 239 (1994).
- (26) K. Ishida, Y. Kitaoka, N. Ogata, T. Kamino, K. Asayama, J. R. Cooper, and N. Athanassopoulou, J. Phys. Soc. Jpn. 62, 2803 (1993).
- (27) Y. Kawasaki, K. Ishida, K. Obinata, K. Tabuchi, K. Kashima, Y. Kitaoka, O. Trovarelli, C. Geibel, and F. Steglich, Phys. Rev. B 66, 224502 (2002).
- (28) M. Yashima, H. Mukuda, Y. Kitaoka, H. Shishido, R. Settai, and Y. Ōnuki, Phys. Rev. B 79, 214528 (2009).
- (29) R. R. Urbano, B.-L. Young, N. J. Curro, J. D. Thompson, L. D. Pham, and Z. Fisk, Phys. Rev. Lett. 99, 146402 (2007).
- (30) A. Harada, H. Mukuda, Y. Kitaoka, A. Thamizhavel, Y. Okuda, R. Settai, Y. Ōnuki, K. M. Itoh, E. E. Haller, and H. Harima, J. Phys. Soc. Jpn. 77, 103710 (2008).
- (31) V. A. Sidorov , M. Nicklas, P. G. Pagliuso, J. L. Sarrao, Y. Bang, A. V. Balatsky, and J. D. Thompson, Phys. Rev. Lett. 89, 157004 (2002).
- (32) Y. Kawasaki, S. Kawasaki, M. Yashima, T. Mito, G.-q. Zheng, Y. Kitaoka, H. Shishido, R. Settai, Y. Haga, and Y. Ōnuki, J. Phys. Soc. Jpn. 72, 2308 (2003).
- (33) M. Yashima, S. Kawasaki, Y. Kawasaki, G.-q. Zheng, Y. Kitaoka, H. Shishido, R. Settai, Y. Haga and Y. Ōnuki, J. Phys. Soc. Jpn. 73, 2073 (2004).