xxx–xxx
Solar cycles : the past evolution influence
Abstract
The so-called solar cycle is generally characterized by the quasi-periodic oscillatory evolution of the photospheric spots number. This quasi-periodic pattern has always been an intriguing question. Several physical models were proposed to explain this evolution and many mathematical data analysis were employed to determine the principal frequencies noticeable in the measured data. Both approaches try to predict the future evolution of the solar activity and to understand the physical phenomena producing these cycles. Here we present the analysis of the sunspots number evolution using the time-delay approach. Our results show than the solar cycle can also be characterized by this behavior implying the influence of the past evolution over the present one, suggesting an histeresis mechanism, linked probably with magnetic activity.
keywords:
Sun: sunspots, Sun: activity, Sun: evolution1 Introduction
Solar activity can be seen through the evolution of sunspots number in quasi-periodic oscillatory series with periods going from 8 to 15 years and with a mean period of 11 years. Due to the change of magnetic field polarity in solar hemispheres alternatively each cycle, the period is rather 22 years. The quasi-periodic evolution of many activity phenomena is still a unsolved key problem in solar physics (along with, e.g., heating of the solar chromosphere and corona, and solar flares). An important issue of this understanding is due to the influence of solar activity over the terrestrial climate ([Archibald (2006), Archibald 2006]).
Many physical models were proposed to understand the basic mechanisms (e.g., [Benevolenskaya (1998), Benevolenskaya 1998]) producing solar/stellar activity and its quasi-cyclic evolution. From sunspots time series, mathematical approaches have highlighted several other hidden periods other that the well-apparent 11-years period. These works contributed to provide some observed parameters to constraint theoretical models, and to predict the future evolution of the sunspots number (e.g., [Clilverd et al. (2003), Clilverd et al. 2003]; [Sello (2003), Sello 2003]).
In this work we follow another mathematical approach, investigating the influence of the past evolution of the sunspots number over the present one. A natural and simple way to carry out this analysis is to assume that the susnpots number have a temporal delay behaviour. Thus, the relationship between present and past values becomes non-linear and could prove that the past amplitude influence the present one. As for the abovementioned methods, this one also allows some predictions about future solar cycles by using intermediate parameters to characterize the general past evolution.
2 The solar cycle as a temporal delay phenomena
We consider a temporal delay behavior (Eq. 1) to rely the present evolution of a phenomena with some particular events in its past evolution. The variation of in time is not only related with its current value but also with its past values , where is our temporal delay. The simplest way is to assume only one past temporal influence and some proportionality between the variables (e.g., [Murray (1993), Murray 1993]), as follows:
| (1) |
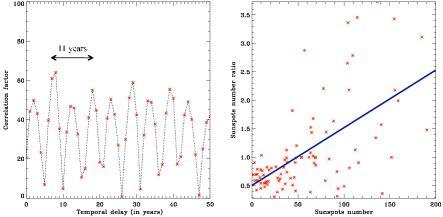
Because we use yearly values of the relative sunspots number, given by SDIC (http:// www.sidc.be/sunspot-data/), is equal to . The present and past values of are already known and we assumed some values for the parameter (; Fig. 1, left panel). So we can determine constants and (Eq. 2) from the correlation between the sunspots number ratio and the past sunspots number (Fig. 1 right panel).
| (2) |
3 Results and conclusions
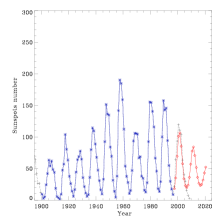
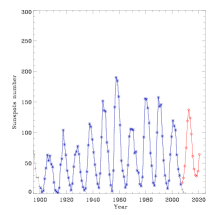
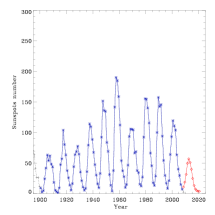
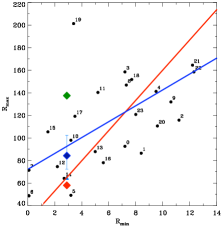
The values which minimize the correlation between the sunspots number ratio and the past spots number, are 7 or 8 years (Fig. 1). To test the accuracy of our method, we applied it on the solar cycle 23 (Table 1 and Fig. 2, left panel). Our predictions are consistent with the observations, except for the unusually long period of low activity at the end of this cycle. We also characterized the next solar cycle (Table 2 and Fig. 2) using our modelling of the solar cycle as well as the spots number observed until and . The next maximum sunspots number would take place between and and should be close to 60 (Fig. 2, right panel) as for the solar cycle . Using the solar minimum occurred in ( from SDIC), the predicted maximum is consistent with the value from the linear least-square fit on the both axis (red line on Fig. 3) and is a few smaller than the range given by [Brajša et al. (2009), Brajsa et al. (2009)]. Moreover the next solar minimum should not occur before 2019 or even 2020.
| Observed parameters | Epoch of solar | Maximum sunspot | Epoch of the end | ||||
|---|---|---|---|---|---|---|---|
| of solar minimum | maximum | number | of cycle | ||||
| Epoch | Number | Observed | Predicted | Observed | Predicted | Observed | Predicted |
| Panel of | Input parameters of | Predicted parameters | Predicted parameters of | |||
|---|---|---|---|---|---|---|
| Fig. 2 | solar minimum | of solar maximum | next solar minimum | |||
| Epoch | Number | Epoch | Number | Epoch | Number | |
| Left | ||||||
| Middle | ||||||
| Right | ||||||
These preliminary results are encouraging because we find a similar delay as that observed between the geomagnetic activity and solar cycle peaks [Hathaway & Wilson (2006), (Hathaway & Wilson 2006)] linked probably with magnetic activity by some kind of histeresis mechanism. At present, we can successfully reproduce some previous solar cycles (e.g., epoch and solar maximum). We plan to improve our predictive method including the influence of delays for which there is a good correlation. This more detailed description could allow to solve the overestimation of the next solar minimum and to reproduce the asymmetries observed during the previous cycles. Our final aim is to obtain a reliable prediction of the whole solar activity by identifying the fundamental lower and high activity precursors of its present and future evolution. All these improvements are still needed to be able to predict future low solar activity periods (e.g., Maunder/Dalton Minimum).
References
- [1]
- [Archibald (2006)] Archibald, D. 2006, Energy & Environment, 17, 29
- [Benevolenskaya (1998)] Benevolenskaya, E. E. 1998, ApJ, 509, L49
- [Brajša et al. (2009)] Brajša, R., Wöhl, H., Hanslmeier, A., et al. 2009, A&A, 496, 855
- [Clilverd et al. (2003)] Clilverd, M. A, Clarke, E., Rishbeth, H., et al. 2003, Astronomy and Geophysics, 44, 5.20
- [Hathaway & Wilson (2006)] Hathaway, D. H. & Wilson, R. M. 2006, Geophys. Res. Lett., 33, L18101
- [Murray (1993)] Murray, J. D. 1993, Mathematical Biology, 2nd corr. ed. (Springer)
- [Sello (2003)] Sello, S. 2003, A&A, 410, 691