Stellar mass-to-light ratios from galaxy spectra: how accurate can they be?
Abstract
Stellar masses play a crucial role in the exploration of galaxy properties and the evolution of the galaxy population. In this paper, we explore the minimum possible uncertainties in stellar mass-to-light (M∗/L) ratios from the assumed star formation history (SFH) and metallicity distribution, with the goals of providing a minimum set of requirements for observational studies. We use a large Monte Carlo library of SFHs to study as a function of galaxy spectral type and signal-to-noise ratio (S/N) the statistical uncertainties of M∗/L values using either absorption-line data or broad band colors. The accuracy of M∗/L estimates can be significantly improved by using metal-sensitive indices in combination with age-sensitive indices, in particular for galaxies with intermediate-age or young stellar populations. While M∗/L accuracy clearly depends on the spectral S/N ratio, there is no significant gain in improving the S/N much above 50/pix and limiting uncertainties of dex are reached. Assuming that dust is accurately corrected or absent and that the redshift is known, color-based M∗/L estimates are only slightly more uncertain than spectroscopic estimates (at comparable spectroscopic and photometric quality), but are more easily affected by systematic biases. This is the case in particular for galaxies with bursty SFHs (high H at fixed D4000n), the M∗/L of which cannot be constrained any better than dex with any indicators explored here. Finally, we explore the effects of the assumed prior distribution in SFHs and metallicity, finding them to be higher for color-based estimates.
1 Introduction
The study of the galaxy population as a function of their stellar masses has become increasingly common and important in the last years. For a long time, galaxy scaling relations were studied in terms of galaxy luminosities, often in the optical regime where differences in star formation histories between different galaxies would lead to factors of 3-10 difference in luminosity for a given stellar mass. Comparison of galaxies with different star formation histories and similar luminosities is therefore not a well-posed exercise, because it translates into comparing galaxies of dramatically different stellar mass.
This situation has significantly improved in the last decade thanks to the development and continuous refinement of methods to estimate the stellar mass-to-light ratio () from galaxies spectro-photometric properties. All the various techniques involve comparison with predictions from population synthesis models. The observational constraints used to derive galaxy estimates range from relatively ‘cheap’ observations of colors (e.g. Brinchmann & Ellis, 2000; Papovich et al., 2001; Bell & de Jong, 2001; Cole et al., 2001; Bell et al., 2003), to broad-band spectral energy distributions (SEDs) extending from the optical or UV up to the IR (e.g. Borch et al., 2006; Walcher et al., 2008; Franzetti et al., 2008), to spectroscopic measurements of individual stellar absorption features (e.g. Kauffmann et al., 2003a; Gallazzi et al., 2005) or the full optical galaxy spectrum (e.g. Panter et al., 2004; Tojeiro et al., 2007; Cid Fernandes et al., 2007).
The technical development has proceeded in parallel with (and has been largely motivated and made possible by) the rise of large homogenous spectroscopic and photometric datasets from surveys such as the Sloan Digital Sky Survey (York et al., 2000), the Two Micron All-Sky Survey (Skrutskie et al., 2006), COMBO-17 survey (Wolf et al., 2004), VIMOS VLT Deep Survey (Le Fèvre et al., 2005), and COSMOS (Scoville et al., 2007). The application of stellar mass estimation techniques to these datasets has allowed the community to make rapid progress towards understanding the properties and evolution of the galaxy population (e.g., Kauffmann et al., 2003b; Shen et al., 2003; Baldry et al., 2006; Bell et al., 2003; Fontana et al., 2006).
While it is generally acknowledged that ranking galaxies by their estimated stellar masses rather than observed luminosities provides a more physical insight, it is also recognized that in translating observational quantities into physical parameters estimates, we are limited by a number of statistical and systematic uncertainties. To start with, the accuracy of physical parameters estimates clearly relies on the accuracy of the population synthesis models used to interpret observations (i.e. galaxy colors or spectra). In particular differences in the stellar libraries (either empirical or theoretical) and uncertain (not-well observationally constrained and/or not-well theoretically understood) aspects of particular stellar evolutionary phases can affect the predicted SED for a given star formation history (SFH). Among these, it is recognized that thermally-pulsating asymptotic giant branch stars (TP-AGB) can have a significant impact on values estimated from near-infrared (NIR) colors of young stellar populations (Gyr). For instance, of high-redshift galaxies based on Maraston (2005) models can be lower by 40-60% than those based on Bruzual & Charlot (2003) code because of the different flux contribution by stars in this particular phase (e.g., Maraston et al., 2006; Bruzual, 2007; Cimatti et al., 2008). Blue stragglers and blue horizontal branch morphologies can instead affect (in an age-dependent fashion) the SEDs, and derived properties, of passive galaxies. Moreover, the treatment of non-solar abundance ratios in population synthesis models can affect the stellar ages (and hence ) of early-type galaxies derived from spectral features (e.g., Thomas et al., 2004). These and other stellar populations uncertainties have been extensively explored in Conroy et al. (2008, 2009).
Dust attenuation is a key uncertainty in stellar M/L values, especially those derived using color information (e.g., Pozzetti et al. 2007, Fontana et al. 2004, Zibetti et al. 2009 - although dust can affect absorption features like the 4000Å-break, MacArthur 2005). It has been argued that dust should to first order cancel out in the total M∗ estimated (Bell & de Jong, 2001). Yet, there are a number of caveats and possible exceptions to this simplistic picture. In particular, for systems with high optical depth (either globally or in patches), there can be considerable absorption of light without large amounts of reddening (de Jong, 1996; Driver et al., 2007; Zibetti et al., 2009). If the attenuation is patchy, moving towards resolved mass maps, and then integrating the result to a total mass, reduces this systematic uncertainty (Abraham et al., 1999; Zibetti et al., 2009)111This is an advantage of color-based stellar M/L estimates over spectroscopic values: the spectra to be analyzed typically are only of a part of a galaxy, whereas imaging exists across the face of the galaxy and one can account for optically-thick parts separately, if one wishes.. Modeling of the effects of dust can help (de Jong, 1996; Driver et al., 2007), where total thermal infrared flux can be of some use in constraining the model (e.g., Popescu & Tuffs, 2005; da Cunha et al., 2008).
The predicted photometric properties and of galaxies also strongly depend on the assumed initial mass function (IMF). While it is sometimes possible to convert values determined assuming a given IMF into another one with a simple scaling factor when the differences are only at masses , IMFs that are different at masses can alter the galaxy SED in an age-dependent way and hence have a different global effect on the colors of star-forming and passive galaxies (Conroy et al., 2009). Generally, studies of the average slope of the high-mass ( M⊙) part of the stellar IMF determine slopes consistent with Salpeter (e.g. Kennicutt, 1983; Baldry & Glazebrook, 2003; Hoversten & Glazebrook, 2008). There are a number of studies that rely on chemical abundances that sometimes favor slightly top-heavier IMFs (e.g. Worthey et al., 1992; Gibson & Matteucci, 1997; Thomas et al., 1999; Trager et al., 2000; Arrigoni et al., 2009); yet, note that chemical modeling of galaxy evolution is uncertain (owing to uncertainties in e.g., yields, gas infall and outflow) and such results should be viewed as being interesting but necessarily tentative in nature.
Moreover it is generally assumed that the shape of the IMF is universal and constant in time. Dynamical and strong lensing estimates of total M/L on galactic scales (i.e., half-light radius scales) have historically proven compatible with a universally-applicable Chabrier (2003) or Kroupa (2001) stellar IMF (e.g., Bell & de Jong, 2001; Cappellari et al., 2006; Gallazzi et al., 2006; Ferreras et al., 2008, R. S. de Jong & E. F. Bell, in preparation); such an IMF is motivated by local observations of the luminosity/mass function of star clusters, and is consistent with the statistics of H equivalent width as a function of galaxy color for luminous galaxies (Hoversten & Glazebrook, 2008). There have been a few recent arguments that, if borne out by further analysis and observations, may suggest a time-dependent stellar IMF (Wilkins et al., 2008; Davé, 2008; van Dokkum, 2008). Furthermore, statistics of H equivalent width as a function of galaxy color/UV flux show a tendency towards fewer very massive stars in dwarf galaxies (Hoversten & Glazebrook, 2008; Meurer et al., 2009) that may indicate a change in the galaxy-averaged stellar IMF (as opposed to the IMF of individual clusters) in low-luminosity galaxies (see also, e.g., Weidner & Kroupa, 2005). It has to be noted however that Elmegreen (2006) found no evidence of the composite IMF being steeper that individual cluster IMF, supporting the equality of the IMF from small to large scales.
Finally, we note that the derived estimates depend on the assumed distribution in SFHs of the models used to interpret galaxy SEDs. In particular it has been shown that the addition of bursts of star formation on top of a continuous SFH can produce estimates systematically different by an amount that can vary between 10% and a factor of two depending on the strength and fraction of starbursts (e.g., Bell & de Jong, 2001; Drory et al., 2004; Pozzetti et al., 2007; Gallazzi et al., 2008; Wuyts et al., 2009). In the last few years several works have put significant efforts in quantifying the overall statistical and systematic uncertainties on estimates and quantities based on them, such as stellar mass functions and cosmic stellar mass densities (to mention a few Cimatti et al., 2008; Gallazzi et al., 2008; Marchesini et al., 2008; Longhetti & Saracco, 2009). The general impression from all such works is that it is difficult to defend estimates to much better than 0.1 dex under the most ideal conditions, and perhaps even worse if more extreme conditions are allowed as discussed above (e.g. if there are systematic and/or random stellar IMF variations from galaxy to galaxy, if there are frequent prominent bursts).
In this paper, we take a somewhat orthogonal approach to the question of accuracies. In particular we neglect here uncertainties related to the physics of population synthesis models and assume that we have a ‘perfect’ model and that the IMF is indeed universally-applicable. We further assume that dust can be ignored, either because dealing with dust-free systems or because it can be ‘perfectly’ corrected for. The motivation for making such ideal assumptions is to isolate the contribution of SFH and metallicity scatter to the error budget. By doing so we wish to explore in depth the following issues: i) how does accuracy depend on the choice of stellar population diagnostics used to estimate its value; ii) how does accuracy respond to increasing spectroscopic or photometric quality; iii) how do the answers to these questions depend on the galaxy SFH (or spectral type).
While at first sight our approach may seem somewhat notional, given the aforementioned uncertainties in stellar population models and concerns about the possibility of stellar IMF variations, yet in isolating the influence of SFH and metallicity variations on values one can gain insight into a number of issues.
-
•
How much effort should be placed in creating realistic and physically-motivated grids of SFH and metallicity for use in stellar mass estimation? If variations in SFH and metallicity produce little scatter in values, then little effort needs to be expended in producing realistic templates. If SFH/metallicity variations lead to large scatter in stellar M/L, even for excellent data, then the creation of realistic priors for the SFH and metallicity distributions acquires some urgency.
-
•
When should we stop trying to improve the models? For example, if a particular source of uncertainty in a stellar population model gives an improvement that is much smaller than the minimum possible uncertainty from plausible variations in from SFH/metallicities, then one could argue that that particular improvement in stellar population model is less urgent than other sources of uncertainty.
-
•
How good does my data need to be? An investigation of the scatter in from SFH/metallicity variations at a given set of colors or line indices, for a given data quality, gives a lower limit to the uncertainties achievable with such data. Given a target uncertainty and method, one then learns what the target data quality should be (for effects related to SFH/metallicities only). This is less of a driver of this work, as higher quality or complementary data may be necessary to address other sources of uncertainty (such as stellar population synthesis model uncertainties or IMF variations); nonetheless, this work helps to build intuition as to what kind of data quality might be required to produce accurate estimates, assuming that the other sources of uncertainty are dealt with adequately.
In order to address these issues we study in some detail a large Monte Carlo library of SFHs described in Section 2.1 that cover the spectroscopic and photometric properties of present-day galaxies. We randomly select a subset of models that represent different galaxy spectral types having different SFHs, and we create mock galaxy samples by perturbing their spectra according to a given signal-to-noise ratio (S/N). We follow a Bayesian approach to derive the likelihood distribution of M∗/L for these mock galaxies adopting as observational constraints several sets of absorption indices as outlined in Section 2.2. In Section 3 we discuss the dependence of spectroscopically-derived estimates on the absorption indices used, on the spectroscopic S/N, on the SFH scatter, both in general and as a function of galaxy spectral type. We then compare these results to those concerning estimates based on optical or optical-NIR colors in Section 4. In Section 5 we explore the effects on estimates of any mismatch between the assumed SFH and metallicity prior and the true distribution. We finally present our conclusions in Section 6. Throughout this work we adopt a Chabrier (2003) IMF with mass cut-offs of 0.1 M⊙ and 100 M⊙ and we refer to the -band stellar mass-to-light ratio.
2 The method
2.1 The library of star formation histories
The library of star formation histories (SFHs) that we exploit in this work is the one used in Gallazzi et al. (2005) to derive stellar population parameters of SDSS galaxies. The library consists of 150000 Monte Carlo SFHs modeled by an exponentially declining SFR (with varying timescale and time of onset of star formation) to which random bursts of star formation can be superposed (with varying time of onset, duration and fraction of mass produced during the burst). The probability of having a burst is set such that 10% of the models in the library experience a burst in the last 2 Gyr. The metallicity varies between and but is kept fixed along each SFH (i.e. no chemical evolution is implemented). The galaxies in the library are also characterised by different stellar velocity dispersions for comparison with observed absorption features whose strength depends on the velocity dispersion broadening. A uniform prior distribution is assumed for all the parameters defining the model galaxies. A discussion on the potential effects of the prior assumptions (in particular the fraction of bursts) can be found in Gallazzi et al. (2005, 2008) and will be further addressed in Section 5 concerning M∗/L estimates.
For each SFH we measure the resulting spectral absorption features, broad-band colors, luminosity-weighted ages and stellar mass-to-light ratios (accounting for the returned mass fraction) by convolving Bruzual & Charlot (2003, hereafter BC03) simple stellar populations (SSP) with each SFH. The models cover the wavelength range from 91Å to 160m, with 3Å resolution over the range 3200–9500Å.
This library purely describes the stellar continuum spectrum for each SFH, while no account is taken of dust absorption. Stellar absorption features, used to estimate stellar mass-to-light ratios as well as luminosity-weighted ages and metallicities, are weakly affected by dust (but see MacArthur, 2005, for a detailed analysis on the dependence of absorption index strengths on dust). We also do not include any treatment of emission lines from ionized gas in our model library. In observed spectra of star-forming galaxies emission from ionised gas can affect in particular the measurement of the Balmer absorption features. It is crucial that emission lines are carefully corrected for in order to measure the true stellar absorption and hence derive an unbiased measure of the stellar age. Medium/high spectral resolution and good signal-to-noise ratio (S/N) are particularly crucial in this respect.
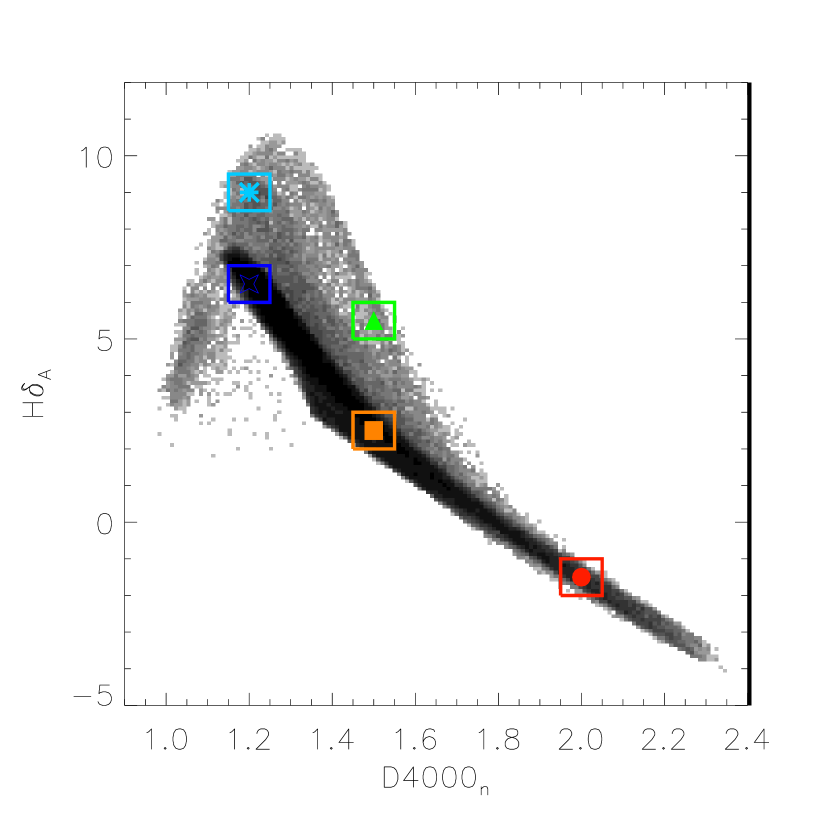
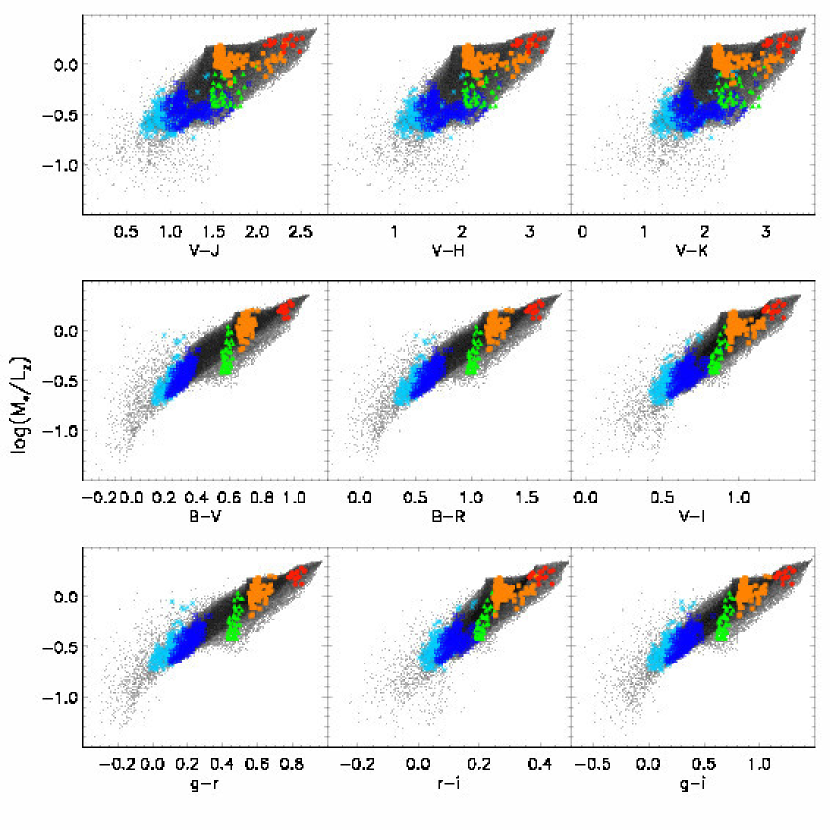
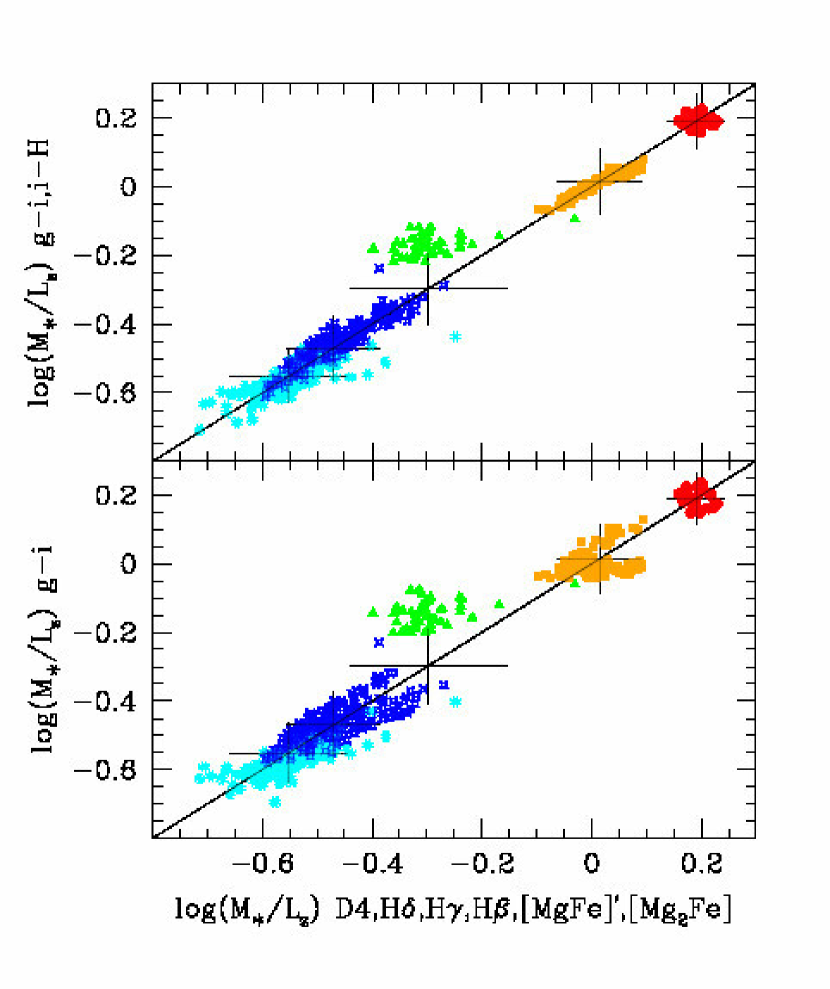
The distribution of the models in the -H plane is shown in Fig. 1 (left panel). This plane is an observational diagnostic of recent star formation history (as already discussed in, e.g., Kauffmann et al., 2003a). Models without bursts or which had a burst more than Gyr ago (‘continuous’ models, i.e. dominated by an exponentially declining SFH) form a continuous sequence of decreasing H at increasing , reflecting an increase in the luminosity-weighted age. The region of relatively high H values at intermediate is occupied by models with more than one burst during their SFH (‘bursty’ models) and, in particular, which experienced a burst in the last 2 Gyrs. Higher burst strengths produce higher H values at fixed , resulting in a trend of decreasing luminosity-weighted age at increasing H at fixed in the range . Finally, models that reach very low and low H values had a very recent ( Myr) and intense (% in mass with respect to the underlying continuous SFH) burst of star formation. As shown in Gallazzi et al. (2005), the stellar mass, luminosity-weighted age and stellar metallicity of observed galaxies all increase with increasing . At intermediate values, where the relation with stellar mass is weaker, there is a broader range in ages, which decrease at increasing H, and in metallicities, which increase with increasing H.
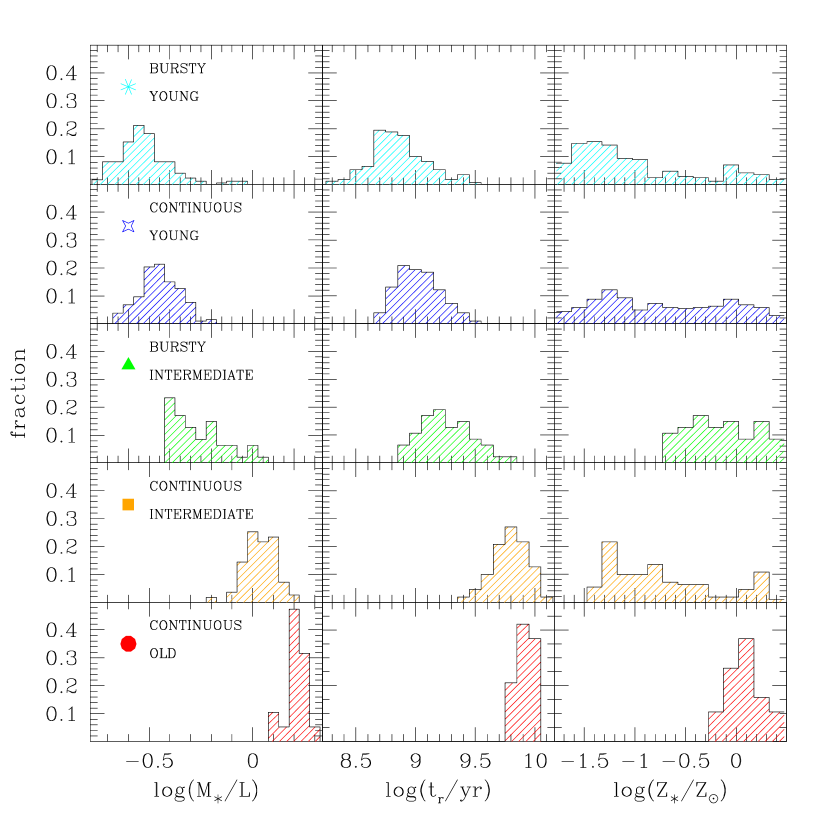
In this work we wish to explore our ability of constraining also in dependence of the galaxy SFH (or the galaxy spectral type). For this purpose the models that we choose to analyse as real observed galaxies are randomly drawn from five different locations on the -H plane (as indicated by the boxes in the left panel Fig. 1): continuous models dominated by either old, intermediate-age or young stellar populations (red, orange and blue, respectively), and bursty models with either intermediate or young ages (green and cyan, respectively). The -band mass-to-light ratios (), luminosity-weighted ages () and stellar metallicities () of the different classes of models are shown in the right panel of Fig. 1. There is a clear sequence of decreasing both and with decreasing and increasing H (i.e. from ‘continuous old’ to ‘bursty young’ types). Besides a continuous shift in the average mass-to-light ratio and stellar age, the distributions in these parameters tend to become slightly broader going from the homogeneous ‘continuous old’ populations to more complex SFHs (and more composite stellar populations). This is even more the case when stellar metallicity is considered. While the metallicity of galaxies with strong is typically solar and always greater than 40% solar (because the 4000Å-break is somewhat metallicity-sensitive, and high values of can only be reached in systems with high metallicity), the other galaxy types have a much broader metallicity distribution, even covering the whole range of the models for the youngest populations. At intermediate ages (corresponding to intermediate values) recent bursts of star formation produce higher metallicities than continuous models (compare green and orange histograms), reflecting the anticorrelation between metallicity and H (and age) in this range as mentioned above.
2.2 Stellar mass-to-light ratio estimates from spectral features
As mentioned before, we create mock galaxies from a total of 553 models randomly chosen in order to represent different spectral types and SFHs. Mock galaxies are created by assigning an error to the absorption features typical of observed spectra with a given signal-to-noise ratio (S/N) and by perturbing the true index strengths according to this error. This procedure is repeated 100 times for each S/N value. Each time we calculate the probability density function (PDF) of by comparing the ‘observed’ absorption indices with those predicted by all the other models in the library with the same velocity dispersion (within ). We then take the average of these 100 Monte Carlo realizations of the PDF as the final likelihood distribution for a given galaxy at a given S/N.
We consider nine values of S/N (namely 2, 5, 10, 20, 30, 40, 50, 100 and 200). The typical error of each absorption feature at a given S/N is taken to be the average error of SDSS DR4 galaxies in the redshift range that have a spectrum with the corresponding S/N per pixel. No SDSS spectra with S/N of 100 and 200 are available. We then fit a linear relationship between the error and the S/N (in space) and extrapolate to S/N values of 100 and 200. We note that the average errors on the absorption features (and their extrapolation to the highest S/N values) are almost independent of the galaxy velocity dispersion, especially at S/N. The index errors estimated in this way are consistent with those measured directly from template spectra perturbed with Gaussian noise (a reasonable assumption at ).
The PDF provides information on how plausible it is that the parameter of interest lies within a certain range of values, given the constraints from the data (the absorption indices) on the assumed prior distribution of models. The PDF can be characterized by its median, which we take as our estimate of , and by a confidence interval within which is constrained at a certain probability level.
Throughout the paper we quantify the uncertainty of M∗/L estimates in two ways: i) the offset between the retrieved M∗/L value (i.e. the median of the PDF) and the true one, which quantifies the typical bias introduced by the method, together with its rms scatter; ii) the confidence interval given by half of the 16%-84% percentile range of the likelihood distribution for each mock galaxy (which is equivalent to 1 range for a gaussian distribution). While the rms of the offsets tells how much the median estimate scatters as a consequence of observational errors (so it is in a sense an estimate of the repeatability of the measure), the 68% range of the PDF gives the range of acceptable values of the parameter, which depends on the sensitivity of the data to the parameter. We note that the rms is in general lower or equal to the width of the PDF. In any case, neither quantity can be smaller than the intrinsic scatter in M∗/L within a certain range of observables (as we discuss in Section 3.3).
We wish to explore the dependence of uncertainties not only on galaxy spectral type and spectral quality, but also on the observational constraints adopted to build the likelihood distribution. To this purpose, we consider several combinations of absorption features that represent situations in which different portions of the optical spectrum (hence different information on the underlying stellar populations) are exploited. The absorption features analysed here are those included in the Lick/IDS system and defined in Worthey et al. (1994), the 4000Å-break as defined in Balogh et al. (1999) and the high-order Balmer lines H and H as defined in Worthey & Ottaviani (1997). The seven sets of indices we consider are:
-
1.
and H (case 1). These are the indices used by Kauffmann et al. (2003a). As discussed above, these two indices provide a diagnostic of the recent SFH. In particular, the location in the -H plane is determined in first approximation by the average stellar age, while it is less sensitive to metallicity. They have indeed been shown to provide constraints on stellar mass-to-light ratios and stellar ages with errors within 30% for average SDSS spectra, while they are not sufficient to constrain stellar metallicity (Kauffmann et al., 2003a; Gallazzi et al., 2005). The metallicity insensitivity of these indices starts to break down for old stellar ages.
-
2.
, H, H and H (case 2). This set of indices is equivalent to the previous one, but it adds information from the other Balmer lines. Even assuming that all the Balmer lines have the same sensitivity to age (and insensitivity to metallicity) we would expect a (slight) improvement over the use of one single line. The expected improvement could be more significant if we consider that Balmer lines are not pure age indicators. Unlike H, which shows little sensitivity to both total metallicity and abundance ratios, the higher-order Balmer lines H and H are more strongly affected by metallic lines in their bandpasses. They are thus sensitive to element abundance ratios especially at high metallicities, in particular to variations in abundance of C and N, respectively (Korn et al., 2005; Prochaska et al., 2007; Schiavon, 2007). The sensitivity of Balmer lines to metal abundances is relevant here in that it adds further information helping in better constraining the .
-
3.
, H, H, H, and (case 3). This set of indices has been used in Gallazzi et al. (2005) to derive constraints on stellar metallicity, light-weighted ages and stellar masses of SDSS DR2 galaxies. The indices and are crucial to get meaningful constraints on stellar metallicity. They are insensitive to element abundance ratios (Thomas et al., 2003; Coelho et al., 2007) and are thus appropriate when comparing observed spectra of (potentially -enhanced) ellipticals to scaled-solar population synthesis models. We explore here the impact of adding metallicity constraints on the quality of constraints.
-
4.
, H, H, H, , , , , and (case 4). This set of indices is equivalent to the previous one, but the individual absorption features that define the composite and indices are used. Unlike the composite indices, the individual Mg and Fe absorption lines are sensitive to /Fe abundance ratio variations. They need to be compared to models that treat variations in individual element abundances, when analysing real galaxies. In this case they might help narrowing further uncertainties because of the additional /Fe information. This is not the case in this work where only scaled-solar spectra are considered. This alternative set is used here only to explore the effect of additional observational constraints (but not additional astrophysical information).
-
5.
, H, , and (case 5). This set combines age-sensitive indices and metal-sensitive indices, as in the previous two cases, but exploits only the bluest part of the optical spectrum. It may thus be of interest for higher-redshift studies in which the red absorption features are difficult to measure because of telluric absorption and OH skyglow. is sensitive to C and N as well as Ca abundance. is particularly sensitive to C and O and only little to Fe abundance. The only Fe-sensitive index in this group is which also shows an opposite dependence on Cr and, despite its name, no sensitivity to Ca abundance (Tripicco & Bell, 1995). Both and are almost independent of and their strengths in observed galaxy spectra are reasonably well fitted by the scaled-solar BC03 models (see fig. 18 of Bruzual & Charlot, 2003).
-
6.
H, , , , , , and (case 6). As opposed to the previous case, with this index set we wish to explore our ability of constraining by using only the red portion of the optical spectrum, in particular excluding the 4000Å-break. Only H is available as age-sensitive index. In this case, is determined primarily by narrowing the metallicity range of the stellar populations. A series of elements, including C and Fe in addition to Mg, contribute to the strength of both and . They respond to variations, but are still reasonably well reproduced by scaled-solar models, as opposed to (Bruzual & Charlot, 2003). , and are all similar indicators of Fe abundance. shows a weaker sensitivity to Fe, counter-balanced by its sensitivity to Ca. It is hence little affected by -enhancement, which explains why it is well reproduced by BC03 models. This is also the case of whose strength is mostly contributed by Cr and only marginally by Fe. (Tripicco & Bell, 1995; Thomas et al., 2003).
- 7.
3 Results
3.1 Dependence on observational constraints
In this section we explore how the uncertainties on the estimated depend on both the spectral quality, as expressed by the mean S/N per pixel, and the absorption features used to constrain the likelihood distribution.
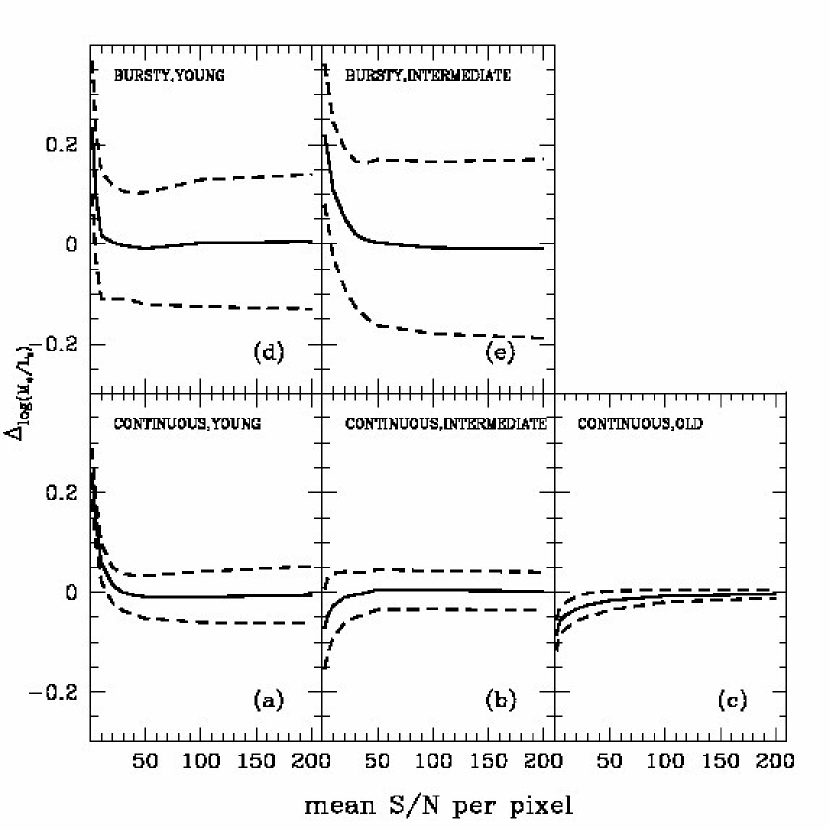
We first checked that for the sample as a whole the median offset between the estimated and the true M∗/L is zero (we will discuss it for individual spectral classes in the following sections). We now turn our attention to the median error on (defined as half of the interpercentile range of each PDF), which is shown in Fig. 2 for all the 553 galaxies analysed as a function of S/N. The mass-to-light ratio estimates are obtained with only and H (case 1). The error bars indicate the scatter in error at given S/N. From the plot it is clear that the mean S/N of the spectrum strongly influences the accuracy of spectroscopic estimates and a is required to constrain within better than 30% when only two spectral indices are used. However, at higher S/N an improvement in S/N of a factor of 2 produces only a mild improvement in the uncertainties. There seems to be a limiting accuracy of dex even at S/N of 200.

In Fig. 3 we explore whether the uncertainty on estimates can be lowered by using additional spectroscopic information. Each panel shows the error as a function of S/N for each index set discussed in Section 2.2, in comparison to case 1 (dashed line). Fig. 3a shows that uncertainties can be narrowed already by simply using all the optical Balmer lines (instead of only one) together with : the typical statistical error can go below 0.1 dex already at and reaches 0.05 dex at the ideal S/N of 200.
In Fig. 3b we compare the uncertainties on estimates derived by adding two composite indices that are sensitive to total metallicity (case 3) with those derived in the default case 1. The improvement is significant in particular at and the error can even go below the 0.05 dex level at . This is because, at given age, the stellar mass-to-light ratio still depends on stellar metallicity: constraining the range in metallicity of the stellar populations can thus help to narrow the allowed range in . There is no difference if the individual Mg and Fe lines are used instead of the composite /Fe-independent indices (Fig. 3c). If observed spectra are compared to scaled-solar models the composite indices should be used in order to avoid any bias introduced by incorrect interpretation of -enhanced stellar populations. If models that include variations in element abundance ratios are used instead, the individual indices may give additional information not only on total metallicity but also on relative abundances (and hence narrow the uncertainties).
In Fig. 3d we explore the usefulness of other metal-sensitive lines in the blue part of the optical spectrum, in addition to and H. These features are reasonably well reproduced by scaled-solar models, because of their weak dependence on (except ). They have a negligible impact on the quality of estimates and there is no improvement over the use of only and H, except at extremely (and unrealistically) high S/N ratios. Interestingly, we found similar results (better by less than a hundredth of a dex at S/N) by using instead Fe lines in the same region of the spectrum, such as , in addition to and H. This is due to the low resolving power of these indices and their broad relation with . The clear improvement seen in case 3 (Fig. 3b) is mainly driven by Mg lines which alone help reducing the uncertainties by almost 0.02 dex at S/N.
Finally, Fig. 3e,f explore the case in which only the red portion of the optical spectrum is available, in particular there is no measure of the 4000Å-break. Here we use only H as age-sensitive index and some Mg and Fe lines to constrain the metallicity range. Surprisingly these absorption features provide estimates with lower uncertainties than the case in which the reference age diagnostics ( and H) are used (but not better than the results obtained combining and H with Mg and Fe lines on a longer wavelength baselines, such as case 3 or 4). The improvement, though, becomes significant only at and is comparable to case 2 (i.e. all Balmer lines in addition to , panel a). We note that, while metallicity constraints help to reduce uncertainties, it is crucial to first determine stellar age (i.e. it is crucial to use at least an age-sensitive feature). The comparison between panels e and f shows that only three metal-sensitive indices, in addition to H, are sufficient to obtain uncertainties smaller than % at and the inclusion of other Mg and Fe lines provides only redundant information. We note that we have chosen and because of their weak dependence on -enhancement that makes them appropriate for use with scaled-solar population synthesis models. If models with variable element abundance ratios are used other Fe lines, blueward of 5500Å, could be used (i.e., the required wavelength range is narrower). Interestingly H seems to perform as well as and even better than in constraining . We checked this also by substituting in the index set of case 7 H by . Indeed the relation between and H in the library is much narrower than the one with . The latter is particularly broad at intermediate values.
Overall the uncertainty has a similar dependence on S/N regardless of the absorption features used. However, at a given S/N (above at least ) the statistical error on estimates can be significantly improved if constraints from metal-sensitive lines on a relatively long wavelength baseline are included. If only features blueward of Å are available there is no significant improvement over the use of and H only by adding other absorption features.

3.2 Dependence on SFH
In this section we wish to explore how the uncertainties on the estimated depend on the galaxy spectral type, or star formation history. In practise we wish to identify for different galaxy types the observational conditions (i.e., spectral S/N and observational constraints) under which a minimum accuracy can be reached.
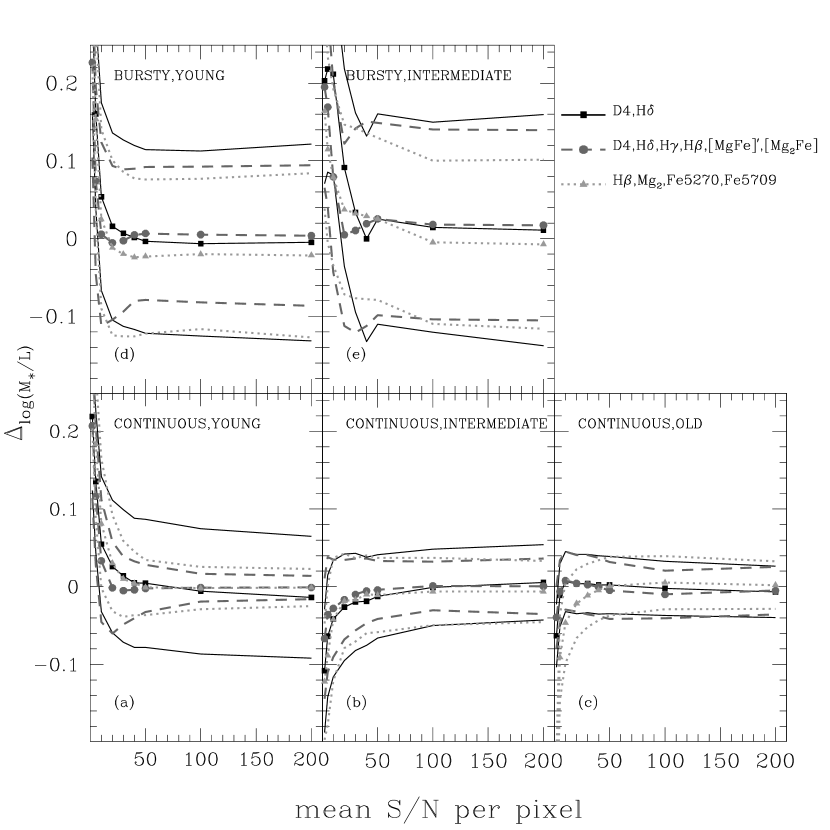
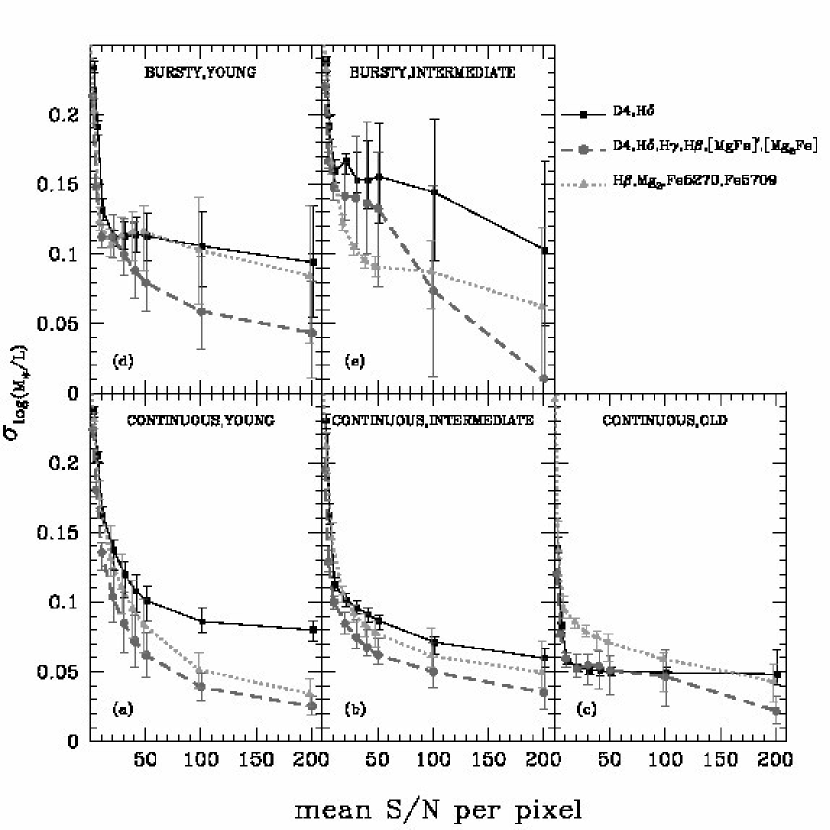
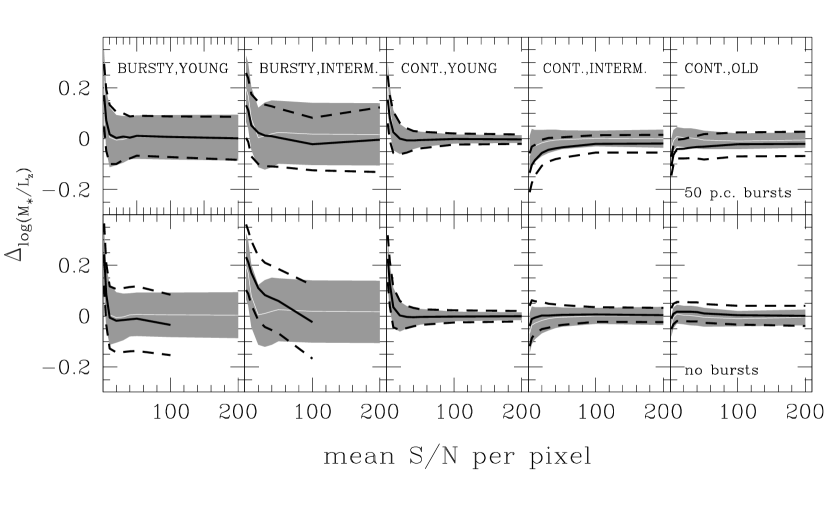
Before assessing the reliability of certain observational constraints in estimating we need to check how well the true is retrieved. Fig. 4 shows, as a function of S/N, the difference between the estimated and the true () for three combinations of absorption features and for the different spectral types defined in Section 2.1: panels a, b and c represent galaxies along the main -H sequence characterized by a continuous SFH with increasing light-weighted age (‘continuous, young’, ‘continuous, intermediate’, ‘continuous, old’); panels d and e represent instead galaxies with a bursty SFH (‘bursty, young’, ‘bursty, intermediate’). In each panel we consider only three sets of indices that we deem most representative among those discussed in Section 2.2. We consider case 1 ( and H, solid black line) and case 3 (, H, H, H, , ; dashed dark grey line) because they have already been used in the literature to derive stellar masses of large samples of galaxies and they represent two distinct situations: case 1 uses a minimum spectral information, while case 3 seems to provide on average the best accuracies on (according to Fig. 3) but requires more spectroscopic information. In addition, we consider also case 7 (dotted light grey line, using only the red portion of the spectrum; H, , and ): while avoiding the 4000Å-break region, which is most commonly used to define stellar age, it seems to bring some improvement over the default case.
In general, all the three index combinations considered perform well in retrieving the true value, at least at . At lower S/N there can be small offsets due to the fact that models ‘further away’ from the analysed galaxy have a significant weight in the PDF. The index set that performs best for all galaxy types and S/N is the one combining and Balmer lines with metal-sensitive indices. Estimates based on absorption features redward of the 4000Å-break are more easily subject to biases of the order of 0.02 dex for bursty SFHs and young stellar populations.
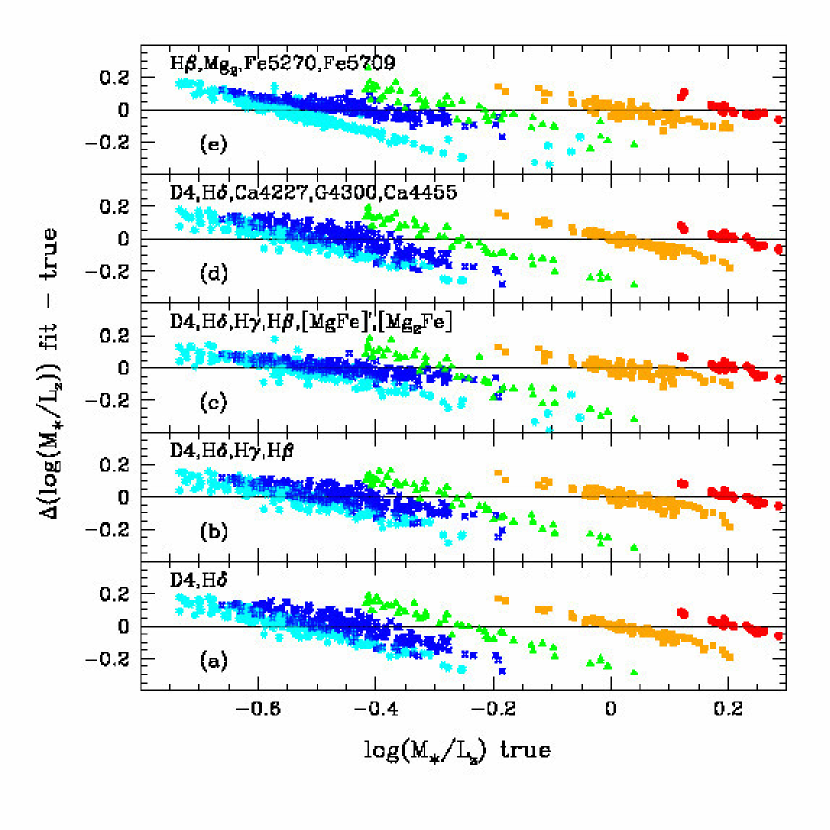
Fig. 5 provides a further visual representation of how well the index sets considered in this work can retrieve the true . We consider the estimates obtained at a S/N of 30 and we distinguish the different spectral types. As already shown in Fig. 4 there is on average no significant systematic bias in the estimated values. However in many cases the offsets are correlated with the value itself. This is the combined effect of the prior distribution of the models and the procedure of marginalizing over all models. Consider the distribution of models with absorption features within of the observed ones (which are those that mostly contribute to the PDF). If the analysed galaxy has a value at the edges of this distribution, its will be over- or under-estimated by an amount that depends on how narrow and peaked is the distribution in of the models. The overall scatter and correlation between offset and would be reduced at higher S/N.
We now analyse the statistical uncertainty on M∗/L as expressed by half of the 68% confidence range of the PDF (we note that this is in general larger than the rms scatter of the offsets shown in Fig. 4 - see discussion in Section 2.2). Fig. 6 shows the median as a function of S/N for the five spectral types as in Fig. 4. It appears that the stellar M/L is generally more easily and better constrained for galaxies dominated by old stellar populations and with smooth SFH (Fig. 6a,b,c). This means that fewer observational constraints and poorer spectral quality are sufficient to reach a given accuracy on estimates. In particular, for old stellar populations can be constrained within dex using only and H and with a S/N of 20. Higher S/N or further observational constraints do not improve the uncertainties, except at very high S/N by adding metal-sensitive indices (panel c).
Focusing on galaxies with continuous SFHs, statistical uncertainties on estimated with and H become larger, at a given S/N, with decreasing stellar population age. The uncertainties depend much less on stellar age in case 3, i.e. when the composite metal-sensitive indices are included. This is because the impact on of adding metallicity constraints is stronger for younger galaxies, which have a much larger spread in stellar metallicity (see Fig. 1). Metal lines are crucial in order to reach accuracies below 0.1 dex for galaxies with young stellar populations at reasonable S/N ratios, and even below 0.05 dex at . It is also interesting to notice that, while is crucial (and enough) to derive good constraints on the of old galaxies, for younger stellar populations excluding and using only absorption features redward of Å can even improve the uncertainty at a given S/N. As mentioned before, except at , correlates more tightly with H than with .
We now turn our attention to galaxies that have experienced a recent burst of star formation, with young ( Gyr) or intermediate-age ( Gyr) stellar populations (panel d and e of Fig. 6, respectively). It is immediately clear that more observational constraints and better spectral quality are required to reach a certain level of accuracy in estimates with respect to galaxies with continuous SFHs. For ‘bursty young’ SFHs the only way to lower the statistical uncertainties below the 0.1 dex level is to combine age and metallicity constraints (dashed line) and to acquire spectra with S/N above 40.
The situation is even more dramatic for galaxies in which the young burst is not dominant but mixed to an older stellar population (panel e). The of this type of galaxies cannot be constrained better than dex. Again, a combination of H and Mg and Fe lines performs better than including (compare dashed and dotted lines). This class of galaxies occupy the region where the relation between and is broadest.
It is interesting to notice that, while in general higher mass-to-light ratio values are better determined than lower ones, we have checked that, at a given S/N, the uncertainty on is primarily a function of galaxy spectral type and not of itself. At young ages and continuous SFHs there is a further correlation with in the sense that lower galaxies have smaller uncertainties.
3.3 Discreteness effects
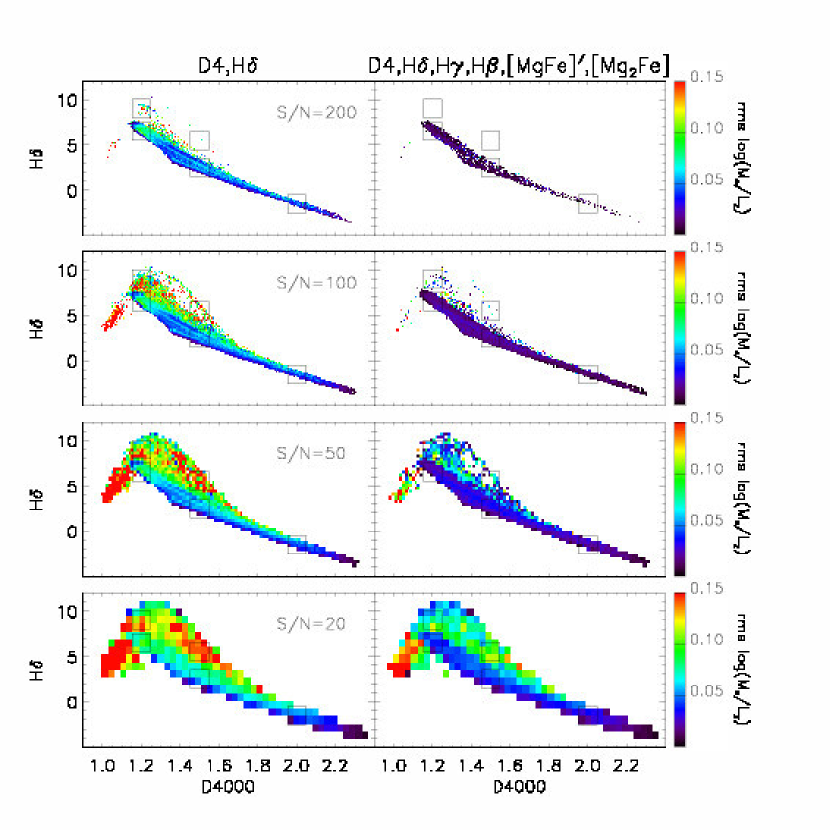
At this point, we wish to spend few words to discuss the reliability of error determinations at very high S/N. As can be seen from Fig. 6, the scatter in at given S/N is quite small for continuous SFHs, but becomes significantly large, and even larger than any trend of error with S/N, for bursty SFHs especially at intermediate ages. Galaxies of similar type and with similar spectral quality can have very different errors that may even run into the limit of zero uncertainty. Such tiny uncertainties are not robust and are an indication that the sampling of the likelihood distribution is not reliable. This is also suggested by rms scatter of the median estimates (with respect to the true value) that remains significantly large even at high S/N.
All the models in the library contribute to the PDF, but the largest weights are given to those models that lie within 1 or 2 of the observational data (in this case, the absorption indices of the analysed galaxy). It is clear then that by increasing the S/N (hence decreasing the observational errors) and increasing the number of observational constraints (the absorption features used to compare models and observations) fewer models enter the ‘observational cell’ of the analysed galaxy (i.e. have index values within of the observed ones). The PDF is no longer uniformly sampled and the marginalization procedure becomes effectively a maximum-likelihood analysis. The point at which this happens depends on the number of observational data used but also on the galaxy type, or more precisely on the location of galaxies in the index-index space. This is because of the non-uniform distribution of the models in the -H plane: while discreteness effects are not a concern for old stellar populations and, in general, continuous SFHs (at least with such a large model library as the one used here) even at very high S/N, they severely affect our ability of building reliable PDFs of galaxies with bursty SFHs at with more than two observational constraints.
Increasing the number of models (e.g. by an order of magnitude) will not improve the situation for galaxies with high H values. The statistical error on cannot be lower than its intrinsic scatter at each position in the observational space. While old stellar populations have very uniform mass-to-light ratios, galaxies with bursty SFH have broader distributions in . The scatter in remains relatively large even reducing the dimension of the ‘observational cell’ (i.e. reducing the index errors) and/or increasing the number of constraints. This is illustrated in Fig. 7, where we plot the rms scatter in along the -H plane for increasing S/N. We calculate the scatter in bins of and H of width given by the typical index errors at a given S/N (left-hand panels). The values read from this plot are in good agreement with the errors on shown in Fig. 6. It is clear that the region of highest intrinsic scatter (between 0.1 and 0.2 dex) is at intermediate and high H values (except at very low values which we do not consider in this work and are not covered by SDSS galaxies), at least up to a where there are enough models () to measure the scatter.
We also calculate the rms scatter in bins of , H, H, H, and , and plot the average scatter in bins of and H (right-hand panels). Although the scatter is generally lower than in the left-hand panels (because of more observational constraints), the variation in is still quite significant for bursty SFHs.
We thus conclude that the M∗/L of intermediate-age stellar populations cannot be determined better than dex and there is no gain in either increasing the S/N above or using more observational constraints. This is reflected in the rms of the offsets shown in Fig. 4 that remains at the level of dex (depending on index set).
4 estimates from colors
In this section we address the statistical uncertainty on derived from one or two optical or optical-NIR colors. The method adopted is the same as the one described in Section 2.2 but using as observational constraints broad-band colors rather than absorption features. It is important to remember that the model library used here does not include dust attenuation. While this has little influence on absorption indices, observed galaxy colors are strongly affected by dust. The uncertainties quoted here hence represent the expected statistical uncertainties in the case of small dust attenuation (e.g. elliptical galaxies) or of good knowledge of dust correction.
4.1 Estimates based on one color
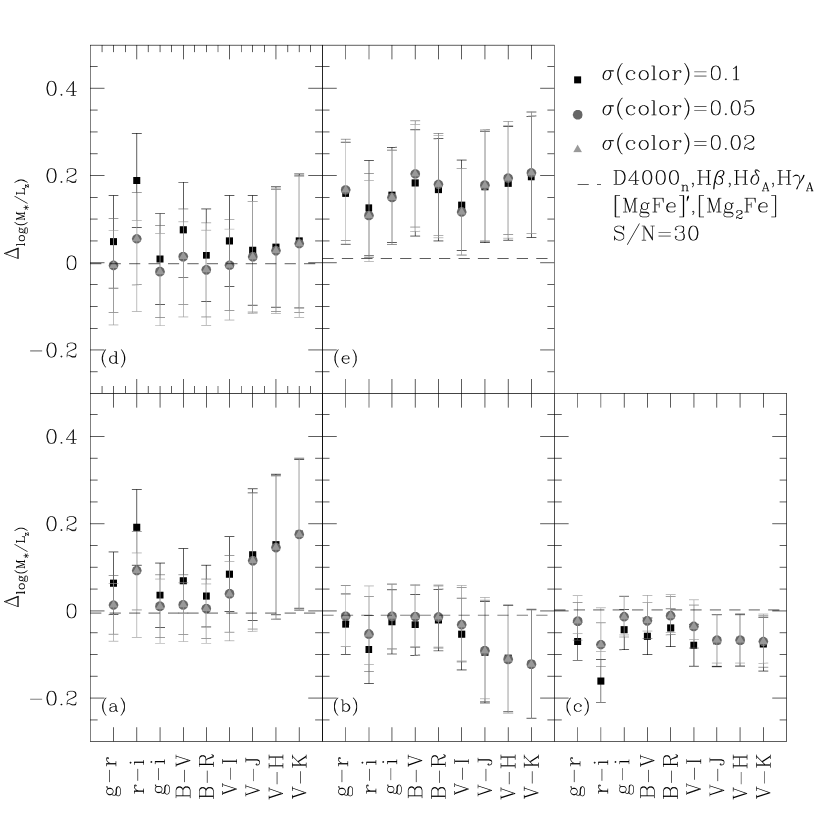
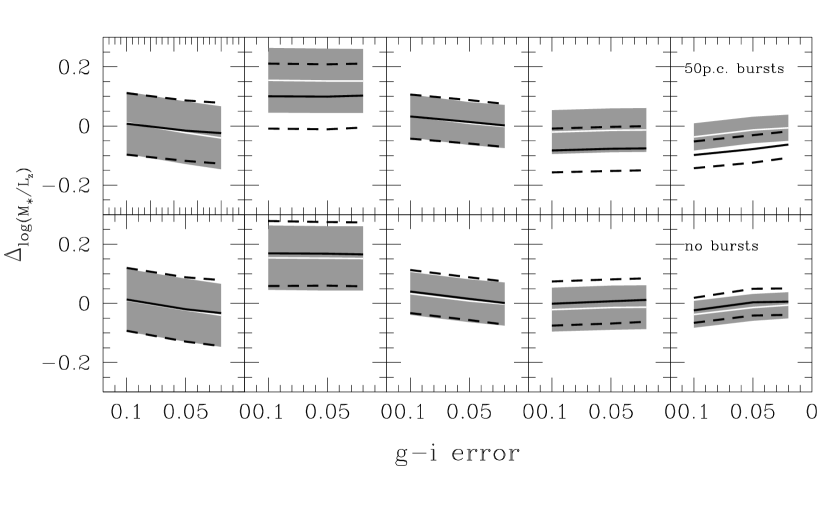
We first explore the constraints derived using a single broad-band color. We consider in particular the optical colors , , , and , and the optical-NIR colors , , , . Fig. 8 shows the average difference between the retrieved and the true value as a function of color, observational error and galaxy spectral type. We consider three different values of observational error on the color, namely 0.1 mag (squares), 0.05 mag (circles) and 0.02 mag (triangles). Each panel isolate model galaxies in the five spectral classes defined in Section 2.1. For comparison the dashed line in each panel traces the median offset for estimates based on absorption indices (case 3: , H, H, H, , ) at a representative for the corresponding spectral class.
Fig. 8 shows that it is possible to retrieve the correct mass-to-light ratio value within dex on average (except for bursty, intermediate-age galaxies) by using optical colors, if their observational error is below mag. They perform similarly to absorption indices in this respect, although for old stellar populations color-based values tend to be slightly underestimated with respect to index-based values. On the contrary, estimates from optical-NIR colors alone tend to significantly under-/over-estimate the true value of old/young stellar populations. In Section 3.2 and 3.3 we showed that spectroscopic estimates of the of galaxies characterized by bursty SFH and intermediate-age populations are affected by large statistical uncertainties and significant variation on a galaxy-by-galaxy basis. Fig. 8 shows that colors systematically overestimate the true of these galaxies by dex. This is the case for all the colors considered here.
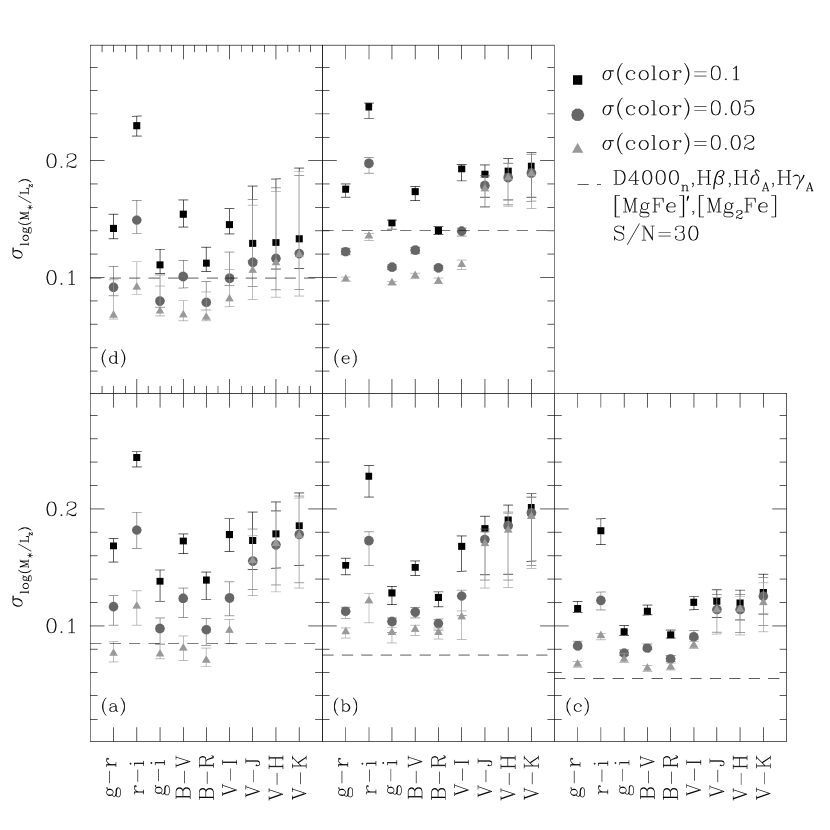
Fig. 9 shows the median uncertainty on as a function of the color adopted. It is interesting to see that using optical colors with reasonably small observational errors (mag) it is possible to constrain almost as well as using a combination of age- and metal-sensitive absorption features (uncertainties are only dex higher), with the assumption that redshift is known and neglecting dust corrections. Moreover the typical uncertainty is less dependent on the galaxy spectral class than in the case of estimates obtained with absorption indices. For bursty SFHs the statistical uncertainty of color-based estimates is slightly better and more homogeneous than those of spectroscopically-based estimates. However Fig. 8 just showed that color-based estimates are systematically over-estimated by almost 0.2 dex for this type of objects.
Fig. 9 shows that, among the optical colors considered here, the one producing the largest uncertainties is because of its shorter dynamic range and the higher relative uncertainties with respect to the other colors. We note that observationally it is advisable, if possible, to avoid using the band which can be severely contaminated by H emission in star-forming galaxies. On the contrary, the optical color which provides in general the smallest uncertainties is which has the largest wavelength leverage. Statistical errors on are below 0.1 dex for continuous models with relatively old stellar populations, and only slightly worse for bursty, intermediate-age models (dex). This is the color preferred by Zibetti et al. (2009) to derive mass-to-light ratio estimates in the band, with a maximum variation in median M∗/Li of dex at given color.
From Fig. 9 it is also clear that optical-NIR colors predict with lower accuracy than optical colors, in particular for young and intermediate-age objects (and tend to be biased as shown in Fig. 8). The relation between and optical-NIR colors is indeed very broad (see Fig. 10), and optical-NIR colors are equally sensitive to age and metallicity, as opposed to optical colors which have a stronger sensitivity to age (e.g. de Jong, 1996; Chang et al., 2006). The uncertainties are thus expected to be larger especially for galaxies with a young stellar population component, which have a broader metallicity distribution (see Fig. 1).
The trends mentioned above are clearly understood by looking at the distribution in as a function of color for the whole Monte Carlo library (grey) and the analysed models (colored symbols) shown in Fig. 10. The -optical color relation is very tight and models of different spectral class form a sequence of increasing (and age) with increasing color. This and the relatively narrow color distribution of individual spectral classes explain i) why optical colors alone can constrain with accuracy almost as good as the one reached from spectroscopic estimates, and ii) the small variation in both as a function of spectral type and within individual classes. The relation becomes significantly broader for optical-NIR colors (which have a stronger secondary dependence on metallicity) and the spectroscopic selection does not correspond anymore to a color selection. This explains the larger uncertainties and the larger spread in for estimates based on optical-NIR colors. Figure 10 also explains the large offsets seen in Fig. 8) in particular for ‘bursty/intermediate’ galaxies. When building the likelihood distribution of individual galaxies, most of the weight comes from all the models in the library with similar color as the analysed one and hence the derived will rather represent the median at a given color. The offset between the estimated and the true originates from the fact that ‘bursty, intermediate’ models populate the low-() tail of the distribution of all models at similar color (as shown in Fig. 10). The effect is stronger and extended to other spectral classes for optical-NIR colors which have a broader distribution at fixed color.
4.2 Comparison with Bell et al. 2003
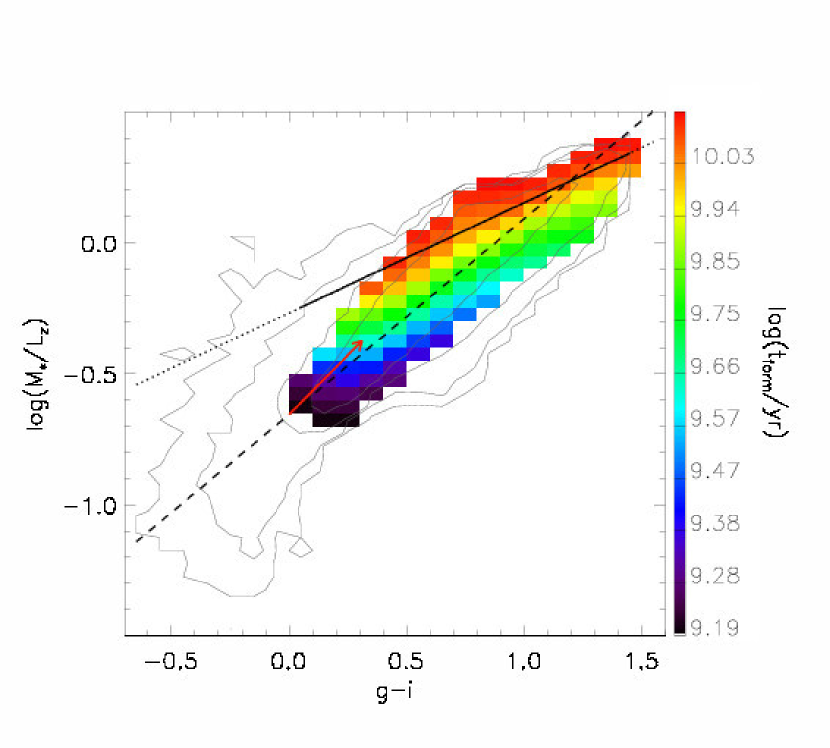
We have also compared our Bayesian estimates with those obtained adopting the Bell et al. (2003) formulae (see their Table 7) for SDSS colors, accounting for the different IMF. We note that, while there is good agreement for old stellar populations, the Bell et al. (2003) estimates tend to be higher than ours at bluer colors (). Indeed the -color relation of Bell et al. (2003) is flatter than the one we see in our model library. This is explicitly shown in Fig. 11, where we compare the Bell et al. (2003) relation between and (solid line; the dotted line extrapolates their relation to the whole color range of our library) and the distribution of our models (grey contours). The color-shaded region shows for clarity only models with exponential SFHs (without bursts) coded according to their formation time (). As discussed in more depth by de Jong & Bell (2009, in prep.), the difference in slope between our and Bell et al. (2003) relation is primarily due to the age distribution of the models: at bluer colors the SFH distribution is skewed towards substantially younger ages for the set of model templates used here compared to the SFH distributions assumed by Bell et al. (2003). The relation between and for models with Gyr is in good agreement with their relation for a 12 Gyr old stellar population. At fixed younger formation age only the zero-point moves to bluer color, while the slope does not change. This produces a steeper age-averaged relation (dashed line).
Finally, we note that dust also has a secondary effect. The red arrow in Fig. 11 gives an impression of the effect on and -band on young stellar populations assuming mag and an extinction curve . de Jong & Bell (2009, in prep.) compared stellar mass-to-light ratios calculated by Gallazzi et al. (2005) using these stellar population models (based on line indices) with those derived by Bell et al. (2003). While the intrinsic (i.e. the mass-to-light ratio of the stars alone) from both methods differ, the total (i.e. the mass-to-light ratio that one applies to the observed light to estimate the stellar mass, which includes the effects of dust extinction) of both methods match well. Dust reddens and dims the youngest stellar populations, bringing the total values of Gallazzi et al. (2005) and Bell et al. (2003) into better agreement. A similar discussion of the sensitivity of the distribution as a function of color to the distribution in age of the library (formation time, intensity and duration of bursts) and to dust has been recently presented by Zibetti et al. (2009) who use a model library similar to ours (but with a larger fraction of recent bursts), explicitly including dust attenuation.
4.3 Estimates based on two colors
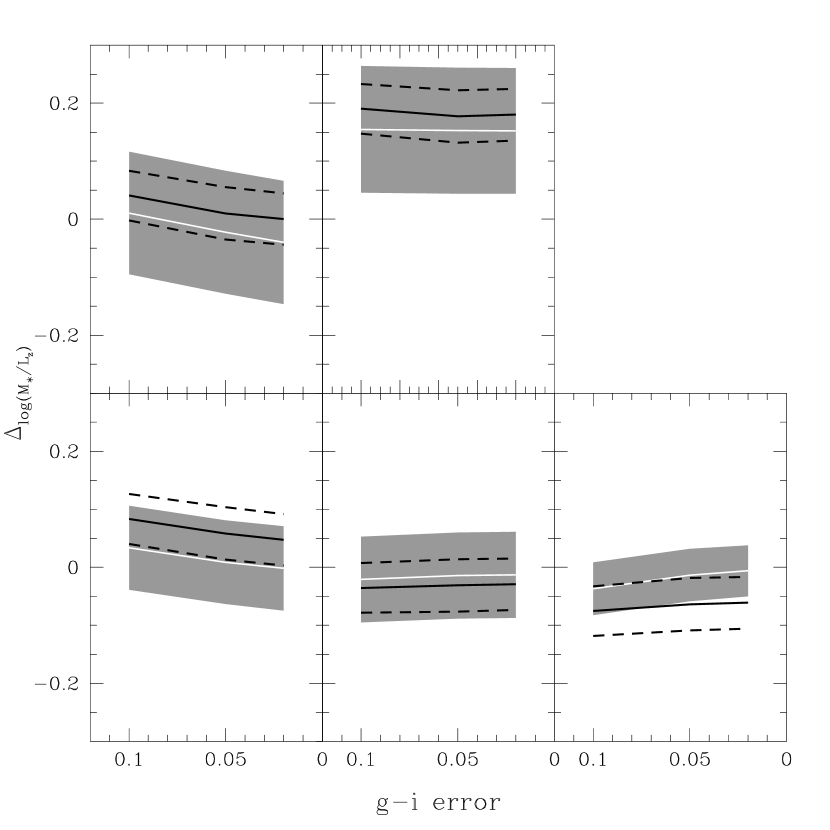
We expect that the uncertainties on photometric estimates can be reduced by combining information from more than one color that bring additional and distinct information on the underlying stellar populations. However, given the systematic flux uncertainties still present in the models and the nearly-degenerate color information, it is found that using more than two colors does not lower the uncertainties on the derived (Zibetti et al., 2009). Therefore we restrict the following analysis to the uncertainties on estimates based on a combination of two colors. Specifically, we consider combinations that involve the color (which provides on average the smallest uncertainties and the most stable results) in conjunction with 1) , which probes shorter wavelengths and brackets the 4000Å-break, 2) probing redder wavelengths, or 3) which extends into the NIR and offers a longer wavelength leverage. We further consider other two color combinations similar in spirit to ,: , and ,.
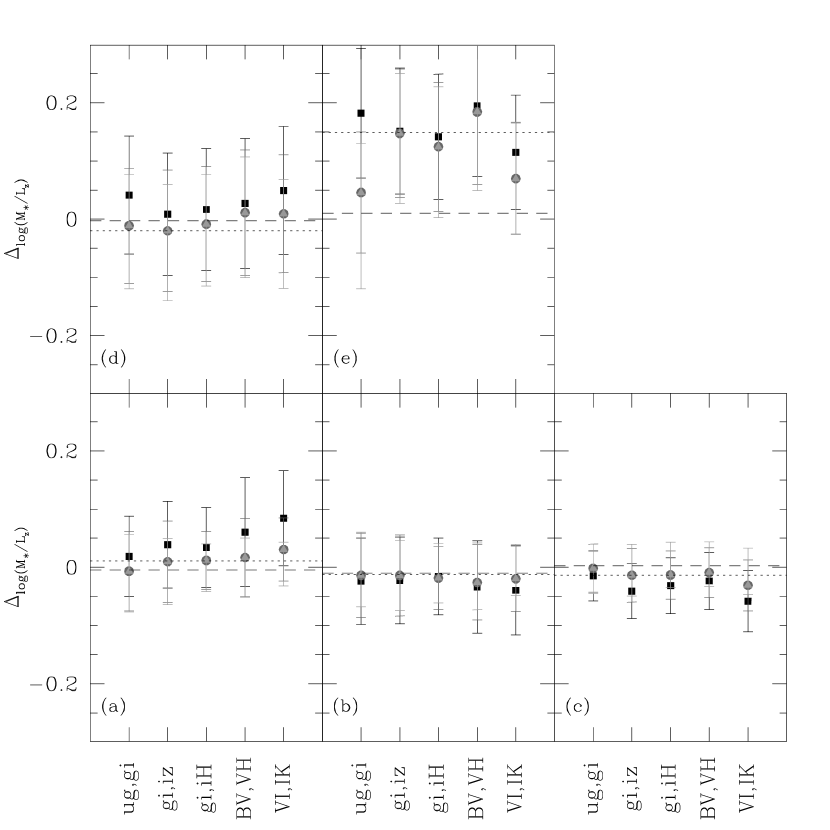
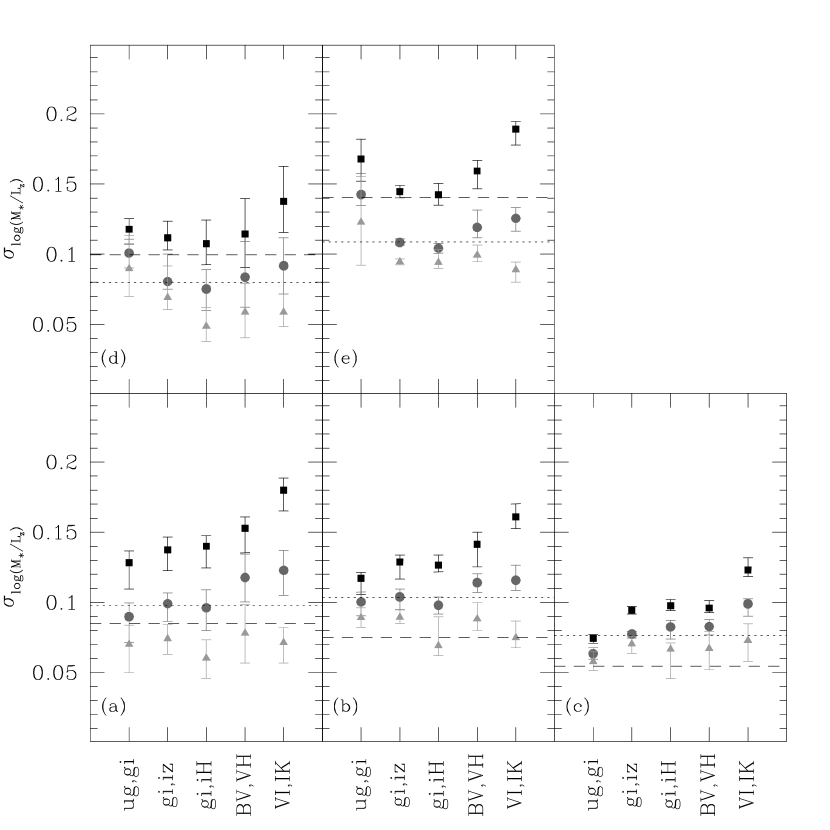
Fig. 12 shows the difference between the estimated and the true one as a function of the five two-color combinations considered here for different spectral classes as in the previous figures. Fig. 13 shows the median and the associated scatter. We reproduce for comparison the equivalent quantities for spectroscopic (case 3, dashed line) and one-color estimates (, dotted line).
From these two plots we can see that improving the photometric quality of the data have a larger impact on the uncertainty associated to optical-NIR color-based estimates, probably because of their lower degree of degeneracy, with respect to optical color-based estimates. In general we notice that the combination of colors that performs better is ,. However, assuming an uncertainty of 0.05 mag on all colors, there is overall no significant improvement by using two colors with respect to only (compare circles with dotted line). This is in agreement with the finding of Zibetti et al. (2009) that the mass-to-light ratio in -band (or equivalently in -band, as used here) has little residual dependence on optical-NIR colors. We stress that we do not include dust here, which is expected to increase the scatter in at fixed color, hence increase the statistical uncertainty (see Zibetti et al., 2009, for dust effects).
At fixed photometric accuracy, different color combinations seem to perform similarly. This is not the case for galaxies with bursty SFHs for which optical-only colors () seem to provide more uncertain estimates. In the case of bursty stellar populations, two-color estimates, even with quite poor photometric quality, seem to be affected by statistical uncertainties similar to or smaller than spectroscopic estimates (with reasonable S/N of 30). However, they are still affected by significant bias.
Finally, in Fig. 14 we compare our preferred spectroscopic estimates, based on a combination of age- and metal-sensitive absorption indices (case 3), with photometric estimates from alone (lower panel) and the combination (upper panel). The plot shows that one-color estimates agree well with spectroscopic ones within the respective uncertainties. This is true for all spectral classes, except for intermediate-age models with a bursty SFH for which we have shown that Bayesian estimates based on color tend to be biased high. The upper panel of Fig. 14 shows that complementing with information on a longer wavelength baseline extending to the NIR further improves the comparison with spectroscopic estimates (and with the true ) by reducing biases, although the statistical uncertainty is not appreciably reduced. Again, we note that although the statistical uncertainty for ‘bursty, intermediate’ types is lower in photometric than spectroscopic estimates, adding the color is not enough to remove the bias in the photometric estimates. This type of galaxies is intrinsically more difficult to constrain.
5 Effects of the assumed SFH and metallicity prior
So far we have analysed mock galaxies that are drawn from the same parent library with which their spectra are fitted. This represents the ideal case in which the prior distribution in SFHs and metallicities of the model library perfectly matches the reality. Despite the very broad range of SFHs covered by our library, this situation likely does not happen when analysing real data. Moreover for each model SFH we assume a fixed metallicity that does not evolve with time. This is certainly different from reality. In this section we attempt to quantify how wrong the estimated /L can be by assuming a prior that does not match the real distribution in SFH and metallicity.
We first explore the effects on the estimated /L of a mismatch in SFH mix, in particular in the fraction of bursts of star formation. To do this we consider two additional model libraries: i) a library of continuous models, in which no burst is added on top of the exponentially declining SFR, and ii) a ‘burst-enhanced’ library, in which 50% of the models are allowed to have a burst in the last 2 Gyr. We then use these libraries, separately, to analyse the mock galaxies extracted from our default library (in which 10% of the models have a burst in the last 2 Gyr).
Figure 15 shows the offset from the true of the value estimated by fitting the absorption features , H, H, H, , (case 3) of the mock galaxies with either continuous models (left-hand plot) or with the burst-enhanced library (right-hand plot). For comparison we reproduce from Fig. 4 the median and rms of the offsets when the mock galaxies are analysed with the same parent library (grey shaded region). A library without bursts cannot reproduce high H values at fixed , i.e. the region of the -H plane occupied by models with recent bursts of star formation (see Fig. 1). As a result, the estimated of ‘bursty’ galaxies suffers of larger uncertainties and biases in particular for intermediate-age galaxies. Clearly, the situation becomes worse by increasing the spectral S/N. We note that in order to reproduce the observed distribution of SDSS galaxies in the -H plane it is necessary to introduce recent bursts of star formation. As opposed to this case, a library that over-represents recent bursts would tend to underestimate the of older galaxies dominated by continuous SFH. Instead, no significant difference is seen from the default ideal case in the median offset and rms for ‘bursty’ galaxies.
We repeat the analysis in Fig. 16 using as observational constraint the color instead of the absorption features. The shaded region represents the range of offsets in the default case (adapted from Fig. 8), while the solid and dashed lines refer to the case in which the mock galaxies are fitted with a library without bursts (red) or with 50% of bursts (blue). Assuming continuous only SFHs does not introduce additional biases in the estimates of ‘bursty’ galaxies, while slightly improves the results for ‘continuous’ galaxies. On the other hand, an increased fraction of models with recent bursts helps to reduce the bias in the estimates of ‘bursty/intermediate’ galaxies (as can be understood from Fig. 10), but tends to underestimate the of ‘continuous’ galaxies by dex.
We now explore the effects of assuming a constant metallicity along the SFH. We generate a Monte Carlo library with the same distribution in SFHs as our default library, but allowing for chemical evolution. The chemical evolution is modeled by a metallicity increasing from 20% of a randomly drawn value (in the range ) until one third of the total stellar mass produced by the underlying exponential SFH is formed, up to when two thirds of the mass are formed. With this simple (and probably extreme) toy model of chemical evolution we do not intend to reproduce the possibly very complex chemical evolution of real galaxies, but only to allow for a mix in metallicities within each individual model. We note that this library does not reach values higher than , and hence does not properly represents observed SDSS galaxies with higher , probably because higher (mass-weighted) metallicities would be required.
We now generate from this variable-metallicity library mock galaxies representing different regions of the -H plane, hence different typical SFHs, as in the default case (we use the same ranges as in Fig. 1 but lower values for the ‘continuous/old’ case). We then fit their spectral features (case 3) with our default library in which the metallicity is constant along the SFH. The result is shown in Fig. 17, where one can see that no significant offset in the estimated is introduced by assuming a fixed metallicity, at least above S/N of . We note however a possible mild underestimate of the of old galaxies and increased uncertainties (as shown by the rms of ) for galaxies with high H values.
Finally, Fig. 18 shows the results when the color is used to constrain the instead of the absorption features. The color of single-metallicity stellar populations does not correctly predict the of composite populations with different metallicities: there is a tendency to underestimate (overestimate) the true of old (young) galaxies by about dex more in comparison to the default case (i.e., when fixed metallicity is assumed both in the mock galaxies and in the fitting library).
We note that the M∗/L increases both with increasing age and with increasing metallicity of the stellar populations. If metallicity evolves along the SFH in such a way that old stars are metal-poorer than young ones (as in our toy model) the age and metallicity effects on M∗/L may compensate at some level. If the age and metallicity effects on spectral indices compensate at the same level then we should not expect to introduce a bias by assuming constant metallicity. Indeed, we checked that M∗/L varies along the -H plane, for instance, in the same way for both the constant-metallicity and the variable-metallicity libraries, so that certain values of absorption features are associated to the same average regardless of chemical evolution. This is not the case for broad-band colors, which have a different response to metallicity and age variations than M∗/L. The relation between and color is narrower and slightly steeper for models with evolving metallicity than for those with fixed metallicity. This explains qualitatively why the of blue (young) galaxies is overestimated, while the of red (old) galaxies is underestimated.
We conclude that mismatches between the assumed and the true distribution in SFHs can affect estimates: while in order to reproduce the whole range of observed spectral features it is necessary to allow for recent bursts of star formation, over-representing them can lead to underestimate the of galaxies dominated by continuous past SFH. The effect is more significant for color-based estimates. Moreover color-based estimates are more susceptible of biases than spectroscopic ones if constant metallicity is assumed.
6 Conclusions
6.1 Recap
In this work we have explored the statistical uncertainties, isolating the effects of SFH and metallicity variations, affecting stellar mass-to-light ratio estimates derived by comparing either stellar absorption features or colors with predictions from a comprehensive library of SFHs. In particular we have addressed the question of which spectroscopic constraints and which spectral accuracy (as quantified by the S/N) are necessary/helpful to reduce the uncertainties as a function of galaxy type.
We made use of recent medium-resolution population synthesis models (Bruzual & Charlot, 2003) to generate spectral absorption indices and broad-band colors for a Monte Carlo library of SFHs characterized by both exponentially declining and bursty SFHs. We randomly selected model galaxies in order to cover different positions in the -H plane which represent different average SFHs: continuous SFHs following a sequence of increasing H (and decreasing stellar age) at decreasing , and bursty SFHs identified by higher H values at fixed . We then generated samples of mock galaxies at different S/N by perturbing the absorption indices of the selected models according to the typical observational error at that S/N. For each mock galaxy we estimated the likelihood distribution of its -band mass-to-light ratio () by comparing different sets of absorption indices with those of all the models in the library. We quantify the accuracy on M∗/L estimates by both the median offset from the true M∗/L and the median 68% likelihood interval of M∗/L computed from the PDF.
We have considered different combinations of absorption indices by including age-sensitive indices only ( and Balmer lines), adding metal-sensitive indices (either extending to red wavelengths in order to include Mg and Fe lines, or only in the blue portion of the spectrum Å), and using only the red portion of the optical spectrum (in particular excluding ).
The uncertainty on estimates shows a similar dependence on S/N regardless of the spectral features used, decreasing significantly with S/N up to a S/N of 30 and then only mildly. In particular, for the sample as a whole, a S/N per pixel of at least is required to constrain to within better than 30% when using age-sensitive indices only ( and Balmer lines). However there is no significant gain by increasing further the S/N: there seems to be a limiting uncertainty of 0.07 dex, when using and H only, or 0.05 dex when using all the three Balmer lines in addition to . At given S/N the best results are obtained by combining and Balmer lines with Mg and Fe features on a relatively long wavelength baseline, which constrain not only the age of the stellar populations but also their metallicity (and thus narrow the allowed range). In this case, errors below 0.05 dex could be reached with S/N spectra. When only spectra below Å are available, there is no significant gain in using additional absorption features with respect to and H only. On the other hand, when only the red portion of the spectrum is available (hence no measure of is possible) similar results on are obtained by combining H with metal-sensitive features.
By distinguishing galaxy spectral type, we find in general that is easier to constrain (i.e. lower S/N and fewer observational constraints are required) for old stellar populations: for example, uncertainties below dex can be reached at S/N with and H only. When using and H only, depends on stellar age in the sense that it becomes larger for galaxies with younger luminosity-weighted ages. For such galaxies, in particular those dominated by a recent burst of star formation, which have a broader metallicity distribution, it is crucial to add constraints from metal-sensitive lines in order to reach accuracy dex at reasonable S/N.
The stellar mass-to-light ratio of galaxies at intermediate and high H values, characterized by recent bursts of SF and intermediate-age populations, cannot be constrained from spectroscopy within better than dex. The ability of reducing for galaxies with bursty SFHs (in general with high H values) is also limited by discreteness effects which come into play at S/N and using more than two observational constraints, in which cases the PDF cannot be reliably sampled. Even if there were enough models to build a robust PDF, the intrinsic scatter in at fixed index-index values is between 0.1 and 0.2 dex at intermediate and high H. We conclude that for this type of galaxies there is no gain in increasing the S/N above or using more observational constraints.
Applying the same Bayesian method to derive estimates from colors shows that, in the assumption that redshift is known and neglecting dust effects, it is possible to reach an accuracy only slightly worse than with absorption indices. However a photometric accuracy of at least 0.05 mag is required. The smallest uncertainties are obtained with which has the widest wavelength leverage. As opposed to optical colors, optical-NIR colors of similar photometric quality provide larger uncertainties because they show a broader relation with and they depend on both age and metallicity. Moreover they tend to under-/over-estimate the true for old/young populations, respectively.
We note that, while (optical) colors provide similar or smaller (and more homogeneous) uncertainties for bursty, intermediate-age galaxies, they systematically overestimate their by dex. There is no significant gain in accuracy by adding another color to . Although uncertainties are slightly smaller by combining with a NIR color (such as ), this is not enough to remove the bias for bursty, intermediate-age galaxies.
6.2 The Bottom Line
We conclude that:
-
•
The mass-to-light ratio of galaxies dominated by old stellar populations or with smooth SFH is in general better constrained by spectroscopic absorption indices (in particular combining age- and metal-sensitive features for young stellar populations) both in terms of retrieving the correct value and in terms of statistical uncertainty. An accuracy below 0.1 dex is reached already at S/N and it can go below 0.05 dex at higher S/N.
-
•
For galaxies with smooth SFH and young stellar populations one optical color or a combination of an optical and an optical-NIR color provides only slightly worse statistical uncertainties on than spectroscopic constraints, in the assumption that redshift is known and dust is not important, and when photometric errors are below mag.
-
•
For galaxies which have experienced a recent burst of SF (identified by high H values at fixed ) we are limited by either large uncertainties (dex) on spectroscopic estimates or biased estimates from colors (overestimated by up to 0.2 dex).
Another important conclusion is that mismatches in the assumed SFH and metallicity distribution can have an impact on the estimated M∗/L. It is necessary to include burst of SF in order to reproduce the whole range of observables. However, over-representing them can lead to underestimate the M∗/L of old stellar populations by dex if based on absorption features or up to 0.1 dex if based on colors. Perhaps surprisingly, the assumption of constant metallicity does not affect the M∗/L estimates from spectra, while it may introduce significant biases in color-based estimates.
6.3 Recommendations and Practical Considerations
We finish by highlighting a few practical issues, with some emphasis on responses to the particular questions posed in the introduction to this paper.
One of the prime motivations of this paper was to understand to which extent data quality affects the determination of M∗/L. If high-quality data allowed one to uniquely select a best-fit model out of a sample of more than a hundred thousand SFHs, then relatively little thought needs to be put into the construction of such a model template set for M∗/Ls (in particular in the exact distribution of different SFHs and metallicities). Unfortunately, the results of this paper have argued against this perspective. In at least few cases, the stellar M/L values one gets depend sensitively on the exact mix of SFHs in the model template set. The first, perhaps obvious, consideration is that the template set should cover the full range of possible SFHs in order to be applicable to all galaxy spectral types. This becomes critical when good quality data are available. In particular, recent bursts of SF should be well sampled in order to analyse intermediate-age bursty galaxies, where there is considerable bias and scatter in estimated M∗/L, even at very high S/N and using a wide range of spectroscopic indices to constrain the model fits (summarized in, e.g., Figs. 6 and 14. On the other hand, the exact fraction of bursts assumed affects the M∗/L estimates of old stellar populations (Fig. 15 and 16). Another case is illustrated in Fig. 11, where it is clear that the time at which star formation is assumed to start makes a considerable difference to (at least) color-derived stellar M/L. In all these cases, any mismatch between the mix of SFHs in the input template set and the actual Universe at the redshift of interest will manifest itself through biases and increased scatter in stellar M/L estimates. Our analysis also shows that, while the assumption of single-metallicity stellar populations appears not to affect spectroscopic M∗/L estimates (as long as the range in assumed metallicities encompass the range of true mass-weighted metallicities), it can introduce significant biases in color-based estimates. These considerations underline one of the key conclusions of this paper, that the mix of star formation histories and metallicities of the input template set should match as well as possible the actual distribution of star formation histories and metallicities in order to produce optimal stellar M/L values.
A second motivation was to try to understand if and where model development acquires lower priority and urgency, at least from the perspective of stellar mass estimates. There are parts of parameter space where plausible data quality could yield stellar masses accurate to dex, in the absence of any systematic mismatches between the model and data. This potentially very high level of accuracy is of course currently out of reach, given the systematic uncertainties inherent to current stellar population modeling (e.g. Maraston et al., 2006; Conroy et al., 2008). Accordingly, it has to be concluded that model development and systematic error control should remain a very high priority for those wishing to understand the stellar mass content of the Universe.
A final motivation was to understand what kind of data is necessary or sufficient to produce accurate stellar M/L values. We cannot and do not offer a definitive answer to this question in this paper, for at least two reasons. Firstly, constraint of important sources of systematic stellar population model uncertainty (e.g., importance of TP-AGB stars to the near-infrared light or contribution of BHB stars to the optical light of old stellar populations) may require additional data not considered here. Secondly, dust has been neglected here, and further investigation may conclude that more data will be required to model its effect properly than are required simply to constrain the stellar populations. Notwithstanding these caveats, we find that, while in general spectroscopic information is superior in constraining a galaxy SFH and hence its M∗/L, in the case of relatively smooth star formation histories optical colors alone are enough to constrain the stellar M/L to reasonable accuracy (dex). The addition of extra broad-band information does not offer large improvements. An obvious and important case in which the addition of spectral information can improve the quality of M∗/L estimates is where there is highly-structured SFH in the last Gyr, where Balmer line information can be critical in minimizing the bias in inferred stellar M/L value. Moreover, according to our analysis, spectroscopic M∗/L estimates appear preferable to color-based ones in that they are less sensitive to mismatches between the assumed and the true SFH distribution and the assumption of constant metallicity in time.
References
- Abraham et al. (1999) Abraham, R. G., Ellis, R. S., Fabian, A. C., Tanvir, N. R., & Glazebrook, K. 1999, MNRAS, 303, 641
- Arrigoni et al. (2009) Arrigoni, M., Trager, S. C., Somerville, R. S., & Gibson, B. K. 2009, arXiv:0905.4189
- Baldry et al. (2006) Baldry, I. K., Balogh, M. L., Bower, R. G., Glazebrook, K., Nichol, R. C., Bamford, S. P., & Budavari, T. 2006, MNRAS, 373, 469
- Baldry & Glazebrook (2003) Baldry, I. K., & Glazebrook, K. 2003, ApJ, 593, 258
- Balogh et al. (1999) Balogh, M. L., Morris, S. L., Yee, H. K. C., Carlberg, R. G., & Ellingson, E. 1999, ApJ, 527, 54
- Bell & de Jong (2001) Bell, E. F., & de Jong, R. S. 2001, ApJ, 550, 212
- Bell et al. (2003) Bell, E. F., McIntosh, D. H., Katz, N., & Weinberg, M. D. 2003, ApJS, 149, 289
- Borch et al. (2006) Borch, A., Meisenheimer, K., Bell, E. F., Rix, H.-W., Wolf, C., Dye, S., Kleinheinrich, M., Kovacs, Z., & Wisotzki, L. 2006, A&A, 453, 869
- Brinchmann & Ellis (2000) Brinchmann, J., & Ellis, R. S. 2000, ApJ, 536, L77
- Bruzual (2007) Bruzual, A. G. 2007, in IAU Symposium, Vol. 241, IAU Symposium, ed. A. Vazdekis & R. F. Peletier, 125–132
- Bruzual & Charlot (2003) Bruzual, G., & Charlot, S. 2003, MNRAS, 344, 1000
- Cappellari et al. (2006) Cappellari, M., et al. 2006, MNRAS, 366, 1126
- Chabrier (2003) Chabrier, G. 2003, PASP, 115, 763
- Chang et al. (2006) Chang, R., Gallazzi, A., Kauffmann, G., Charlot, S., Ivezić, Ž., Brinchmann, J., & Heckman, T. M. 2006, MNRAS, 366, 717
- Cid Fernandes et al. (2007) Cid Fernandes, R., Asari, N. V., Sodré, L., Stasińska, G., Mateus, A., Torres-Papaqui, J. P., & Schoenell, W. 2007, MNRAS, 375, L16
- Cimatti et al. (2008) Cimatti, A., et al. 2008, A&A, 482, 21
- Coelho et al. (2007) Coelho, P., Bruzual, G., Charlot, S., Weiss, A., Barbuy, B., & Ferguson, J. W. 2007, MNRAS, 382, 498
- Cole et al. (2001) Cole, S., et al. 2001, MNRAS, 326, 255
- Conroy et al. (2008) Conroy, C., Gunn, J. E., & White, M. 2008, ArXiv e-prints
- Conroy et al. (2009) Conroy, C., White, M., & Gunn, J. E. 2009, ArXiv e-prints
- da Cunha et al. (2008) da Cunha, E., Charlot, S., & Elbaz, D. 2008, MNRAS, 388, 1595
- Davé (2008) Davé, R. 2008, MNRAS, 385, 147
- de Jong (1996) de Jong, R. S. 1996, A&A, 313, 377
- Driver et al. (2007) Driver, S. P., Popescu, C. C., Tuffs, R. J., Liske, J., Graham, A. W., Allen, P. D., & de Propris, R. 2007, MNRAS, 379, 1022
- Drory et al. (2004) Drory, N., Bender, R., Feulner, G., Hopp, U., Maraston, C., Snigula, J., & Hill, G. J. 2004, ApJ, 608, 742
- Elmegreen (2006) Elmegreen, B. G. 2006, ApJ, 648, 572
- Ferreras et al. (2008) Ferreras, I., Saha, P., Williams, L. L. R., & Burles, S. 2008, in IAU Symposium, Vol. 244, IAU Symposium, ed. J. Davies & M. Disney, 206–215
- Fontana et al. (2004) Fontana, A., et al. 2004, A&A, 424, 23
- Fontana et al. (2006) —. 2006, A&A, 459, 745
- Franzetti et al. (2008) Franzetti, P., Scodeggio, M., Garilli, B., Fumana, M., & Paioro, L. 2008, in Astronomical Society of the Pacific Conference Series, Vol. 394, Astronomical Data Analysis Software and Systems XVII, ed. R. W. Argyle, P. S. Bunclark, & J. R. Lewis, 642–+
- Gallazzi et al. (2008) Gallazzi, A., Brinchmann, J., Charlot, S., & White, S. D. M. 2008, MNRAS, 383, 1439
- Gallazzi et al. (2006) Gallazzi, A., Charlot, S., Brinchmann, J., & White, S. D. M. 2006, MNRAS, 370, 1106
- Gallazzi et al. (2005) Gallazzi, A., Charlot, S., Brinchmann, J., White, S. D. M., & Tremonti, C. A. 2005, MNRAS, 362, 41
- Gibson & Matteucci (1997) Gibson, B. K., & Matteucci, F. 1997, MNRAS, 291, L8
- Hoversten & Glazebrook (2008) Hoversten, E. A., & Glazebrook, K. 2008, ApJ, 675, 163
- Kauffmann et al. (2003a) Kauffmann, G., et al. 2003a, MNRAS, 341, 33
- Kauffmann et al. (2003b) Kauffmann, G., Heckman, T. M., White, S. D. M., Charlot, S., Tremonti, C., Peng, E. W., Seibert, M., Brinkmann, J., Nichol, R. C., SubbaRao, M., & York, D. 2003b, MNRAS, 341, 54
- Kennicutt (1983) Kennicutt, R. C., Jr. 1983, ApJ, 272, 54
- Korn et al. (2005) Korn, A. J., Maraston, C., & Thomas, D. 2005, A&A, 438, 685
- Kroupa (2001) Kroupa, P. 2001, in Astronomical Society of the Pacific Conference Series, Vol. 228, Dynamics of Star Clusters and the Milky Way, ed. S. Deiters, B. Fuchs, A. Just, R. Spurzem, & R. Wielen, 187–+
- Le Fèvre et al. (2005) Le Fèvre, O., et al. 2005, A&A, 439, 845
- Longhetti & Saracco (2009) Longhetti, M., & Saracco, P. 2009, MNRAS, 394, 774
- MacArthur (2005) MacArthur, L. A. 2005, ApJ, 623, 795
- Maraston (2005) Maraston, C. 2005, MNRAS, 362, 799
- Maraston et al. (2006) Maraston, C., Daddi, E., Renzini, A., Cimatti, A., Dickinson, M., Papovich, C., Pasquali, A., & Pirzkal, N. 2006, ApJ, 652, 85
- Marchesini et al. (2008) Marchesini, D., van Dokkum, P. G., Forster Schreiber, N. M., Franx, M., Labbe’, I., & Wuyts, S. 2008, ArXiv e-prints
- Meurer et al. (2009) Meurer, G. R., et al. 2009, ApJ, 695, 765
- Panter et al. (2004) Panter, B., Heavens, A. F., & Jimenez, R. 2004, MNRAS, 355, 764
- Papovich et al. (2001) Papovich, C., Dickinson, M., & Ferguson, H. C. 2001, ApJ, 559, 620
- Popescu & Tuffs (2005) Popescu, C. C., & Tuffs, R. J. 2005, The Spectral Energy Distributions of Gas-Rich Galaxies: Confronting Models with Data, 761,
- Pozzetti et al. (2007) Pozzetti, L., et al. 2007, A&A, 474, 443
- Prochaska et al. (2007) Prochaska, L. C., Rose, J. A., Caldwell, N., Castilho, B. V., Concannon, K., Harding, P., Morrison, H., & Schiavon, R. P. 2007, AJ, 134, 321
- Schiavon (2007) Schiavon, R. P. 2007, ApJS, 171, 146
- Scoville et al. (2007) Scoville, N., et al. 2007, ApJS, 172, 1
- Shen et al. (2003) Shen, S., Mo, H. J., White, S. D. M., Blanton, M. R., Kauffmann, G., Voges, W., Brinkmann, J., & Csabai, I. 2003, MNRAS, 343, 978
- Skrutskie et al. (2006) Skrutskie, M. F., et al. 2006, AJ, 131, 1163
- Thomas et al. (1999) Thomas, D., Greggio, L., & Bender, R. 1999, MNRAS, 302, 537
- Thomas et al. (2003) Thomas, D., Maraston, C., & Bender, R. 2003, MNRAS, 339, 897
- Thomas et al. (2004) Thomas, D., Maraston, C., & Korn, A. 2004, MNRAS, 351, L19
- Tojeiro et al. (2007) Tojeiro, R., Heavens, A. F., Jimenez, R., & Panter, B. 2007, MNRAS, 381, 1252
- Trager et al. (2000) Trager, S. C., Faber, S. M., Worthey, G., & González, J. J. 2000, AJ, 120, 165
- Tripicco & Bell (1995) Tripicco, M. J., & Bell, R. A. 1995, AJ, 110, 3035
- van Dokkum (2008) van Dokkum, P. G. 2008, ApJ, 674, 29
- Walcher et al. (2008) Walcher, C. J., et al. 2008, A&A, 491, 713
- Weidner & Kroupa (2005) Weidner, C., & Kroupa, P. 2005, ApJ, 625, 754
- Wilkins et al. (2008) Wilkins, S. M., Hopkins, A. M., Trentham, N., & Tojeiro, R. 2008, MNRAS, 391, 363
- Wolf et al. (2004) Wolf, C., Meisenheimer, K., Kleinheinrich, M., Borch, A., Dye, S., Gray, M., Wisotzki, L., Bell, E. F., Rix, H.-W., Cimatti, A., Hasinger, G., & Szokoly, G. 2004, A&A, 421, 913
- Worthey et al. (1992) Worthey, G., Faber, S. M., & Gonzalez, J. J. 1992, ApJ, 398, 69
- Worthey et al. (1994) Worthey, G., Faber, S. M., Gonzalez, J. J., & Burstein, D. 1994, ApJS, 94, 687
- Worthey & Ottaviani (1997) Worthey, G., & Ottaviani, D. L. 1997, ApJS, 111, 377
- Wuyts et al. (2009) Wuyts, S., Franx, M., Cox, T. J., Hernquist, L., Hopkins, P. F., Robertson, B. E., & van Dokkum, P. G. 2009, ApJ, 696, 348
- York et al. (2000) York, D. G., et al. 2000, AJ, 120, 1579
- Zibetti et al. (2009) Zibetti, S., Charlot, S., & Rix, H.-W. 2009, ArXiv e-prints