Two-stage high frequency pulse tube cooler
for refrigeration at 25 K
Abstract
A two-stage Stirling-type U-shape pulse tube cryocooler driven by a 10 kW-class linear compressor was designed, built and tested. A special feature of the cold head is the absence of a heat exchanger at the cold end of the first stage, since the intended application requires no cooling power at this intermediate temperature. Simulations where done using Sage-software to find optimum operating conditions and cold head geometry. Flow-impedance matching was required to connect the compressor designed for 60 Hz operation to the 40 Hz cold head. A cooling power of 12.9 W at 25 K with an electrical input power of 4.6 kW has been achieved up to now. The lowest temperature reached is 13.7 K.
keywords:
Pulse tube (E), Power applications (F)1 Introduction
The recent development efforts for High-Temperature-Superconducting (HTS) applications like transformers, generators or motors create a demand on large scale cryocoolersGromol2004 [1]. While Gifford-McMahon (GM)- and oil-lubricated Stirling-coolers are presently the prevalent choice in HTS power applicationsGromol2004 [1, 2, 3], pulse tube coolers (PTC) promise a higher reliability and longer maintenance intervals. Large scale PTCs of the GM-type have been used for low temperature cryocooling since several years now, mostly in the 4 K region. While it is possible with this type of cooler to achieve large cooling powers in the 30 K region, they also suffer from relative short maintenance intervals of the compressor. Also the efficiency of the compressor/rotary-valve combination is quite low. Therefore, high frequency Stirling-type PTCs with oil-free linear compressors became more attractive since they promise better cooling performance than GM-type coolers as well as longer maintenance intervals. During the last years, several large scale single-stage Stirling type PTCs for operating temperatures between 60 and 80 K have been successfully developedZia2007 [4, 5, 6].
The work presented in the present paper is part of our ongoing efforts to develop a Stirling type pulse tube cryocooler for neon recondensation near 25 KGromoll2006 [7, 8, 9]. Among others, this temperature is required to operate a BSCCO-based 400 kW HTS motor developed at Siemens for ship propulsionHasselt2004 [2]. The low temperature allows for higher current densities inside the rotor coils and thus for a more compact design. During our high-power PTC development some limitations arose from a new kind of regenerator streaming that results from a poor thermal communication of the regenerator gas in transverse direction, as is also described inSo2006 [10]. This streaming starts when the cold end temperature falls below a critical value and/or when a critical acoustic power (or mass flow) is exceeded. Because of an excess heat transfer to the cold end, the streaming significantly degrates the cooling performance. Up to now, the critical operating conditions for the onset of such a streaming cannot be quantitatively predictedSo2006 [10]. Possible solutions like enhancing the radial thermal conductivity of the regenerator matrix imply other losses caused by heat transfer inside the regeneratorDietrich2007 [8]. So far the only solution to avoid decreasing the regenerator performance is to lower the amount of acoustic power.
A two-stage, gas-coupled cryocooler provides a way to solve these problems. First, a part of the acoustic power is directed into the first stage, thus reducing the acoustic power in the second stage. Second, the small acoustic power in the second stage allows a reduced regenerator diameter, which enhances the radial thermal communication of the working gas. Both measures reduce the risk of that kind of regenerator streaming. We therefore decided to develop a new, two-stage gas-coupled cold head, to minimize the possibility of regenerator streaming.
2 Modelling of the cold head
2.1 Design considerations
The cold head was modelled by maintaining two constraints: Firstly, to reduce the possibility of regenerator streaming, the acoustic power inside the regenerator should not exceed a critical value. Because theoretical predictions of the onset of such streaming are still under developmentSo2006 [10], we relied on our experiences from former designsDietrich2007 [8] and limited the acoustic power to 2 kW. It was clear that the target cooling power of 60 W @ 25 K could not be obtained with such a low power, so the only solution was to build several identical cold heads for parallel operation on one compressor. The necessary number n of parallel cold heads was estimated from
| (1) |
where is the cooling power of one cold head at temperature , the ambient temperature, and the efficiency of the cooler. From the pulse tube design of Nguyen et al.Nguyen2004 [11], we estimated the target efficiency at 25 K and 300 K to 10% of Carnot relative to pV-power. Then Eq. 1 gives a rounded-up number of n = 4 cold heads.
Secondly, an important factor is that the required pV-power of 8 kW should be delivered by the available 10 kW compressor (Qdrive model 2S297W) which was designed for an optimum working frequency of 60 Hz. However, consideration of the regenerator losses at low temperatures and high frequency revealed that the cold heads must be driven at a lower frequency in order to reach high efficiency (see next section). Another problem of using high frequencies is the proper flow straightening at high gas velocities at low gas displacement amplitudes. Since the pV-power scales roughly linearly with the working frequency, the complete cooler could not be tested with the present compressor. We therefore decided to test only one of the four parallel cold heads and to connect a more appropriate compressor at a later date.
2.2 Cooler configuration
While two-stage PTCs with thermally coupled stages are able to reach low temperaturesJiang2004 [12, 13], there are difficulties to transfer heat over large cross-sections, which are required in high-frequency, high power PTCsSun2009 [9]. Another problem is the large dead volume at the cold end of a regenerator with uniform cross-section that is caused by flow straighteners and the connection to the pulse tube, which has to be charged by the mass flow from the warm end. Compared to a gas-coupled cooler, where the cross-section is staged, this causes an increase in regenerator losses. While this may be solved by use of a conical regenerator, a gas-coupled two-stage cold head was favoured for practical reasons.
Another advantage of a gas-coupled systems arises, when no cooling power is required at the first stage, as is the case with the intended HTS-motor cooling. In usual two-stage pulse tube systems, a solid flow channel connects the first-stage pulse tube to the joint between the two regenerators, where some kind of flow separator divides the gas flow from the first-stage regenerator. Normally, the connecting channel is small in order to reduce void volume and to allow the cold gas from the first stage to exchange heat with the solid. From a thermodynamic point of view, each heat flow across a temperature difference at a mean temperature produces irreversible entropy:
| (2) |
which leads to a decrease in exergy Kittel2005 [14]. The loss from eq. (2) can be avoided by eliminating such heat transfer areas and by thermally decoupling the first stage pulse and regenerator, e.g. by the use of a connecting line and flow straighteners with low thermal conductance. In such a system, the first stage will be purely “enthalpy coupled” avoiding irreversible entropy production by heat transfer.
At the beginning of the design, a basic SageGedeon1994 [15] model without compressor was set up to find the optimum operating conditions. Using Sage, the regenerator mesh of the first stage was fixed to stainless steel with mesh #400 (25 µm wire diameter) and the second stage was filled with lead spheres. The phase shifters consist of single inertance lines and a second-inlet at the second stage. The filling pressure was set to 2.5 MPa and the maximum pressure amplitude to 0.4 MPa as this is the limit of the 2S297W compressor. Simulations were performed to analyze the effect of operating frequency and input power. Fig.
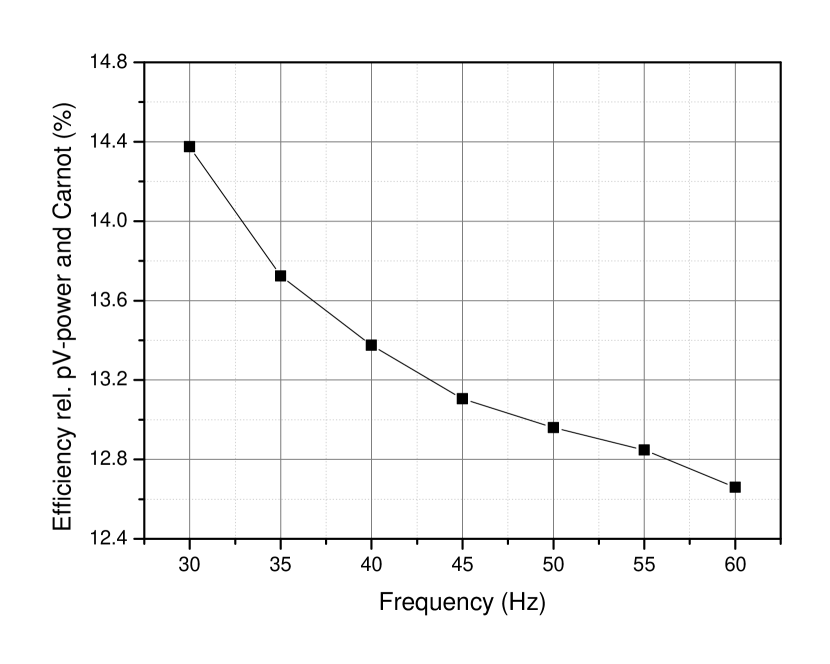
1 shows the cold head efficiency in a frequency range between 30 and 60 Hz with a pV-power of 2 kW. In each simulation, the lengths and diameters of the regenerators, pulse tubes and phase shifters where optimized to give maximum cooling power at 25 K. Also the lead sphere diameter was optimized, while the geometry of the heat exchangers was not varied in order to speed up the optimization process. It can be seen from Fig.1 that the efficiency increases when going to lower frequencies. Most of the losses arise from regenerator inefficiency due to friction loss and small thermal penetration depth. While operation at a lower frequency seems to be better, one must also take into account that the compressor must be able to deliver the required acoustic power at low frequency. Therefore, as a compromise we have chosen a working frequency of 40 Hz.
3 System setup
Fig.
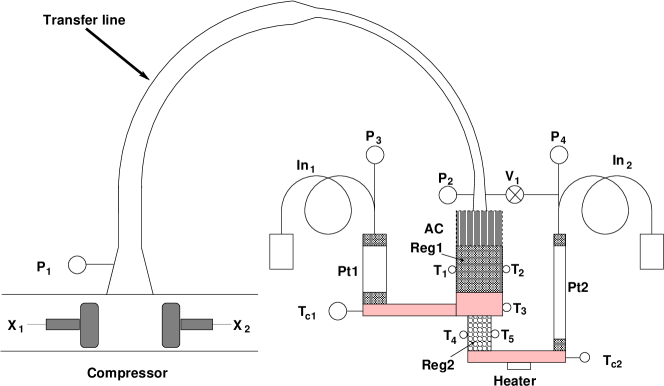
2 shows the system setup. The data acquisition setup is similar to that described inDietrich2007 [8]. The cold head is connected to the compressor via a transfer line, which consists of two tubes with different diameters connected in series. As described in section 4, the transfer line also acts as an impedance matching device. The aftercooler is of shell and tube type. The first stage regenerator is filled with #325/28 µm and #400/25 µm stainless steel screens. The flow distributor between the two regenerators is filled with an alternating stack of #80 and #400 screens. The second stage regenerator is filled with lead spheres of about 100 µm diameter. The lengths (diameters) of the first and second stage pulse tubes are 70 mm (26 mm), and 107 mm (16 mm), respectively. Like the transfer line, the inertance tubes also consist of a series of two tubes with different diameters.
The linear compressor is equipped with position sensors and . Together with pressure sensor located in the compression space, it is possible to measure the acoustic power delivered by the compressor in real-time. Pressure sensors are also located at the entrance to the aftercooler () and at the hot ends of the pulse tubes ( and ). Temperature sensors are located at the cold ends of the pulse tubes ( and ) and pairwise with a 180° azimuthal shift at the mid positions of the regenerators (, and , ) to detect a possible flow inhomogeneity. There is also an additional sensor installed at the flow distributor (). All temperature sensors except are of PT-100 type. is a cernox sensor. An electrical heater is installed at the bottom of the second stage heat exchanger to enable the measurement of cooling power. The second stage is equipped with an adjustable second-inlet ().
4 Properties of the impedance matching line
After finishing the basic design of the cold head, the compressor model was added to the Sage model. The standard way to adapt the “60 Hz” compressor to the cold head and operate them at 40 Hz would have been to add a rather large void volume in between themMartin2002 [16]. However, it was found from our simulations that the required amplitude of the pressure wave cannot be achieved by the use of a void volume. Instead, we have chosen a transfer line, which acts simultaneously as an impedance matching device and as pressure wave amplifier. The length of the line is 6 m, which roughly corresponds to one fourth of the acoustic wave length of helium at 40 Hz. Fig.
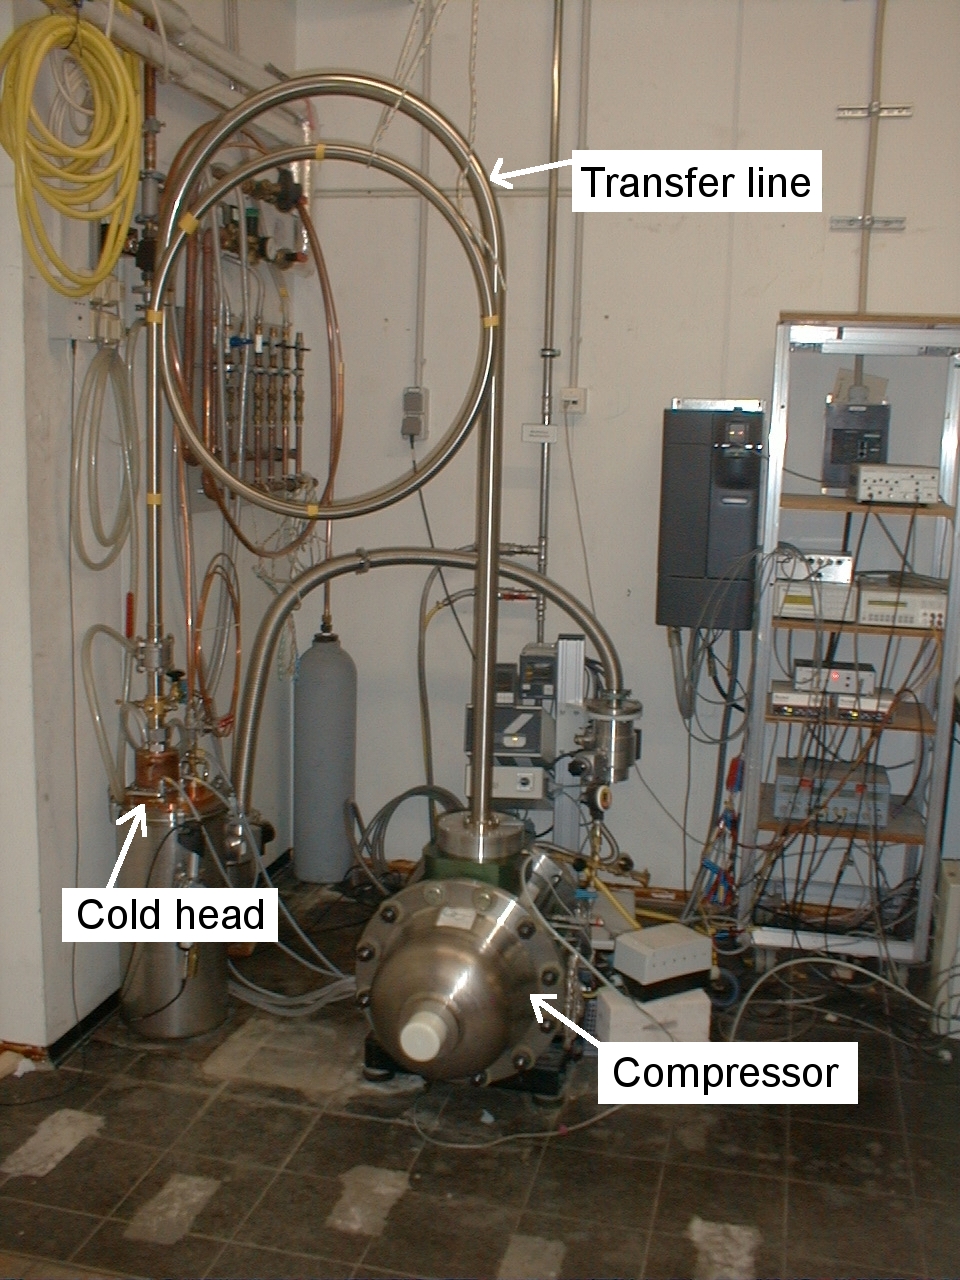
3 shows a photograph of the setup. In order to reduce losses, the transfer line consists of two parts with different diameters of 43 mm and 30 mm. Fig.

4 shows the calculated pressure and mass flow amplitudes in the transfer line. The input and output impedance are also given in the graph. It is seen that the transfer line amplifies the pressure amplitude of 60 kPa at the inlet to 290 kPa at the outlet (cold head side). The amplification of the pressure amplitude is accompanied by a 38% loss of acoustic power between compressor and cold head, as seen from Fig.
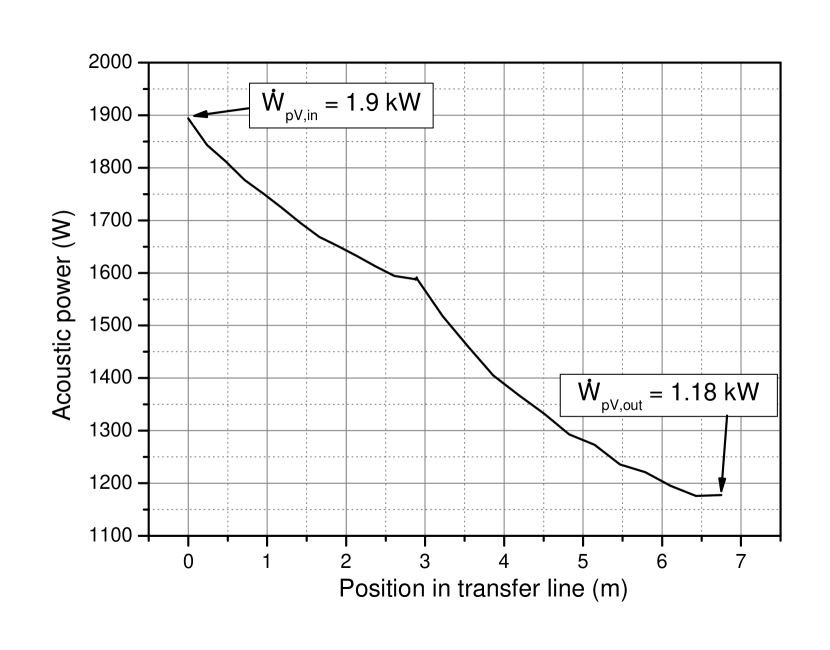
5. During the validation of the computer model, significant differences were found between the measured and the calculated pressure phase shifts at both ends of the transfer line, which also affected the pV-power. We attribute this to the bended structure of the transfer line, which cannot be considered in the model. Upon lengthening the transfer line in the model by 10% a better matching with the experimental results has been accomplished. The difference in pressure amplitudes between the simulation and the measurement went down from 35 kPa to 10 kPa (see also Fig. 9), while the pressure phase angle error decreased from over 20° to less than 5° inside the compressor and from 5° to less than 2° at the end of the transfer line.
5 Experimental results and discussion
During the optimization process, several modifications to the cold head were made. In the first runs, a flow maldistribution in the first stage pulse tube was found and fixed by adding more flow straightener mesh at the cold end. Later optimizations concentrated on the flow distributor between the two regenerators. Simultaneously with the measurements, the simulation model was constantly improved to reflect the exact construction of the cold head. All measurement were performed at 2.5 MPa filling pressure and 40 Hz operating frequency.
Fig.
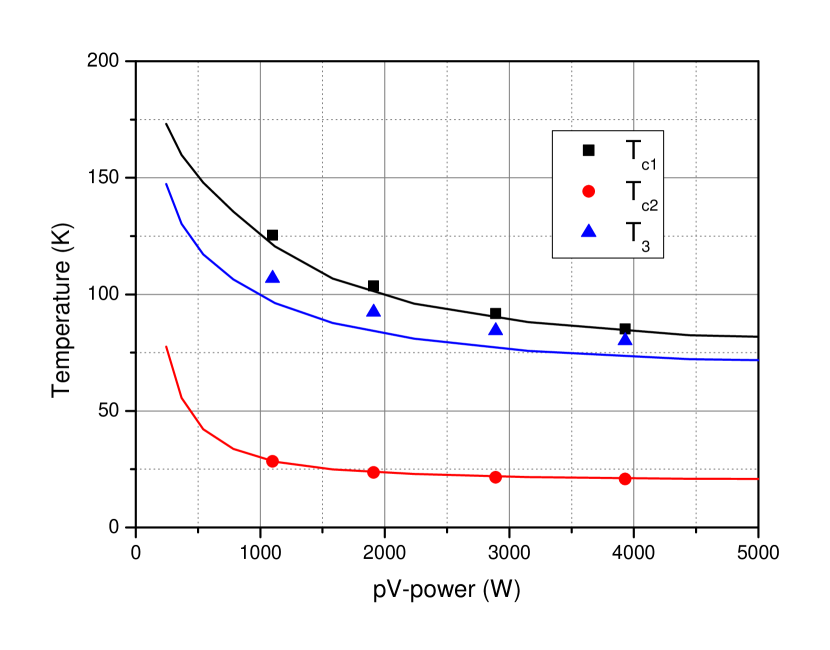
6 shows the measured temperatures at the cold ends of the first and second stage pulse tubes and at the flow distributor between the regenerators as function of pV-power in inertance mode (second-inlet closed) compared to the corresponding simulation results. There is a good agreement for the cold end temperatures and , but a slight mismatch for the temperature , which we attribute to some flow inhomogeneities inside the flow distributor.
Fig.
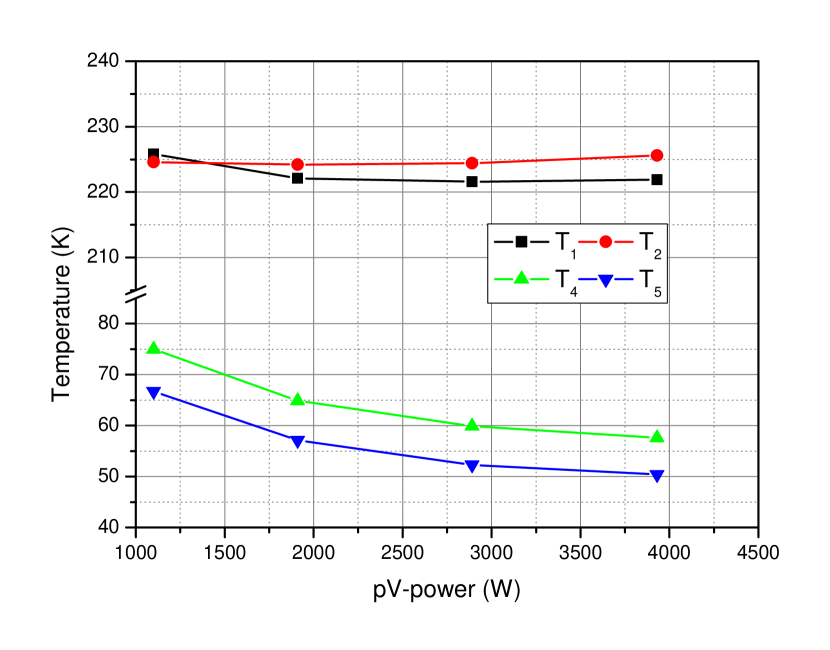
7 shows the temperature sensor readings , and , (see Fig. 2) at the middle positions of the two regenerators as function of the pV-power. There is a slight difference between and at higher pV-powers in the first regenerator, while in the smaller second regenerator a constant offset exists, which is attributed to an inexact positioning of the sensors.
Fig.
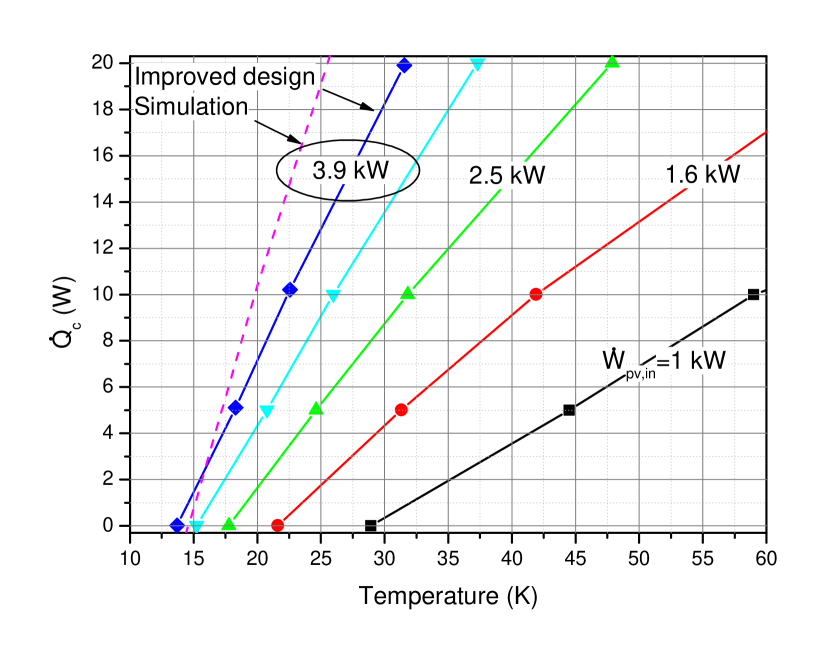
8 shows the cooling powers for various pV-powers in second-inlet mode. Before these measurements the second-inlet was adjusted for minimum no-load temperature. After the initial measurements took place, a modified cold head was manufactured, which had less dead volumes than the original one. As seen from Fig. 8, this improved version is able to produce cooling power of 12.9 W at 25 K with 3.9 kW of pV-power, corresponding to 2.4 kW acoustic power at the inlet to the cold head, because of the loss in the transfer line (see Fig. 5). The electric input power to the compressor is then 4.7 kW at 90% of the full stroke. The lowest temperature of 13.7 K is reached in the same measurement with a slope of the load line of 1.15 W/K. Given the loss in the transfer line, this corresponds to an efficiency of 5.6% relative to the acoustic power at the cold head and Carnot, which is only half of the target efficiency estimated in section 2.1. The dashed line shows the simulated result with 3.9 kW of pV-power, which gives a cooling power of 19 W at 25 K at a much larger slope of 1.75 W/K and a slightly higher no-load temperature. While the slope can be attributed to the smaller pressure drop in the model compared to the experiment, a higher no load temperature points to some inaccuracies of the model parameters which are not yet identified.
Fig.
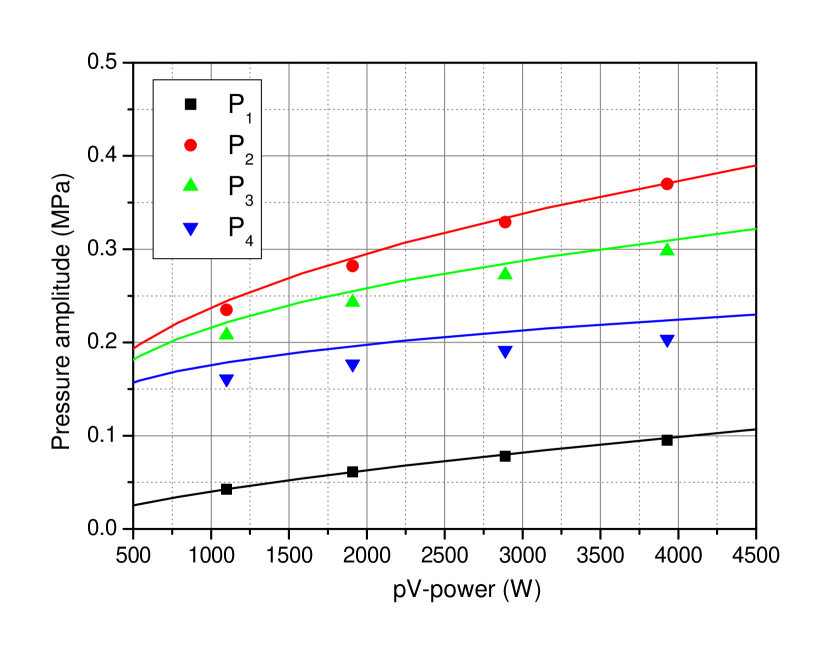
9 compares the measured and simulated pressure amplitudes at different pV-powers in inertance mode (second-inlet closed). While for the pressure amplitudes in the compressor and at the hot end of the regenerator the agreement between measurement and simulation is good, the pressure amplitudes in the pulse tubes are lower in the experiment than in the simulation. In case of the second pulse tube the difference amounts for 10%. This is significant as the enthalpy flow in the pulse tube roughly scales with the square of the pressure amplitude. Therefore, compared to the experiment the calculated enthalpy flow in the second pulse tube should be larger by 20%. Table
| Enthalpy flow (W) | Net cooling power (W) | |
|---|---|---|
| Regenerator 2 | 25.2 (20) | |
| Pulse tube 2 | 31.6 (20.8) | 6.4 (0.8) |
1 shows the calculated enthalpy flows including conduction losses in the second stage regenerator and pulse tube with second-inlet closed. A modified model which has the additional pressure drop simulated by adding some local loss in the second stage cold heat exchanger was made. These results are shown in parentheses in table 1. Due to the additional pressure drop the enthalpy flow in the regenerator decreases by about 5 W (21%) and the enthalpy flow in the pulse tube decreases by about 11 W (33%). The difference in enthalpy flows between the pulse tube and the second regenerator gives the net cooling power , which is about 6 W larger without the additional pressure drop. The reason for the larger measured pressure drop is not yet identified, but is hoped to be fixed in the next cold head version.
6 Conclusions
We have developed a Stirling-type two-stage pulse tube cryocooler system for neon recondensation near 25 K. In order to avoid problems with streaming instabilities in regenerators with large cross-section area, the system design is based on four smaller PTC cold heads to be operated in parallel on a single linear compressor. From experiments on one of the PTC cold heads in combination with a 10 kW-class compressor it is shown that the two-stage design successfully suppresses the onset of internal regenerator streaming. It is also confirmed by the measurements that a solely “enthalpy-coupled” configuration of the stages without cold heat exchanger at the first stage is feasible, thereby reducing the losses in the first stage.
For matching the compressor to the cold head at 40 Hz operation, a 6 m long transfer line has been used that amplifies the pressure amplitude but also reduces the available pV-power at the cold head to about 62% of that at the compressor. A no-load temperature of 13.7 K and a cooling power of 12.9 W at 25 K have been achieved at an electrical input power of 4.7 kW, which corresponds to 3.9 kW of acoustic power at the compressor and to 2.4 kW of acoustic power at the cold head. The corresponding efficiency at 25 K is 5.6% relative to Carnot and pV-power at the cold head.
The calculated cooling power from simulation amounts to 19 W at 25 K with 3.9 kW as compared to the measured 12.9 W. The lower experimental cooling power can be attributed to a rather large pressure drop in the second stage, as found from a comparison between the measured and calculated pressure amplitudes. It is hoped that in a revised version of the cold head the pressure drop can be reduced and thus the cooling power increased to near 20 W at 25 K.
Then, by using a larger linear compressor, designed for 40 Hz operation and capable of delivering about 10 kW of pV-power, four parallel cold heads should be able to deliver 80 W of cooling power at 25 K for neon recondensation.
Acknowledgement
This work is supported by the German Ministry of Economics and Technology (BMWi) under grant no. 03SX221A. We thank the Siemens AG (Erlangen, Germany) for providing the linear compressor.
References
- [1] Gromoll B, Technical and economical demands on 25 K - 77 K refrigerators for future HTS-series products in power engineering, in: Advances in Cryogenic Engineering, vol. 49, New York: AIP, pp. 1797–1804.
- [2] Frank M, Frauenhofer J, Gromoll B, van Haßelt P, Nick W, Nerowski G, Neumüller HW, Häfner HU, Thummes G, Thermosyphon cooling system for the Siemens 400 kW HTS sychronous machine, in: Advances in Cryogenic Engineering, vol. 49, New York: AIP, pp. 859–866.
- [3] Schwenterly SW, Cole MJ, Demko JA, Pleva EF, Hezelton DW, Design and operating performance of cryocooled helium thermosyphon loops for HTS transformers, in: Advances in Cryogenic Engineering, vol. 49, New York: AIP, pp. 839–848.
- [4] Zia JH, A Pulse Tube Cryocooler with 300W Refrigeration at 80K and an Operating Efficiency of 19% Carnot, in: Cryocoolers 14, pp. 141–147.
- [5] Potratz SA, Nellis FG, Maddocks JR, Kashani A, Hevensteijn BPM, Rhoads GL, Flake B, Stirling-type Pulse Tube Cryocooler with 1kW of Refrigeration at 77 K, in: Advances in Cryogenic Engineering, vol. 53, AIP, pp. 42–48.
- [6] Ercolani E, Poncet J, Charles I, Duband L, Tanchon J, Trollier T, Ravex A, Design and Prototyping of a Large Capacity High Frequency Pulse Tube, Cryogenics , 2008. vol. 48, pp. 439–447.
- [7] Gromoll B, Huber N, Dietrich M, Yang LW, Thummes G, Development of a 25 K pulse tube refrigerator for future HTS-series products in power engineering, in: Advances in Cryogenic Engineering, vol. 51, New York: AIP, pp. 643–652.
- [8] Dietrich M, Yang LW, Thummes G, High-power Stirling-type Pulse Tube Cryocooler: Observation and Reduction of Regenerator Temperature-Inhomogeneities, Cryogenics , May-June 2007. vol. 47(5-6), pp. 306–314.
- [9] Sun DM, Dietrich M, Thummes G, Qiu LM, Investigation on Regenerator Temperature Inhomogeneities in Stirling-type Pulse Tube Cooler, Chinese Science Bulletin , March 2009. vol. 54(6), pp. 986–991.
- [10] So JH, Swift GW, Backhaus S, An Internal Streaming Instability in Regenerators, Journal of the Acoustical Society of America , October 2006. vol. 120(4), pp. 1898–1909.
- [11] Nguyen C, Yerkley A, Culler A, Haberbusch M, Radebaugh R, Hydrogen/Oxygen Propellant Densifier Using a Two-Stage Pulse Tube Cryocooler, Advances in Cryogenic Engineering , 2004. vol. 49, pp. 1703–1709.
- [12] Jiang N, Lindemann U, Giebeler F, Thummes G, A 3He pulse tube cooler operating down to 1.3 K, Cryogenics , November 2004. vol. 44(11), pp. 809–816.
- [13] Tang K, Chen CB, Thummes G, 13K thermal coupled Stirling-type pulse tube cooler, Chinese Science Bulletin , 2005. vol. 50(18), pp. 2046–2048.
- [14] Kittel P, Enthalpy, Entropy, and Exergy Flow Losses in Pulse Tube Cryocoolers, in: Cryocoolers, vol. 13, pp. 343–352.
- [15] Gedeon D, Sage: Object orientated software for stirling-type machine design, in: Proc. of the 29th Intersociety Energy Conversion and Engineering Conference, vol. 4, Monterey CA: American Institute for Aeronautics and Astonautics, 1994. pp. 1902–1907.
- [16] Martin JL, Martin CM, Pulse Tube Cryocoolers for Industrial Applications, in: Advances in Cryogenic Engineering: Proceedings of the Cryogenic Engineering Conference, vol. 47, pp. 662–669.