BLAST05: Power Spectra of Bright Galactic Cirrus at Submillimeter Wavelengths
Abstract
We report multi-wavelength power spectra of diffuse Galactic dust emission from BLAST observations at 250, 350, and 500 µm in Galactic Plane fields in Cygnus X and Aquila. These submillimeter power spectra statistically quantify the self-similar structure observable over a broad range of scales and can be used to assess the cirrus noise which limits the detection of faint point sources. The advent of submillimeter surveys with the Herschel Space Observatory makes the wavelength dependence a matter of interest. We show that the observed relative amplitudes of the power spectra can be related through a spectral energy distribution (SED). Fitting a simple modified black body to this SED, we find the dust temperature in Cygnus X to be K and in the Aquila region K. Our empirical estimates provide important new insight into the substantial cirrus noise that will be encountered in forthcoming observations.
Subject headings:
submillimeter — ISM: clouds, cirrus — balloons1. Introduction
Energy is being injected continually into the interstellar medium (ISM) through spiral shocks, violent outflows from massive protostars, stellar winds, expanding H II regions and supernova explosions. The result is a turbulent medium where the dust is well mixed in the structures produced. The emission from the relatively nearby ISM at high Galactic latitude is known as Galactic Cirrus. Cirrus-like structure in the brighter emission near the Galactic Plane has been called ‘interstellar froth’ (Waller & Boulanger, 1994); this might be an interesting distinction with a physical basis, but here we will simply use the term ‘cirrus’. The dynamics of the ISM appear to have made the distribution of density structures self-similar, with fluctuations in column density and surface brightness present on all observable scales, though decreasing towards smaller scales. Statistical description of random fluctuations through structure functions is an important method of extracting physical properties hidden in diffuse emission as well as for providing a quantitative measure to compare with simulations. A common statistical tool used to estimate the level of cirrus noise is the power spectrum. This is valid for Gaussian random fields. However, Gautier et al. (1992) found evidence for non-Gaussianity and recent studies by Miville-Deschênes et al. (2007) have revealed non-vanishing skewness and excess kurtosis in the underlying brightness fluctuation fields. Nevertheless, for estimating the variance the power spectrum is still indicative.
Using power spectra, Gautier et al. (1992) quantified how fluctuations associated with Galactic cirrus are a source of confusion noise which limits the detectability of point sources. Even with the improved angular resolution of imagers like SPIRE and PACS on the Herschel Space Observatory111http://www.esa.int/SPECIALS/Herschel/index.html (hereafter Herschel), this ‘cirrus noise’ remains important, often dominant. Therefore, to assess the noise it is vital to know the statistical properties of the interstellar diffuse emission at the relevant wavelengths.
A number of other statistical analyses of emission have been carried out on the basis of power spectra for high latitude clouds, e.g., by Kiss et al. (2003), Jeong et al. (2005), and Miville-Deschênes et al. (2007). In this paper we analyse diffuse dust emission in the Galactic Plane and present for the first time multi-wavelength power spectra in the submillimeter, based on observations in Cygnus X (Cyg X) and Aquila with BLAST (Pascale et al., 2008) at 250, 350, and 500 µm. We also analyse the same regions at 100 and 60 µm using IRIS, IRAS data reprocessed by Miville-Deschênes & Lagache (2005). Compared to high latitude studies, analysing diffuse emission in the Galactic Plane in terms of the structure of the ISM resulting from its turbulent properties is more challenging because of the long path lengths, high column density, high star-formation rate, and contamination by compact sources. In addition, in the Galactic Plane, self-gravity can play an important role in shaping diffuse structures at smaller scales. Of particular importance are the potentially strong spatial variations of the radiation field due to star formation activity. As discussed further in § 6.1, this could produce variations in the dust emission independently of any changes in structure of the ISM.
Our paper is organized as follows. We begin with a brief description of BLAST observations (§ 2) and then introduce important aspects of the power spectrum and accompanying cirrus noise (§ 3). We analyse IRIS data in § 4, placing this in the context of earlier studies and providing a short-wavelength reference for our submillimeter studies. In § 5 we examine the BLAST data: the noise; effect of the point spread function (PSF) or beam; removal of compact sources; and the exponents and amplitudes of the submillimeter power spectra. We estimate the cirrus noise for these maps and compare it with the completeness depth of the BLAST05 point-source catalogs at 250 µm. In § 5.6 we also discuss some implications for related approved observations with Herschel. We show in § 6 how the observed wavelength dependence of the amplitude of the power spectrum can be understood as a straightforward consequence of the spectral energy distribution (SED) of the dust and we fit a simple modified black body to estimate the dust temperature. Our empirical results provide new insight into what cirrus noise might be expected in submillimeter observations.
2. Observations
In 2005, the Balloon-borne Large Aperture Submillimeter Telescope (BLAST05; Pascale et al., 2008) made unbiased surveys in targeted regions of the Galactic Plane. Chapin et al. (2008) analysed a 4 deg2 field in Vulpecula and here we used data from the two largest surveys. Aquila (Rivera-Ingraham et al., in preparation) is a 6 deg2 region observed for 6.1 h, while Cyg X (Roy et al., in preparation) covers 10 deg2 observed over 10.6 h. Both have good cross-linking from orthogonal scanning. The maps were made with the SANEPIC algorithm (Patanchon et al., 2008) and were calibrated using the procedure discussed in Truch et al. (2008).
Although a 2-m telescope, BLAST05 produced maps of only ′ resolution (see § 5.2) due to an anomalous PSF, corrupted by some uncharacterized combination of mirror distortion and de-focus (Truch et al., 2008).222This problem was fixed for the 2006 flight from Antartica (Truch et al., 2009). Nevertheless, maps from the 2005 flight have high signal-to-noise and are oversampled with 15″ pixels, so that Lucy-Richardson (L-R) deconvolution can be used to improve the resolution significantly (Roy et al., in preparation). This goal is particularly important for extracting point sources (§ 5.3) but otherwise not essential for the study of diffuse emission. We analysed the two largest surveys, selecting in Aquila a square sub-field of size ∘ centred on ∘, ∘ and a similar-sized field in Cyg X centred on ∘, ∘. The latter does not include the brighter star-forming regions to the east containing W75-N and DR21 (Schneider et al., 2006).
3. Power Spectrum and Cirrus Noise
The power spectrum is the Fourier transform of the auto-correlation function of the intensity map . In -space, is simply related to an image by
| (1) |
where is the Fourier transform of the image and its complex conjugate. We used the IDL routine FFT to compute the two-dimensional Fourier transforms. To ensure a smooth periodic boundary condition near the edges (Miville-Deschênes et al., 2002), the maps were apodized by a sine function over a range 10% the width of the map. The power spectrum is obtained by averaging over an annulus placed at .
In practice, contributions to the total power spectrum come not only from diffuse dust emission, but also point sources, the cosmic infrared background (CIB), and the noise. When these components are statistically uncorrelated, the total power spectrum can be expressed as (Miville-Deschênes et al., 2007)
| (2) |
where is the power spectrum of the PSF (the square of the modulus of the two-dimensional Fourier transform of the PSF), which decays at large . For the bright Galactic Plane fields targeted here, the contribution from the CIB to the power spectrum is negligible. While the noise is measurable (§ 5.5), it too makes an insignificant contribution.
Gautier et al. (1992), followed by many other authors (Kiss et al., 2001, 2003; Miville-Deschênes et al., 2002), have shown that the power spectrum of Galactic cirrus follows a power law
| (3) |
quantified by an amplitude at some fiducial and an exponent that is typically (Miville-Deschênes et al., 2007). From their analysis, the associated ‘cirrus noise’ for a telescope with mirror diameter working at wavelength can be quantified as
| (4) |
Here our assumptions about the measurement strategy for point sources are the same as made by Helou & Beichman (1990) and adopted by Kiss et al. (2001), which in the notation of Gautier et al. (1992) are a measuring aperture , with ‘resolution ratio’ of and a reference annulus with ‘separation ratio’ 2, and also , close to what we find below. The beam-related factor quantifies the effect of a smaller beam probing smaller spatial scales where the power in the fluctuations is weaker.
If the sources being measured are extended, as will be the case in many Galactic surveys, then the measuring aperture needs to be larger. The main consequence of this on increasing is captured by the factor for the range of interest (see also Fig. 3 in Gautier et al., 1992).
Working with 100 µm IRAS data on fields of different average surface brightness , and adopting a fiducial scale at which the amplitude is , Gautier et al. (1992) found the trend that , where is a proportionality constant. If this is substituted in the above, we recover the formula given by Helou & Beichman (1990) and evaluated by Kiss et al. (2001) estimating the cirrus noise for different levels of cirrus brightness. Note that the cirrus noise estimate described by Miville-Deschênes et al. (2007) used a slightly different definition of the noise, as well as incorporating a trend giving a slightly steeper power law with increasing , and in effect a lower , which together conspire to lower the noise estimate by about a factor six for bright cirrus.
For reasons discussed below, both estimating from and scaling it to the appropriate wavelength of observation are problematical. Therefore, if possible the exponent and amplitude of should be measured directly for the field of interest at the relevant wavelength. Measuring and normalizing at a scale as close as possible to the beam also avoids issues of extrapolation. With Herschel in mind, we have chosen . The normalization of the amplitude in equation (4) anticipates what we find at 250 µm for the two bright fields we examined.
4. IRIS Power Spectra
Our primary goals are to analyse statistical fluctuations of diffuse dust emission in the Galactic Plane using the power spectrum, and to measure the wavelength dependence of the amplitude of this power spectrum. To connect with previous work and provide a reference at shorter wavelengths, we begin with IRIS. IRIS (like IRAS) data come in ‘plates’ 12.5∘ on a side. We computed the power spectrum for the entire plate containing the Aquila field (plate 263) but because of a gap in the IRAS sky coverage near Cyg X (plate 361) we had to settle for a smaller region, 6∘ on a side in Galactic coordinates centred on ∘ and ∘. Binned estimates of and their uncertainties were evaluated as in § 5.4.
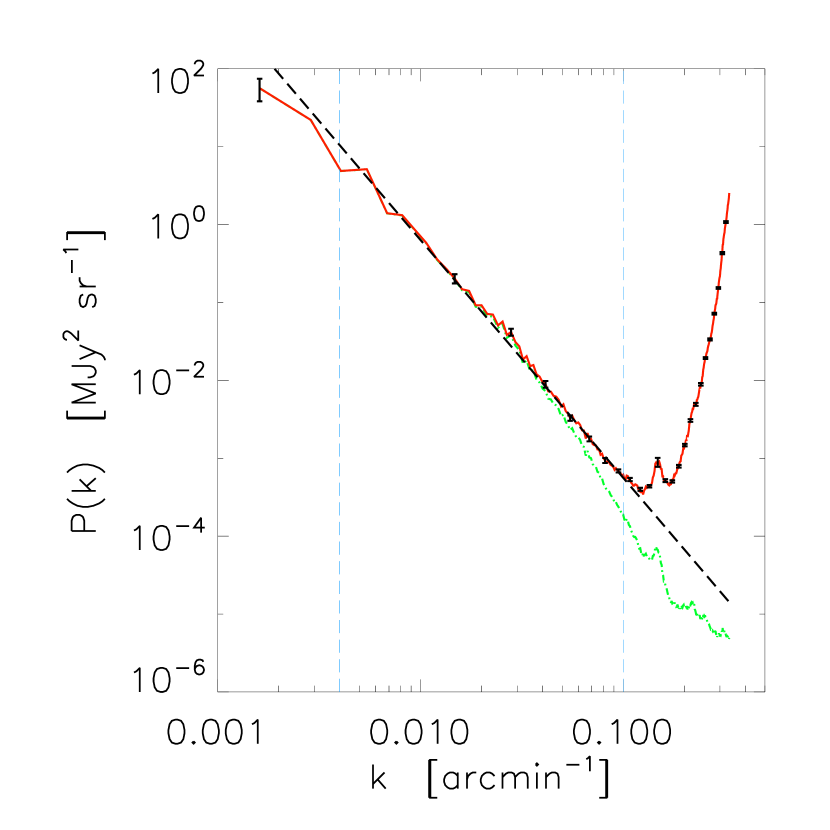
The power spectrum for the Aquila field at 100 µm is shown in Figure 1; the power spectrum for the Cyg X field (not shown) is similar. The noise, , can be estimated by comparing different independent IRAS maps (HCONs; Miville-Deschênes et al., 2002)and for these bright fields is negligibly small. The behavior of is very much like that seen at higher latitudes and with BLAST (§ 5.5), except that here it does not fall off at the highest quite as fast as expected from the effect of the beam (Miville-Deschênes et al., 2002). We have examined a number of plates crossing the Galactic Plane as well as the adjacent plates at higher latitude and conclude that this is an effect seen only in the Plane. Apparently in these source-removed maps there are significantly larger fluctuations within the scale of the beam than expected, and subsequently these are greatly amplified by the beam correction. These fluctuations are likely an artifact of the source removal technique, which would be maximized in the Galactic Plane, where the surface density of sources is greatest. For the beam we used a Gaussian as specified by Miville-Deschênes et al. (2002) which is clearly just an approximation to the complicated effective beam of the images formed from the IRAS timestreams. In any case, here we use only the part of the power spectrum at lower , which is largely unaffected by the beam correction. We also avoid small values of where the power is significantly affected by the apodization of the image edges (Miville-Deschênes et al., 2002). Figure 1 confirms empirically that this is a good choice for the range of used for the power law fit. The non-linear weighted fits were carried out with the IDL routine.
For 100 µm we find an exponent of in Cyg X and in Aquila. Miville-Deschênes et al. (2007) find that the steepness of the power spectrum increases as a slow function of . For the two fields is 260 and 120 , respectively, and the expected exponents from this trend are and , slightly steeper than what we find. Note however that they find a scatter of 0.3 about their trend. Note also that while we report the formal errors from the fit to the power spectrum, systematic errors in the derived exponent could be larger, on the order of 0.1.
We find = and for Cyg X and Aquila, respectively. These can be compared to values of 4.3 and 0.59 from the trend in Miville-Deschênes et al. (2007), about which there is a factor of three scatter at high . Again the agreement is better for the Aquila field, despite the fact that there are significant asymmetries in the image (the bright swath of the Galactic Plane and residual striping) which make the two-dimensional power spectrum not quite circularly symmetric.
For more direct comparison with the BLAST power spectra, we computed the IRIS power spectra for the smaller BLAST sub-fields. The exponents of the power spectra are and , respectively. These are harder to measure, given the smaller dynamic range, but do not appear to have changed significantly despite the larger values ( and ). Expressing amplitudes as (though is beyond our range in these small sub-fields), we find and , respectively, compared to trend values of 29 and 13 . Because of the dependence in equation (4), predictions of cirrus noise depend less strongly on any deviations from the trends. Nevertheless, these results illustrate the important point that when attempting to assess the cirrus noise, one should, if possible, measure the exponent and amplitude near the spatial frequencies of interest.
Because the cirrus noise is wavelength dependent, ideally would be measured at each relevant wavelength too. The amplitude might in principle be scaled, say from . Not all scaling prescriptions in the literature can be valid, however, and we discuss our recommendation in § 6.
5. BLAST Power Spectra
5.1. Noise Power Spectrum
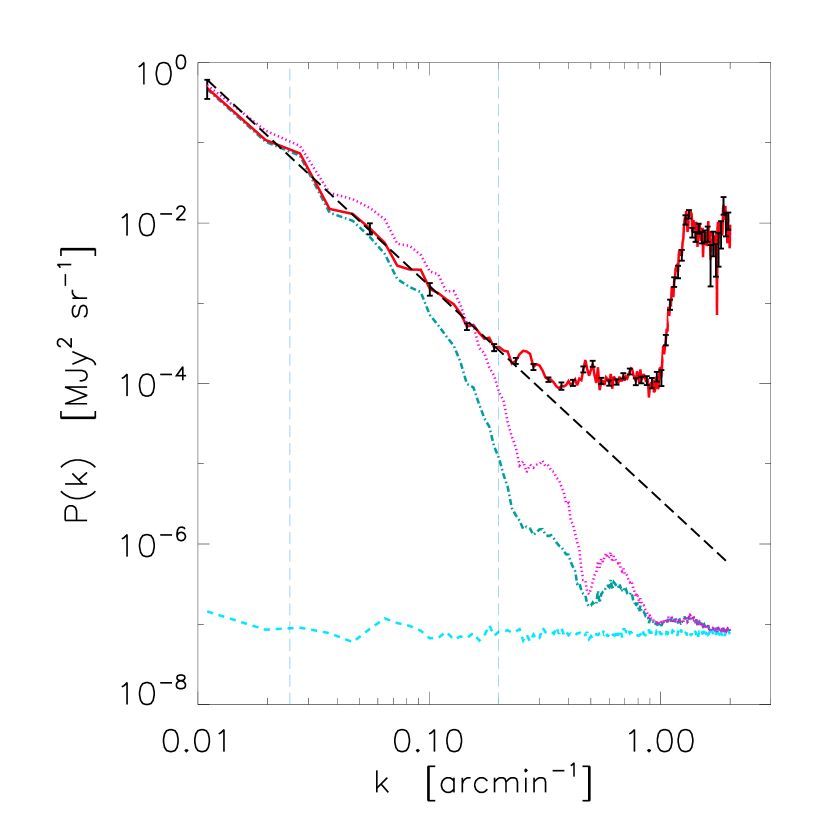
In the BLAST map-making procedure (Patanchon et al., 2008), a variance map is produced based on the noise in the time-stream data and the map coverage by the bolometers in the arrays. For these BLAST surveys, the resulting maps of are quite uniform. A realization of the noise map can be constructed for each independent, uncorrelated pixel from where is a Gaussian random variable with unit standard deviation and zero mean. Given the relative uniformity of the variance map, the resulting simulated noise map is close to white on all scales and thus the power spectrum of this noise is quite flat (see the example for Cyg X at 250 µm in Fig. 2). At large the total power spectrum decays to this noise level, because of the combined effects of the decreasing power in the diffuse cirrus emission and the PSF. There is also a component of low frequency noise in the map arising from the very long time scale noise present in the time streams. However, in cross-linked maps produced using data from multiple scanning directions this is greatly reduced by the SANEPIC algorithm (e.g., Fig. 10 in Patanchon et al., 2008) and is not important here because the cirrus signal at small is so large.
5.2. Effect of the Beam
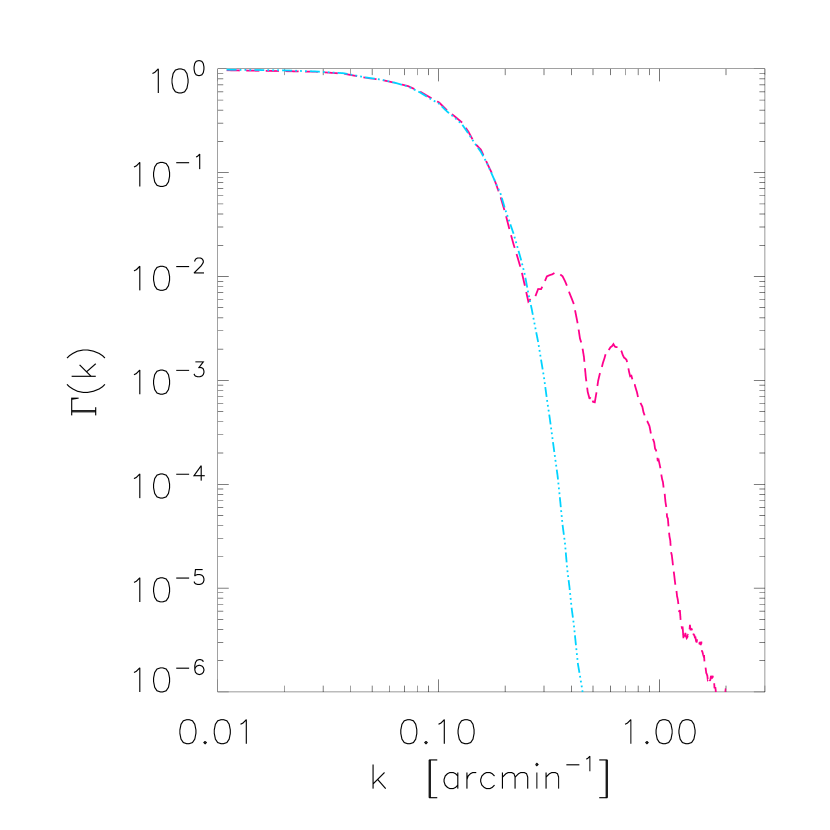
The BLAST05 PSF in telescope coordinates is shown in Truch et al. (2008). A synthetic beam can be made for a particular map, taking into account the scan angles and coverage (Chapin et al., 2008). Because this synthetic beam is not known out to the full size of the map, we have not derived its power spectrum directly. Instead, we convolved the noise map with the PSF directly, found the power spectrum of that map, and divided by the power spectrum of the noise map. Figure 3 shows for the BLAST05 PSF at 250 µm for the Cyg X field. This has a number of features characterizing scales seen in the corrupted PSF. Clearly, the observed will be seriously suppressed at high and so we will use data only for . At these scales, where the beam correction is not too large and so both more reliable and of less import, can be described by a Gaussian with . Using the Fourier relation , this corresponds to a Gaussian beam of ′, or FWHM ′, slightly smaller than for IRIS. This is close to the 3.1′ full width at half-power found by Truch et al. (2008). The corruption of the BLAST05 PSF is such that the initial falloff in is rather similar for the three wavelengths, and for both fields.
5.3. Source Removal
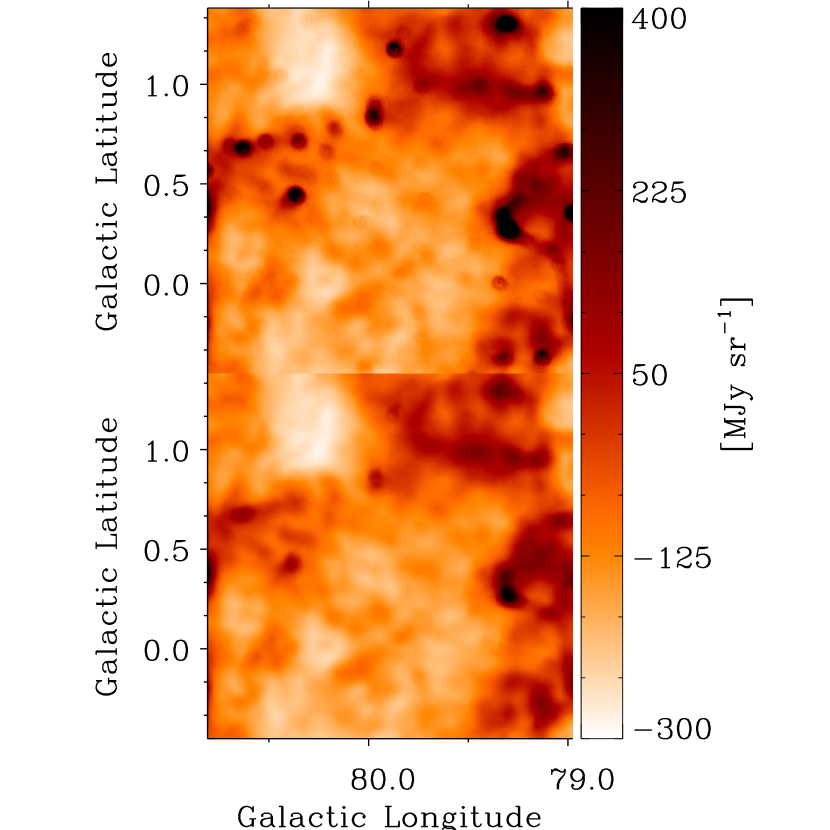
In the Galactic Plane, the power spectrum is seriously contaminated by compact sources. To remove them, we first deconvolve the BLAST maps using the L-R method which, importantly, conserves flux. Compact sources are of size ′ in these maps and more easily identified. They are fairly well described by Gaussians. We fit Gaussians (multiple if crowded) to obtain flux densities, positions, and FWHM (major axes and position angle) of the compact sources. We then convolve these Gaussians with the synthetic beam and subtract them from the original maps. For the Cyg X sub-field analysed, the upper and lower panels of Figure 4 show BLAST maps at 250 µm before and after source removal, respectively. Faint residuals appear near some of the brightest sources, because of multiscale structure in the ISM in which they are embedded.
5.4. Two-dimensional Power Spectrum
Figure 5 shows the two-dimensional power spectrum for the Cyg X region at 250 µm. Because produces a large intrinsic dynamic range in the power spectrum, we have multiplied it by , with . The dark rings are produced by the same features giving the dips in . Noise is being amplified at large because of the multiplier.
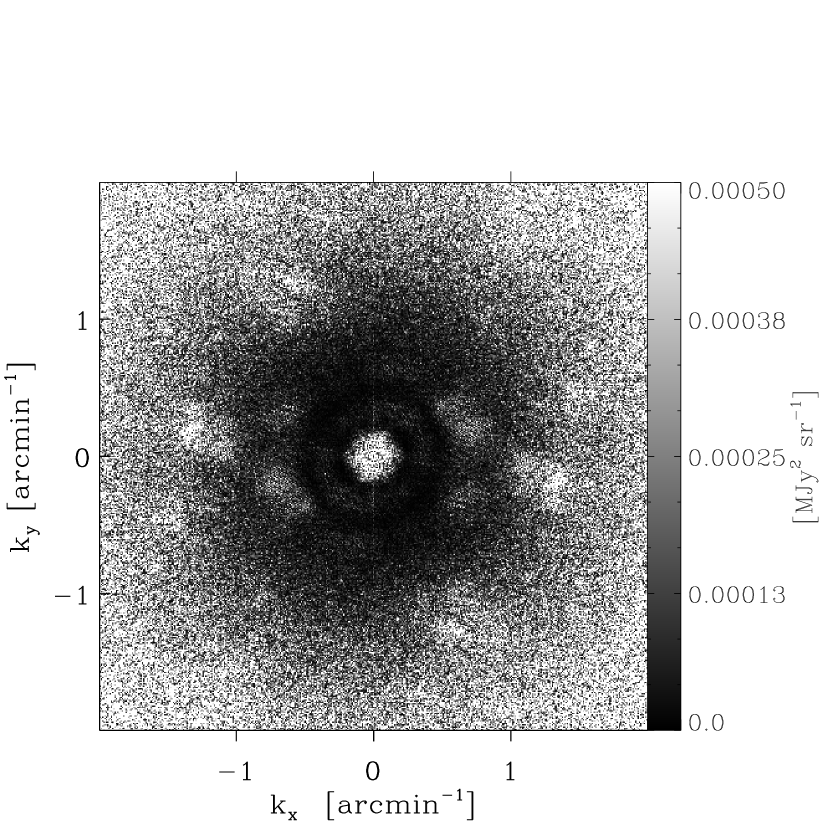
The two-dimensional power spectrum is circularly symmetric, justifying the annular averaging to find the mean . Most of the information relevant to the diffuse emission is contained in the plateau in the central region of Figure 5, and the average there in this representation is close to .
The error in for each annulus is the standard error of the mean. While removing the effect of beam from the power spectrum, we have only scaled this error by the inverse beam, not accounting for the fact that its shape is not perfectly known at high . However, this is of no consequence because we do not fit the data at large where the beam correction is significant.
5.5. Exponent and Amplitude
Figure 2 shows for 250 µm for the Cyg X region, for the original map and with sources removed. The effect of the beam is dramatic at high , showing that it is important to have a good estimate of the PSF. There is also clearly excess power due to sources and so it is important to remove them carefully.
At small , the power spectrum is dominated by the dust structures; it decays toward higher , as seen previously in IRIS data at shorter wavelengths. The oscillatory effect of can be seen clearly at and at higher the power spectrum meets the independently-predicted noise level shown.
, obtained by dividing the source-removed, noise-subtracted power spectrum by , is also shown in Figure 2. It appears to have a power-law form over the limited dynamic range in available. We fit only over the range , restricted for the reasons discussed in § 4. In particular, at large the effect of correcting for the PSF is very large. The synthetic PSF is an average for the entire observed field and so is imperfectly modeled to the precision that would be required for precise compensation at high . Convincing evidence for any deviation from a power law for the higher range will have to await the higher resolution observations anticipated with Herschel which will probe to beyond . At smaller the observed power spectrum is affected both by apodization and by the effective filtering of the map-making procedure, such that the largest scales are not recovered. For the relatively small size of these maps and the characteristics of these BLAST05 observations these effects set in at about the same (Patanchon et al., 2008). In earlier work with IRAS, the amplitude is often cited for . This fiducial value is below the range of our observations. Using would seem preferable and probably more relevant to small maps at higher resolution to be made with Herschel.
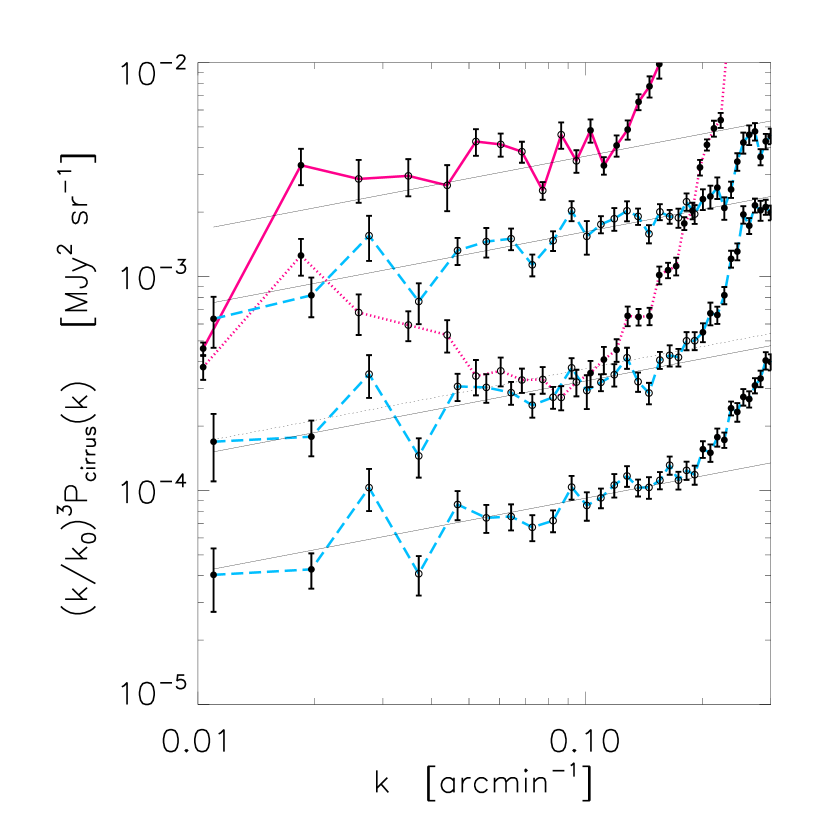
Figure 6 shows for all three BLAST bands (250, 350, and 500 µm) for Cyg X. We find at 250 µm. increases with decreasing wavelength for the BLAST bands and for the IRIS bands (§ 4) remains about the same at 100 µm and then decreases at 60 µm. We obtain an exponent equal to at 250 µm. This can be compared with the value found above at 100 µm, . The exponents are quite similar for all bands, except for 60 µm which is discussed further in § 6.1. If the power spectrum were less steep moving into the submillimeter, this would provide important evidence for a change in the statistical properties of the emission and the underlying mass column density and temperature distribution (§ 6.1). Definitive searches for such wavelength dependence should benefit from the higher spatial dynamic range anticipated in observations with Herschel.
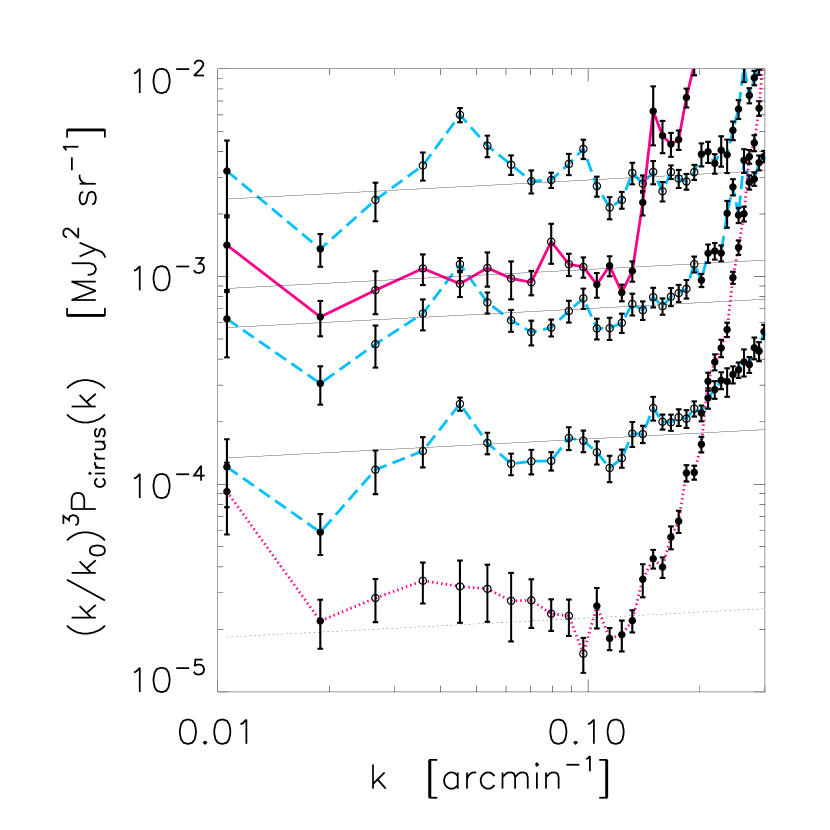
Figure 7 presents the results from our analysis of the Aquila field. Overall the same behavior is seen, though the exponent appears to be slightly steeper () at 250 µm, at 250 µm is larger, , and the relative amplitudes at the IRIS bands are much lower.
5.6. Catalog Depth
Equation (4) can be used to predict the depth reached in a compact source catalog. To apply this to the BLAST05 Cyg X survey, (where the compact sources are of apparent size ′ in the L-R maps in which they are detected and measured), the appropriate is . With and for the somewhat dimmer part of the survey field examined here, at 250 µm. This compares well to the empirically-estimated 3- detection threshold of (Roy et al., in preparation). The effective noise near bright sources can be somewhat higher because of contaminating artifacts produced in the L-R deconvolution.
For the large survey of Vela carried out by BLAST in 2006, where the beam of the 1.8 m mirror was diffraction limited (Netterfield et al., 2009), we have not measured directly, because the region was not covered by orthogonal scanning and so the cirrus structure is not well constrained over all scales in the cross-scan direction (Patanchon et al., 2008). Nevertheless, following the scaling suggested in § 6, we can estimate from and K, giving at 250 µm, from which . However, the sources were actually extended, with typical apparent sizes of 1′, so that , and then . For comparison, the catalog depth judged from simulations of completeness was 6 Jy (Netterfield et al., 2009). We conclude that the depth is dominated by the influence of the cirrus noise.
With Herschel and assuming the source sizes are compatible with , in the Cyg X region should be closer to 100 mJy at 250 µm. While a distinct improvement, this is nevertheless substantial compared to the instrument noise (r.m.s. 5 mJy) predicted using HSPOT333http://www.ipac.caltech.edu/Herschel/hspot.shtml for the planned parallel PACS-SPIRE map scanning strategy in the guaranteed-time key project HOBYS444http://starformation-herschel.iap.fr/hobys/ (Herschel imaging survey of OB Young Stellar objects). We expect substantial regional variations. For example, in Aquila, simply from the larger the depth achieved should be 1.4 times worse. And this is not even the brightest part of the Galactic Plane to be surveyed in the open-time key project Hi-GAL555https://hi-gal.ifsi-roma.inaf.it/higal (Herschel infrared Galactic plane survey).
Extraction of sources with wavelength-dependent and multi-scale structure will be especially problematical and it will be necessary both to measure the cirrus properties and to simulate its effects. For SPIRE maps, in particular those made with the parallel PACS-SPIRE mode, a corollary is that the high signal-to-noise ratio resulting from the redundant coverage is well suited to studying the statistical properties of the bright cirrus. Of particular interest is how the power spectrum varies with wavelength, which can be used to determine physical properties of the diffuse dust.
6. Wavelength Dependence
6.1. Mass Column Density Distribution
BLAST and IRAS maps record surface brightness which, in turn, depends on the dust mass column density :
| (5) |
where is the dust emissivity, is the Planck function for dust temperature and it is understood that the right-hand side is summed over various dust components which might have different and .
The underlying spatial property being probed is which is in turn the projection of the three-dimensional density distribution. is modulated as a function of frequency by the emissivity and temperature, and can also have modulations caused by spatial differences in these properties. The ISM in the Galactic Plane is far from homogeneous, containing diffuse atomic and ionized regions and shielded molecular regions with possibly different mixes of dust compositions and sizes, and along any line of sight there will be a range of interstellar radiation field intensities, all of which could affect . The surface brightness is particularly sensitive to for frequencies near or above the peak in the SED, i.e., for 100 µm and shorter for typical interstellar diffuse dust temperatures. Therefore, it is somewhat surprising that the power spectra exponents that we obtained are so similar. The potential for wavelength dependence should be particularly high at 60 µm where non-equilibrium emission from very small grains (VSGs) starts to become important (Desert et al., 1990; Li & Draine, 2001) and is even more directly responsive to the ultraviolet radiation field. The Cyg X field analysed definitely has different spatial structures appearing in the images at the shorter wavelengths and there is some evidence in Figure 6 for an effect on the exponent of the power spectrum. Furthermore, the exponent for a particular region must depend, through the structure of , on the environments probed along the line of sight and the energy injection at large scales that is responsible for the apparent turbulence in the ISM.
In the simple case of homogeneous correlation in the ISM, everywhere in the map would scale with frequency according to the simple relative spectral energy distribution of the emitting dust. From equation (5), . Therefore, , measuring the same structure in , would scale simply as (see eq. [1]) while would scale as (see eq. [4]). This scaling is what is assumed by the prescriptions of Lagache & Puget (2000) and Miville-Deschênes et al. (2007), for example, and appreciated by Jeong et al. (2005). However, on making the substitution , Helou & Beichman (1990) end up assuming that scales as and thus scales as . Kiss et al. (2001) find some empirical support for the latter over the ISO ISOPHOT wavelength range.
Note that the wavelength dependence of the signal-to-noise ratio of a point source will vary by the factor from equation (4), and also the ratio of the SED of the source relative to that of the confusing cirrus. At submillimeter wavelengths, the situation is more favorable for detecting cold sources in warm cirrus than vice versa. Therefore, the completeness depth of a survey as a function of wavelength will depend on these factors. Source size and structure can also change with wavelength (Netterfield et al., 2009) but we will not dwell on this quantitatively here.
6.2. Characteristic Temperature
The similarity in the exponents of the power spectra as a function of wavelength is no guarantee of underlying homogeneous conditions. Nevertheless, we can assume that there is some characteristic SED for each region, and use the relative frequency dependence of to recover it. To be consistent with this picture , we evaluated using a common exponent, which is simply the average of the exponents found at each wavelength (excluding 60 µm). This relative SED is shown in Figure 8 for each region.


Fitting this relative SED with a modified black body (eq. [5]) yields a characteristic dust temperature. We have assumed with (Hildebrand, 1983). We did not include the 60 µm data, because the excess there, presumed to be from non-equilibrium emission, would be inconsistent with a simple single-temperature modified black body. For Cyg X, the increase at long wavelengths with respect to the fit is probably the result of the range of temperatures known to be present in different parts of this region (Roy et al., in preparation). Therefore, even in this case we kept , although empirically would produce a better fit.
For Cyg X, the best fit temperature is K, which appears to be slightly warmer than the local high latitude diffuse medium dust temperature of 17.5 K (Boulanger et al., 1996). Finding warmer dust in Cyg X is not particularly surprising, because this region, which lies along the local spiral feature (∘), is one of active star formation, with an OB association and numerous HII regions. In the 21-cm radio continuum this region includes areas of strong diffuse thermal emission. To account for the higher equilibrium temperature the ambient radiation field absorbed in Cyg X would have to be about times higher than locally.
By contrast, for Aquila the characteristic temperature derived is somewhat lower, about K. This line of sight passes through the inner Galaxy (∘), with significant molecular clouds but much less star formation (Rivera-Ingraham et al., in preparation).
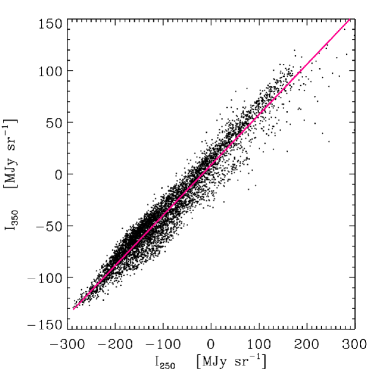
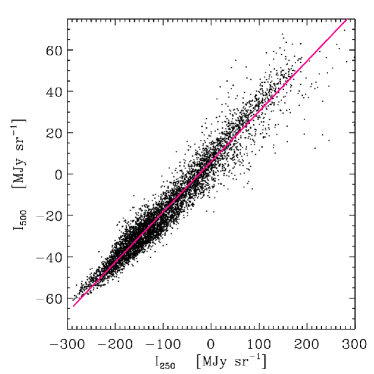
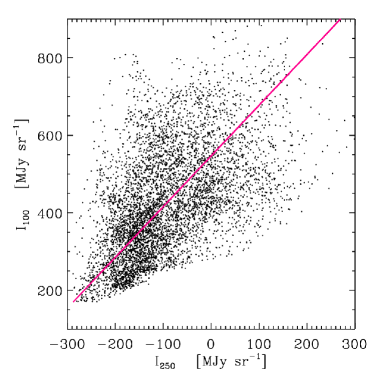

As we have noted, under uniform conditions, maps at different wavelengths will have to be highly correlated in their spatial structures, and so they will have the same power spectrum scaled by . But the fact that the relative SED derived from appears reasonable is no guarantee that the maps are simply scaled versions of one another (since phases could be different). However, this can be checked directly. Inspection of the BLAST maps shows that they are remarkably similar in all three bands. This is quantified through the correlations with respect to the 250 µm map shown in Figure 9 for Cyg X. The linear fits shown are the ordinary least squares bisector solution (Isobe et al., 1990) obtained with the IDL routine SIXLIN. Note that the correlation of BLAST 250 µm with IRIS 100 µm is not as high as it is between BLAST bands. This is expected, because of the above-mentioned greater sensitivity of 100 µm emission to . Differences with respect to the submillimeter images become more apparent at 60 µm, where in addition the power spectrum is found to be somewhat steeper (Fig. 6). Figure 10 shows the even better correlations for the Aquila region. A clue to understanding the good correlation is, of course, the very detailed similarity of the power spectra at the different wavelengths.
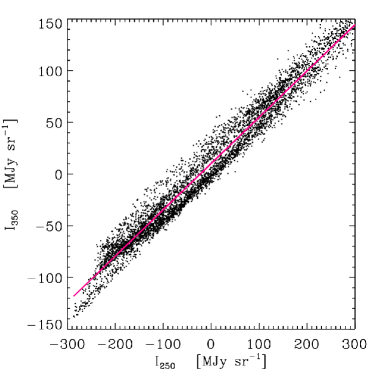
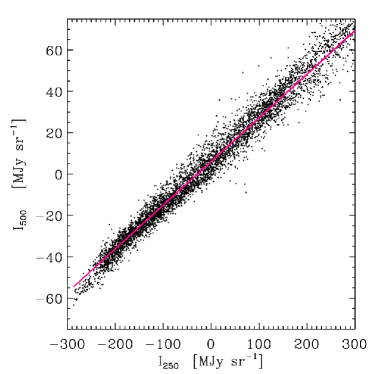
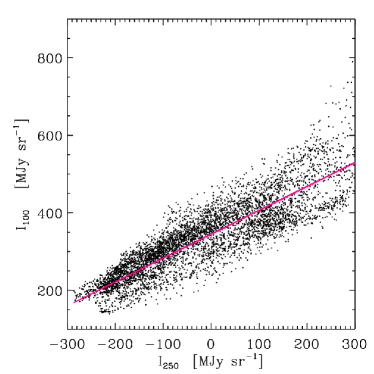

As a consistency check, the slopes of the correlations can be used to construct another relative SED. As seen in Figures 9 and 10, these look very similar to the respective SEDs based on the power spectra (Fig. 8) and the best-fit temperatures K and K are very similar to those found above.
We therefore have some evidence that the appropriate scaling of is as , not . However, this is not immediately generally useful, unless there is some independent evidence about the frequency dependence of (or the effective and ), since this can clearly vary significantly from region to region. The best approach is to measure directly at each wavelength.
7. Conclusion
In these fields in the Galactic Plane, the exponent of the power spectrum of the 100 µm IRIS map is close to , within the dispersion seen by Miville-Deschênes et al. (2007) despite the average brightness being beyond the range studied by these authors. On the other hand, the amplitudes of the 100 µm power spectra estimated for these bright ∘ ∘ fields are significantly below what would be extrapolated from the trend with found by Miville-Deschênes et al. (2007). Therefore, particularly in such bright star forming regions, it is recommended that the power spectrum be computed directly. The power spectra derived from the BLAST observations are also well fit by power laws, with similar exponents. The frequency dependence of the amplitude of the power spectrum can be described by the square of an SED which is a simple modified black body function with a reasonable characteristic temperature. This is confirmed by direct correlations between the maps at different wavelengths. However, this characteristic temperature does appear to change in different Galactic environments, and unless its value is known independently the power spectra and/or map correlations need to be evaluated for all wavelengths.
Cirrus noise will be important in many planned multi-wavelength Galactic Plane, high latitude, and extragalactic surveys carried out with Herschel. Our results provide important empirical support for a proposed prescription for the wavelength dependence of the cirrus noise, which incorporates a factor which varies directly as the SED. In practice the noise will be best evaluated, most free of assumptions, simply by measuring at each wavelength and using equation (4).
References
- Boulanger et al. (1996) Boulanger, F., Abergel, A., Bernard, J.-P., Burton, W. B., Desert, F.-X., Hartmann, D., Lagache, G., & Puget, J.-L. 1996, A&A, 312, 256
- Chapin et al. (2008) Chapin, E. L., Ade, P. A. R., Bock, J. J., Brunt, C., Devlin, M. J., Dicker, S., Griffin, M., Gundersen, J. O., Halpern, M., Hargrave, P. C., Hughes, D. H., Klein, J., Marsden, G., Martin, P. G., Mauskopf, P., Netterfield, C. B., Olmi, L., Pascale, E., Patanchon, G., Rex, M., Scott, D., Semisch, C., Truch, M. D. P., Tucker, C., Tucker, G. S., Viero, M. P., & Wiebe, D. V. 2008, ApJ, 681, 428
- Desert et al. (1990) Desert, F.-X., Boulanger, F., & Puget, J. L. 1990, A&A, 237, 215
- Gautier et al. (1992) Gautier, III, T. N., Boulanger, F., Perault, M., & Puget, J. L. 1992, AJ, 103, 1313
- Helou & Beichman (1990) Helou, G. & Beichman, C. A. 1990, in Liege International Astrophysical Colloquia, Vol. 29, Liege International Astrophysical Colloquia, ed. B. Kaldeich, 117–123
- Hildebrand (1983) Hildebrand, R. H. 1983, QJRAS, 24, 267
- Isobe et al. (1990) Isobe, T., Feigelson, E. D., Akritas, M. G., & Babu, G. J. 1990, ApJ, 364, 104
- Jeong et al. (2005) Jeong, W.-S., Mok Lee, H., Pak, S., Nakagawa, T., Minn Kwon, S., Pearson, C. P., & White, G. J. 2005, MNRAS, 357, 535
- Kiss et al. (2001) Kiss, C., Ábrahám, P., Klaas, U., Juvela, M., & Lemke, D. 2001, A&A, 379, 1161
- Kiss et al. (2003) Kiss, C., Ábrahám, P., Klaas, U., Lemke, D., Héraudeau, P., del Burgo, C., & Herbstmeier, U. 2003, A&A, 399, 177
- Lagache & Puget (2000) Lagache, G. & Puget, J. L. 2000, A&A, 355, 17
- Li & Draine (2001) Li, A. & Draine, B. T. 2001, ApJ, 554, 778
- Miville-Deschênes & Lagache (2005) Miville-Deschênes, M.-A. & Lagache, G. 2005, ApJS, 157, 302
- Miville-Deschênes & Lagache (2006) Miville-Deschênes, M.-A. & Lagache, G. 2006, in Astronomical Society of the Pacific Conference Series, Vol. 357, Astronomical Society of the Pacific Conference Series, ed. L. Armus & W. T. Reach, 167
- Miville-Deschênes et al. (2007) Miville-Deschênes, M.-A., Lagache, G., Boulanger, F., & Puget, J.-L. 2007, A&A, 469, 595
- Miville-Deschênes et al. (2002) Miville-Deschênes, M.-A., Lagache, G., & Puget, J.-L. 2002, A&A, 393, 749
- Netterfield et al. (2009) Netterfield, C. B., Ade, P. A. R., Bock, J. J., Chapin, E. L., Devlin, M. J., Griffin, M., Gundersen, J. O., Halpern, M., Hargrave, P. C., Hughes, D. H., Klein, J., Marsden, G., Martin, P. G., Mauskopf, P., Olmi, L., Pascale, E., Patanchon, G., Rex, M., Roy, A., Scott, D., Semisch, C., Thomas, N., Truch, M. D. P., Tucker, C., Tucker, G. S., Viero, M. P., & Wiebe, D. V. 2009, ApJ, in press
- Pascale et al. (2008) Pascale, E., Ade, P. A. R., Bock, J. J., Chapin, E. L., Chung, J., Devlin, M. J., Dicker, S., Griffin, M., Gundersen, J. O., Halpern, M., Hargrave, P. C., Hughes, D. H., Klein, J., MacTavish, C. J., Marsden, G., Martin, P. G., Martin, T. G., Mauskopf, P., Netterfield, C. B., Olmi, L., Patanchon, G., Rex, M., Scott, D., Semisch, C., Thomas, N., Truch, M. D. P., Tucker, C., Tucker, G. S., Viero, M. P., & Wiebe, D. V. 2008, ApJ, 681, 400
- Patanchon et al. (2008) Patanchon, G., Ade, P. A. R., Bock, J. J., Chapin, E. L., Devlin, M. J., Dicker, S., Griffin, M., Gundersen, J. O., Halpern, M., Hargrave, P. C., Hughes, D. H., Klein, J., Marsden, G., Martin, P. G., Mauskopf, P., Netterfield, C. B., Olmi, L., Pascale, E., Rex, M., Scott, D., Semisch, C., Truch, M. D. P., Tucker, C., Tucker, G. S., Viero, M. P., & Wiebe, D. V. 2008, ApJ, 681, 708
- Schneider et al. (2006) Schneider, N., Bontemps, S., Simon, R., Jakob, H., Motte, F., Miller, M., Kramer, C., & Stutzki, J. 2006, A&A, 458, 855
- Truch et al. (2008) Truch, M. D. P., Ade, P. A. R., Bock, J. J., Chapin, E. L., Devlin, M. J., Dicker, S., Griffin, M., Gundersen, J. O., Halpern, M., Hargrave, P. C., Hughes, D. H., Klein, J., Marsden, G., Martin, P. G., Mauskopf, P., Netterfield, C. B., Olmi, L., Pascale, E., Patanchon, G., Rex, M., Scott, D., Semisch, C., Tucker, C., Tucker, G. S., Viero, M. P., & Wiebe, D. V. 2008, ApJ, 681, 415
- Truch et al. (2009) Truch, M. D. P., Ade, P. A. R., Bock, J. J., Chapin, E. L., Devlin, M. J., Dicker, S. R., Griffin, M., Gundersen, J. O., Halpern, M., Hargrave, P. C., Hughes, D. H., Klein, J., Marsden, G., Martin, P. G., Mauskopf, P., Moncelsi, L., Netterfield, C. B., Olmi, L., Pascale, E., Patanchon, G., Rex, M., Scott, D., Semisch, C., Thomas, N. E., Tucker, C., Tucker, G. S., Viero, M. P., & Wiebe, D. V. 2009, ApJ, in press
- Waller & Boulanger (1994) Waller, W. H. & Boulanger, F. 1994, in Astronomical Society of the Pacific Conference Series, Vol. 58, The First Symposium on the Infrared Cirrus and Diffuse Interstellar Clouds, ed. R. M. Cutri & W. B. Latter, 129