The Dependence of Star Formation Rates on Stellar Mass and Environment at 11affiliation: This paper includes data gathered with the 6.5 meter Magellan Telescopes located at Las Campanas Observatory, Chile. 22affiliation: This work is based on observations made with the Spitzer Space Telescope, which is operated by the Jet Propulsion Laboratory, California Institute of Technology under a contract with NASA. Support for this work was provided by NASA through an award issued by JPL/Caltech. 33affiliation: Based in part on data collected at Subaru Telescope, which is operated by the National Astronomical Observatory of Japan. 44affiliation: Some of the data presented herein were obtained at the W. M. Keck Observatory, which is operated as a scientific partnership among the California Institute of Technology, the University of California and the National Aeronautics and Space Administration. The Observatory was made possible by the generous financial support of the W.M. Keck Foundation.
Abstract
We examine the star formation rates (SFRs) of galaxies in a redshift slice encompassing the cluster RX J0152.7-1357. We used a low-dispersion prism in the Inamori Magellan Areal Camera and Spectrograph (IMACS) to identify galaxies with mag in diverse environments around the cluster out to projected distances of Mpc from the cluster center. We utilize a mass-limited sample ( ) of 330 galaxies that were imaged by Spitzer MIPS at 24 µm to derive SFRs and study the dependence of specific SFR (SSFR) on stellar mass and environment. We find that the SFR and SSFR show a strong decrease with increasing local density, similar to the relation at . Our result contrasts with other work at that find the SFR-density trend to reverse for luminosity-limited samples. These other results appear to be driven by star-formation in lower mass systems ( ). Our results imply that the processes that shut down star-formation are present in groups and other dense regions in the field. Our data also suggest that the lower SFRs of galaxies in higher density environments may reflect a change in the ratio of star-forming to non-star-forming galaxies, rather than a change in SFRs. As a consequence, the SFRs of star-forming galaxies, in environments ranging from small groups to clusters, appear to be similar and largely unaffected by the local processes that truncate star-formation at .
Subject headings:
galaxies: evolution — galaxies: formation — galaxies: clusters: general — galaxies: clusters: individual (RX J0152.7-1357)1. Introduction
Pioneering studies of the impact of environment on galaxy properties have found higher density environments in the local universe to be dominated by elliptical and S0 galaxies (Dressler, 1980). Because of the strong correlation of Hubble type with star formation rate (SFR, Kennicutt, 1998), a correlation between SFR and local galaxy density is expected and has been seen in more recent studies of the local universe (Gómez et al., 2003; Balogh et al., 2004). Kauffmann et al. (2004) examined the SDSS sample of Brinchmann et al. (2004) and found a strong dependence of SFR on local galaxy density and stellar mass at . At a fixed stellar mass, they found the specific SFRs (SSFRs), and therefore SFRs, of galaxies to be lower in higher density environments.
At , the morphology-density relation (MDR) follows a similar trend to that found in the local universe for mass-limited samples (Holden et al., 2007; van der Wel et al., 2007b). In contrast, recent analyses of the field at suggest that the SFR-density trend was the reverse at earlier times, where galaxies at higher densities display higher SFRs than galaxies at lower densities (Elbaz et al., 2007; Cooper et al., 2008).
In this Letter, we explore the SFRs of galaxies in a redshift slice that includes the galaxy cluster RX J0152.7-1357 (hereafter RX J0152-13). Our wide-field spectroscopic survey extends to a projected distance of Mpc from the cluster center, resulting in a large number of galaxies that span a much broader range of environments at this epoch than is found in other work. Our aim is to determine the form of the SSFR/SFR-density relation at and compare to the results discussed above at these redshifts and at .
We assume a cosmology with km s-1 Mpc-1, , and . Stellar masses and SFRs are based on a Chabrier IMF (Chabrier, 2003).
2. Data and Analysis
Galaxies with mag from archival Subaru Suprime-Cam wide-field imaging of RX J0152-13 in were targeted over a FOV with a low-dispersion prism (LDP) in the Inamori Magellan Areal Camera and Spectrograph (IMACS, Dressler et al., 2006) on Magellan-Baade. Redshifts were determined by fitting the LDP spectra and Suprime-Cam broadband photometry with a grid of Bruzual & Charlot (2003, BC03) model templates as described in Patel et al. (2009). The redshift extraction utilized a strong set of priors on the model galaxy templates, therefore we refrained from using any rest-frame quantities from the fitting in order to avoid any biases. We found a total of 1234 galaxies in the cluster redshift interval of . The survey has a high level of completeness (median of for the sample discussed in this work) and is remarkably uniform for different galaxy types (e.g. red/blue, faint/bright) while varying spatially from in the cluster core to at projected clustercentric radii of Mpc. Where required, galaxies were given weights based on a completeness map that is a function of -band magnitude, - color, and sky position. When compared to redshifts derived from higher resolution spectra, the LDP redshifts display a biweight scatter of only in for galaxies in the redshift interval above. The scatter is the same for fainter galaxies ( mag), while red and blue galaxies have a scatter of and , respectively. Thus, the LDP redshift uncertainties lack any significant dependence on the magnitudes and colors probed here, demonstrating their superiority over photometric redshifts that are typically challenged by these systematics.
We used Spitzer MIPS imaging at 24 µm to calculate SFRs. The MIPS imaging covers galaxies in a range of environments. We used the technique employed in van der Wel et al. (2007a) to derive SFRs. At the MIPS detection limit of Jy, we measure a SFR of yr-1 for galaxies at . While SFRs derived from the MIPS data represent the obscured component of star-formation (SF), several authors have found this component to dominate the total SFR, especially for galaxies in the mass range discussed in this paper (Bell et al., 2005; Elbaz et al., 2007). Meanwhile, more recent findings suggest SFRs inferred from the mid-IR may reflect SF activity over longer timescales (12 Gyr, Salim et al., 2009, Kelson & Holden 2009 in prep). Finally, AGN do not appear to contribute significantly to the overall mid-IR luminosity density at these redshifts (Bell et al., 2005) or to the mid-IR luminosity of individual galaxies (Salim et al., 2009).
Stellar masses were computed by fitting our prism spectra and photometry with a suite of BC03 -models at the derived prism redshift. At the redshift of RX J0152-13 (), our sample reaches a limiting mass of (10.3) on the red-sequence. Above this mass limit, our sample consists of 330 galaxies with MIPS imaging.
We compute the local projected galaxy density for each galaxy by measuring the distance to the 7th nearest neighbor with and relative rest-frame velocity km s-1 (i.e. 2% of ).
3. MIPS Stacking
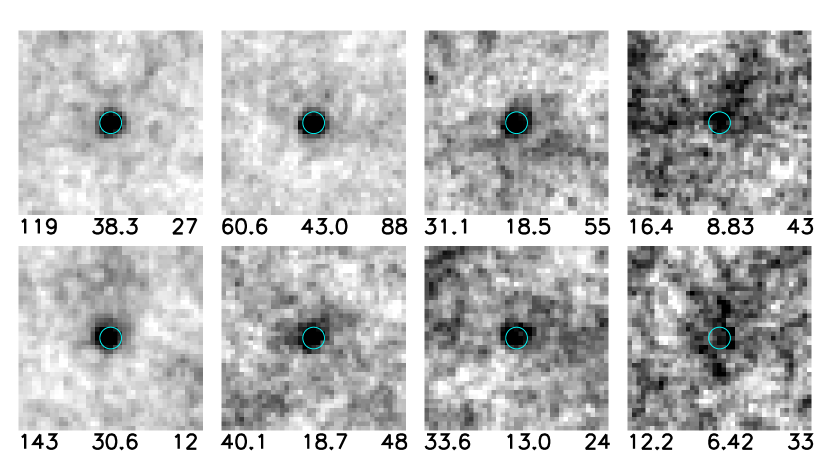
We performed a stacking analysis of our MIPS imaging to determine the median SFRs for sub-samples divided by stellar mass and environment. Most galaxies in higher density environments were not individually detected. Therefore, a stacking analysis for galaxies in all environments allowed us to determine the median SFRs uniformly. All galaxies were included in the stacks, regardless of being detected at 24 µm. We used a bootstrap approach to determine the median SFR and its uncertainty for a stack of images. As a check on this technique, we compared the median flux computed from a stack of detected sources to the median value of the individual fluxes, and found them to agree to within . We used the median of the stack, as opposed to the mean, because it was less susceptible to being influenced by bright contaminating sources.
Figure 1 shows the median image for different mass-density bins. We find a detection for the median stacked galaxy in each bin. Galaxies were stacked in 2 bins of mass above our mass limit, and , and 4 bins of local density that were divided at , 10, and 32 Mpc-2, with the density range of the extreme bins unbounded. We used wide density bins given the large scatter between dark matter halo mass and local projected galaxy density (see e.g. Kauffmann et al., 2004, Fig. 16).
4. Specific Star Formation Rates, Mass, and Environment
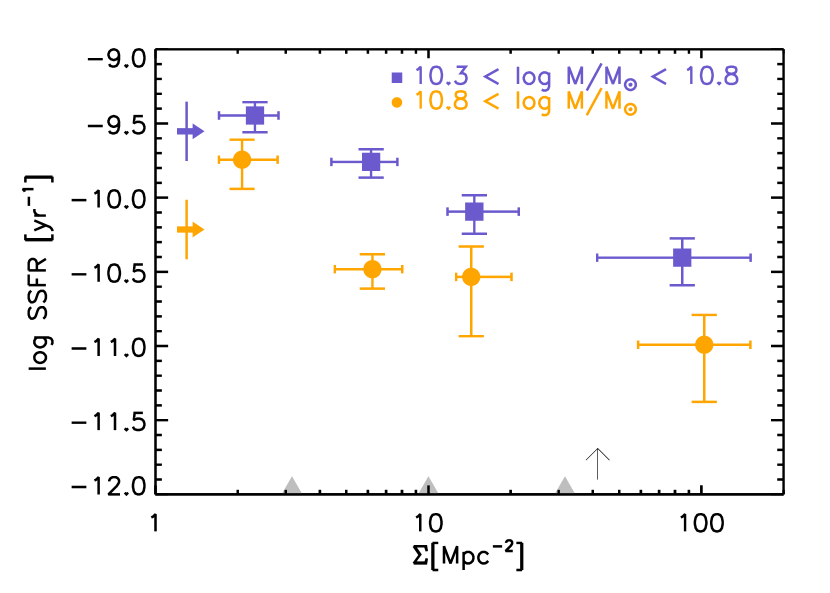
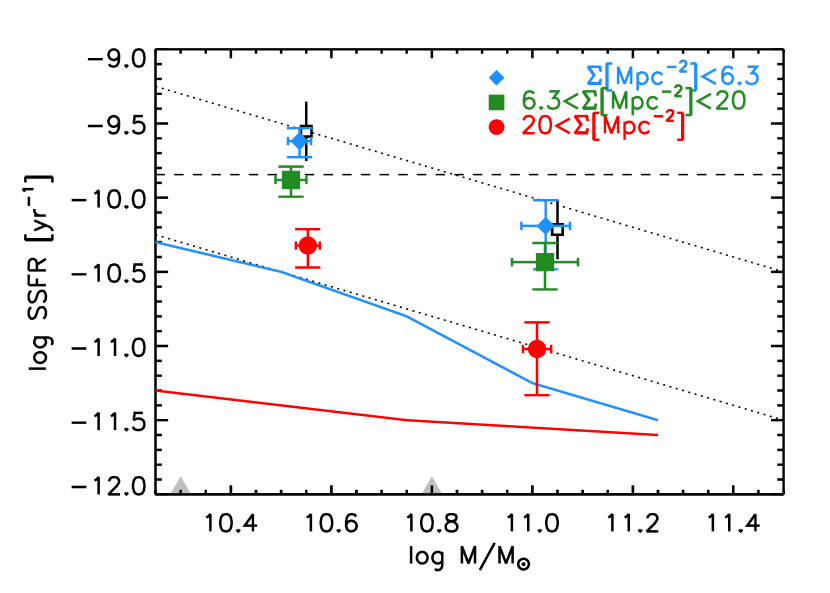
Figure 2 shows the median SSFR vs. local density for galaxies in two mass bins. The median mass of galaxies in each mass-density bin was used to compute SFR/M (i.e. SSFR). The error bars for the SSFRs reflect the uncertainty on the SFRs from the bootstrap analysis and the uncertainty in the median mass of each bin. There is a clear correlation between SSFR and density, with galaxies at higher densities having lower SSFRs. This is true for galaxies in both mass bins. Furthermore, at fixed density the lower mass galaxies have higher SSFRs. Note that because the SSFR-density trends are shown for a given mass bin, it implies that the SFR also declines across the entire density range. It also implies that the overall decline in SSFR with density is not due to any change in the mass function between the low-density field and the high-density cluster environment since the SSFR declines with density at a fixed mass.
Figure 3 emphasizes this point. The figure shows the median SSFR vs. stellar mass for galaxies in three density bins. The density bins have been recast from Figure 2 to roughly reflect the division between the cluster, groups, and field. At a fixed mass, galaxies in the highest density bin have SSFRs that are times lower than galaxies in the low-density bin. Note that the median field data from Damen et al. (2009) agree with the median SSFRs of galaxies in our lowest density bin, indicating that this bin is representative of the general field. Also note that the Damen et al. (2009) points roughly lie between the SSFRs of the two lowest density bins in Figure 2, implying that we in fact sample a range of field environments.
Figure 3 also shows the median SSFR trends for galaxies in the lowest () and highest () density environments at from Kauffmann et al. (2004). These total SFRs were derived from extinction corrected H luminosities. In our sample the MIPS derived SFRs dominate the total, allowing us to compare our SSFRs to those from Kauffmann et al. (2004). Although our density estimators were not computed in a similar manner, by comparing galaxies at the lowest and highest densities in both samples we can compare and contrast galaxies at the two extremes at both epochs.
Above the mass completeness limit, galaxies at all densities in our sample are forming stars at a higher rate relative to galaxies with the same stellar mass at . One should note however, that the bulk of SF has already taken place for most of these galaxies, even by , since most lie below the dashed line in Figure 3 that indicates the SSFR at which stellar mass doubles by at if the SFR remains constant.
At , Kauffmann et al. (2004) found a factor of spread in SFRs at between their lowest and highest density bins, with galaxies at high densities having lower SFRs. At , we found a similar result. For galaxies with mass , the spread in SFRs at is smaller than the factor of we find. This is likely because Kauffmann et al. (2004) assigned a limiting SSFR of yr-1 to galaxies with non-detectable SF. The median SFRs have not been corrected for contamination from galaxies in lower density bins, but we note that such a correction would lead to an even stronger decline in SSFR with increasing density.
5. Discussion
Recent work at indicates that for galaxies in the mass range studied here, several relations follow trends similar to those found at . For example, Holden et al. (2007) and van der Wel et al. (2007b) found a strong MDR for mass-limited samples in both the field and clusters at . Thus, it should not be surprising that we see a similar trend for the SSFR/SFR-density relation at as we see at (although with a different normalization). Interestingly, some recent studies of galaxies at low-redshift find evidence for enhanced levels of dust-obscured SF at densities slightly above typical field densities, although they also generally find an overall trend of decreasing SF activity at higher densities (Gallazzi et al., 2009; Wolf et al., 2009; Haines et al., 2009).
Our result of a declining SFR in higher density environments appears universal at and not confined to a cluster environment, much like the MDR and SFR-density relations in the local universe. As seen in Figure 2, cluster galaxies dominate the highest density bin, but much of the decrease in SSFR occurs in lower density field bins. In addition, after removing galaxies within times the virial radius of the cluster, we continue to find the SSFR to decrease with density, including in the remaining high density regions represented by several groups at projected distances of Mpc from the cluster. This decrease in SSFR occurs over a similar range of densities in which Patel et al. (2009) found an increase in the red galaxy fraction, possibly linking the end of SF and buildup of red-sequence galaxies in environments that reach into the dense regions of the field.
In contrast to our work, Elbaz et al. (2007) and Cooper et al. (2008) found very different results for the SFR-density relation. At , Elbaz et al. (2007) found a factor of spread in SFRs. However, they found galaxies at higher densities to have higher mean SFRs up to a critical density, above which the SFR declined. Much of the reversed SFR-density trend in Elbaz et al. (2007) is driven by a peak in the SFR in a narrow projected density range of dex (). Likewise, Cooper et al. (2008) also found the SFRs of galaxies to increase in higher density environments at , although their observed spread in SFRs was less than a factor of . While neither of these two surveys contain a cluster, both sample group environments similar to the groups around RX J0152-13 that have velocity dispersions ( km s-1, Tanaka et al., 2006) that are typical of groups found in the field (Gerke et al., 2007). However, the reversal in the SFR-density relation found by Elbaz et al. (2007) and Cooper et al. (2008) does not extend into the highest densities found in their group environments.
Sample selection plays an important role in interpreting the different results. While we use a mass-limited sample, Elbaz et al. (2007) and Cooper et al. (2008) use luminosity-limited samples that are biased to include low-mass blue star-forming galaxies and exclude the corresponding non-star-forming red galaxies. When restricted to a mass-limited sample that was similar to the one in this work, Elbaz et al. (2007) found the SSFR continued to increase from low-density to high-density but with marginal significance (see Fig. 20 in that work). Cooper et al. (2008) found the mean SFR to increase with density by while for the same sample the mean SSFR decreases by over the same density range, which implies an increase in the mean mass with density by a factor of . The inferred range of mean mass () from Cooper et al. (2008) is below our mass threshold. However, the small rise in SFRs with density seen by Cooper et al. (2008) can be explained by the presence of relatively more high mass galaxies, which have higher SFRs (Elbaz et al., 2007; Noeske et al., 2007a), at higher densities in their sample.
Interestingly, we note that when selecting a luminosity-limited sample that was similar to either of these works, we found the SFR to continue to decrease at higher densities, but at a much shallower pace for lower mass galaxies. This did not depend strongly on the sub-sample of galaxies that were used to compute local densities (i.e. luminosity vs. mass-limited). We note that contaminants from low-density environments, which we found to have higher levels of SF, likely contribute to the shallower trend.
Recent observations of a “star-forming sequence” in the field at (Salim et al., 2007) and up to redshifts of (Noeske et al., 2007b) suggest that galaxies populate a narrow distribution of SSFRs at a fixed stellar mass. Below this sequence is a more extended distribution of galaxies with very low SSFRs that are effectively non-star-forming. Here, we investigate whether the SSFR-density trend represents (1) a changing mix of galaxies that lie on or off of the star-forming sequence or (2) a change in the SFRs of star-forming galaxies in different environments. Without additional constraints, our MIPS stacking analysis alone cannot distinguish between these two scenarios.
Using our previous results on the correlation between the red galaxy fraction and density (Patel et al., 2009), we can speculate on which of these scenarios is more likely. In Patel et al. (2009) we found the fraction of blue galaxies increased by a factor of from in the highest density regions to at the lowest densities. If the typical SFR of galaxies on the star-forming sequence remains constant and the ratio of blue-to-red galaxies reflects the ratio of galaxies that are forming stars or not then one expects the average SFR (and SSFR within a single mass bin) in the high density regions to be diminished by a factor of compared to the field, roughly what we see in the MIPS stacking analysis presented here. The notion that galaxies are either star-forming or not is given additional credence by Bell et al. (2005) and Dressler et al. (2009) who found that the dominant mode of SF at these epochs was in moderate starbursts when accounting for the duty cycle of such events.
In summary, we find that at , the SSFRs and SFRs of galaxies with decrease in higher density environments, and this is true over the entire range of environments studied. This result follows the trend observed at in which Kauffmann et al. (2004) also found galaxies at higher densities to have lower SSFRs, but with SSFRs that were times higher at . Our result differs from that of Elbaz et al. (2007) and Cooper et al. (2008) who found a reversal in the SFR-density trend at over some portion of their density range, mostly driven by SF in lower mass galaxies present in their luminosity-limited samples. In a forthcoming paper, we plan to utilize rest-frame UV data with SED fitting to determine total SFRs of individual galaxies at . The distribution of SFRs in different environments will allow us to probe the processes that were responsible for shutting down SF at a time when the universe was half its current age.
References
- Balogh et al. (2004) Balogh, M., et al. 2004, MNRAS, 348, 1355
- Bell et al. (2005) Bell, E. F., et al. 2005, ApJ, 625, 23
- Brinchmann et al. (2004) Brinchmann, J., Charlot, S., White, S. D. M., Tremonti, C., Kauffmann, G., Heckman, T., & Brinkmann, J. 2004, MNRAS, 351, 1151
- Bruzual & Charlot (2003) Bruzual, G. & Charlot, S. 2003, MNRAS, 344, 1000
- Chabrier (2003) Chabrier, G. 2003, PASP, 115, 763
- Cooper et al. (2008) Cooper, M. C., et al. 2008, MNRAS, 383, 1058
- Damen et al. (2009) Damen, M., Labbé, I., Franx, M., van Dokkum, P. G., Taylor, E. N., & Gawiser, E. J. 2009, ApJ, 690, 937
- Dressler (1980) Dressler, A. 1980, ApJ, 236, 351
- Dressler et al. (2006) Dressler, A., Hare, T., Bigelow, B. C., & Osip, D. J. 2006, in Ground-based and Airborne Instrumentation for Astronomy. Edited by McLean, Ian S.; Iye, Masanori. Proceedings of the SPIE, Volume 6269, pp. 62690F (2006).
- Dressler et al. (2009) Dressler, A., Oemler, A., Gladders, M. G., Bai, L., Rigby, J. R., & Poggianti, B. M. 2009, ApJ, 699, L130
- Elbaz et al. (2007) Elbaz, D., et al. 2007, A&A, 468, 33
- Gallazzi et al. (2009) Gallazzi, A., et al. 2009, ApJ, 690, 1883
- Gerke et al. (2007) Gerke, B. F., et al. 2007, MNRAS, 376, 1425
- Gómez et al. (2003) Gómez, P. L., et al. 2003, ApJ, 584, 210
- Haines et al. (2009) Haines, C. P., et al. 2009, arXiv:0908.3003
- Holden et al. (2007) Holden, B. P., et al. 2007, ApJ, 670, 190
- Kauffmann et al. (2004) Kauffmann, G., White, S. D. M., Heckman, T. M., Ménard, B., Brinchmann, J., Charlot, S., Tremonti, C., & Brinkmann, J. 2004, MNRAS, 353, 713
- Kennicutt (1998) Kennicutt, Jr., R. C. 1998, ARA&A, 36, 189
- Noeske et al. (2007a) Noeske, K. G., et al. 2007a, ApJ, 660, L47
- Noeske et al. (2007b) Noeske, K. G., et al. 2007b, ApJ, 660, L43
- Patel et al. (2009) Patel, S. G., Kelson, D. D., Holden, B. P., Illingworth, G. D., Franx, M., van der Wel, A., & Ford, H. 2009, ApJ, 694, 1349
- Salim et al. (2007) Salim, S., et al. 2007, ApJS, 173, 267
- Salim et al. (2009) Salim, S., et al. 2009, ApJ, 700, 161
- Tanaka et al. (2006) Tanaka, M., Kodama, T., Arimoto, N., & Tanaka, I. 2006, MNRAS, 365, 1392
- van der Wel et al. (2007a) van der Wel, A., Franx, M., Illingworth, G. D., & van Dokkum, P. G. 2007a, ApJ
- van der Wel et al. (2007b) van der Wel, A., et al. 2007b, ApJ, 670, 206
- Wolf et al. (2009) Wolf, C., et al. 2009, MNRAS, 393, 1302