No Evidence of Quasar-Mode Feedback in a Four-Way Group Merger at
Abstract
We report on the results of a Chandra search for evidence of triggered nuclear activity within the Cl0023+0423 four-way group merger at . The system consists of four interacting galaxy groups in the early stages of hierarchical cluster formation and as such, provides a unique look at the level of processing and evolution already underway in the group environment prior to cluster assembly. We present the number counts of X-ray point sources detected in a field covering the entire Cl0023 structure, as well as a cross-correlation of these sources with our extensive spectroscopic database. Both the redshift distribution and cumulative number counts of X-ray sources reveal little evidence to suggest the system contains X-ray luminous AGN in excess to what is observed in the field population. If preprocessing is underway in the Cl0023 system, our observations suggest that powerful nuclear activity is not the predominant mechanism quenching star formation and driving the evolution of Cl0023 galaxies. We speculate that this is due to a lack of sufficiently massive nuclear black holes required to power such activity, as previous observations have found a high late-type fraction among the Cl0023 population. It may be that disruptive AGN-driven outflows only become an important factor in the preprocessing of galaxy populations during a later stage in the evolution of such groups and structures, when sufficiently massive galaxies (and central black holes) have built up, but prior to hydrodynamical processes stripping them of their gas reservoirs.
Subject headings:
galaxies: active — galaxies: clusters: general — X-rays: galaxies: clusters1. Introduction
There is now substantial evidence that environments of intermediate density, such as galaxy groups, play an important role in the transformation of field galaxies into the passively evolving populations found in galaxy clusters. Several studies have found that group populations already exhibit reduced star formation rates (SFR; Lewis et al. 2002; Gomez et al. 2003) and high early-type fractions similar to those observed in denser environments (Zabludoff & Mulchaey 1998; Jeltema et al. 2007). While the physical mechanisms responsible for the preprocessing of galaxies in the group regime are still heavily debated, several recent studies have reported an overdensity of X-ray luminous Active Galactic Nuclei (AGN) on the outskirts of clusters and within the substructure surrounding unrelaxed systems (D’Elia et al. 2004; Cappelluti et al. 2005; Kocevski et al. 2009a,2009b; Gilmour et al. 2009). These observations suggest that increased nuclear activity may be triggered in such environments and that AGN-driven outflows may play a role in suppressing star formation within galaxies during cluster assembly. Indeed the increased dynamical friction within groups and their low relative velocity dispersions make them conducive to galaxy interactions which can trigger such activity (Hickson 1997; Canalizo & Stockton 2001) and recent hydrodynamical simulations suggest that merger-triggered AGN feedback can have a profound effect on the gas content and star formation activity of their host galaxies (Hopkins et al. 2007; Somerville et al. 2008).
Since the mass density of virialized structures increases with redshift, mergers are expected to play an even greater role in the group environment in the past. Therefore, if galaxy interactions and subsequent AGN feedback are driving a significant portion of the preprocessing found in intermediate density environments, we may expect to find an overdensity of AGN in high redshift groups in the early stages of hierarchical cluster formation. In this Letter we report on Chandra observations of one such system, the Cl0023+0423 (hereafter Cl0023) four-way group merger at (Lubin et al. 2009a). The Cl0023 structure consists of four interacting galaxy groups which simulations suggest are the direct progenitors of a future massive cluster. As such, the system provides a unique look at the level of processing and evolution already underway in the group environment prior to cluster assembly.
To search for evidence of triggered nuclear activity within the Cl0023 structure, we present the number counts of X-ray point sources detected in a field covering the entire system, as well as a cross-correlation of these sources with our extensive spectroscopic database. Surprisingly, we find no evidence for an overdensity of X-ray detected point sources in the direction of the Cl0023 groups. We discuss the implications of this finding on the role of AGN feedback in regulating galaxy evolution in such structures. We also examine possible explanations for the lack of increased nuclear activity in the system. Throughout this Letter we assume a CDM cosmology with , , and km s-1 Mpc-1.
2. The Cl0023+0423 System
Originally detected in the cluster survey of Gunn, Hoessel & Oke (1986), the Cl0023 system consists of four galaxy groups separated by roughly 3000 km s-1 in radial velocity (Lubin et al. 2009a). Two of the constituent groups have measured velocity dispersions of 428 and 497 km s-1, while the second, poorer pair, have dispersions of 206 and 293 km s-1 (Lubin et al. 2009a). -body simulations suggest that the groups are likely bound and in the process of forming a massive cluster within the next Gyr, which, based on virial mass estimates of the individual groups, will have a final mass of M⊙ (Lubin, Postman & Oke 1998).
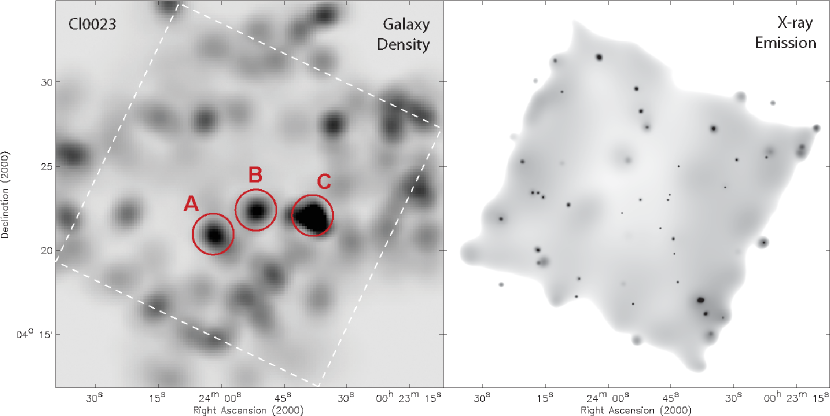
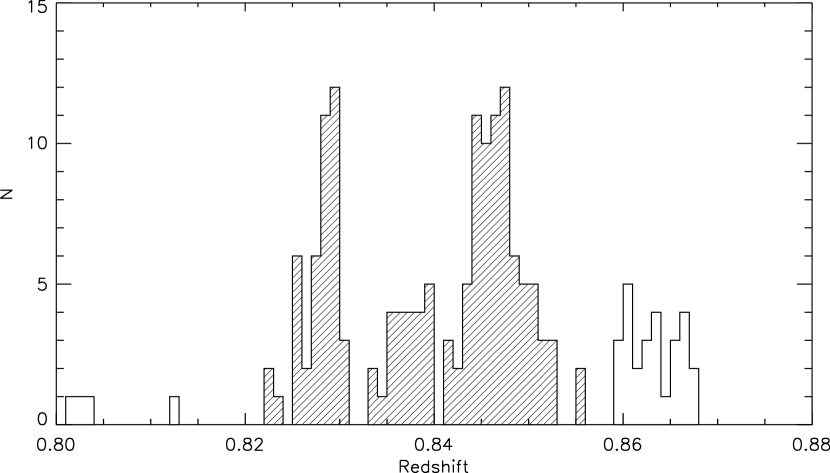
Details of our optical observations of the Cl0023 field are presented in Lubin et al. (2009a). In short, the system was imaged with the Sloan Digital Sky Survey (SDSS) filters using the Large Format Camera (LFC; Simcoe et al. 2000) on the Palomar 5-m telescope and follow-up spectroscopy carried out with the Deep Imaging Multi-object Spectrograph (DEIMOS; Faber et al. 2003) on the Keck 10-m telescopes. Our spectroscopic observations yielded 423 extragalactic redshifts in the Cl0023 field and an additional 73 galaxy redshifts were incorporated from the spectroscopic survey of Oke, Postman & Lubin (1998). The combined catalog contains redshifts for 134 galaxies in the Cl0023 structure with . An adaptively smoothed density map of color-selected red galaxies in the Cl0023 field constructed from our ground-based optical imaging of the system is shown in Figure 1, while the redshift distribution of the system is shown in Figure 2. Of the three density peaks visible in Figure 1, concentrations A and C consist of galaxies belonging to the redshift peaks at and , respectively, while concentration B is a superposition of two groups along the line of sight at and . The galaxies within the highest redshift peak at are not centrally concentrated but rather extend across the entire region, suggesting a sheet of galaxies in the near background.
3. X-ray Observations
Observations of the Cl0023 group system were carried out with Chandra’s Advanced CCD Imaging Spectrometer (ACIS; Garmire et al. 2003) on 2007 August 30 (obsID 7914). The observation consists of a single 49.4 ks pointing of the ACIS-I array, with the aimpoint located at , . The dataset was reprocessed and analyzed using standard CIAO 3.3 software tools111Available through the Chandra X-ray Center at http://cxc.harvard.edu/ in an identical manner to the procedure detailed in Kocevski et al. (2009a). Images for use in object detection were created from the level 2 event lists with a 0.492 ′′ pixel-1 binning and corresponding spectrally-weighted exposure maps were constructed to account for vignetting. An adaptively smoothed, exposure corrected image of the Cl0023 field in the soft band is shown in Figure 1.
We searched for point sources using the wavelet-based wavdetect procedure in CIAO, employing the standard i series of wavelet pixel scales, with . We adopted a minimum exposure threshold of 20% relative to the exposure at the aimpoint of the observation and a threshold significance for spurious detections of . Object detection was carried out on the unvignetting-corrected images and source properties, including count rates and detection significances, were determined with follow-up aperture photometry on the vignetting-corrected images. A total of 151 sources were found by wavdetect, of which 91 had detection significances greater than in at least one of the 0.5-2 keV (soft), 2-8 keV (hard) and 0.5-8 keV (full) bands.
Source fluxes in the soft and hard bands were determined by normalizing a power-law spectral model to the net count rate measured for each source. We assumed a photon index of for the power-law model222As this is the slope of the X-ray background (Tozzi et al. 2001; Kushino et al. 2002) and a Galactic neutral hydrogen column density of cm-2 (Dickey & Lockman 1990). Full-band fluxes were determined by summing the flux in the soft and hard bands. Finally, rest frame X-ray luminosities were calculated for sources matched to galaxies with measured redshifts (see §5) using the luminosity distance equation and a -correction appropriate for a power-law spectrum:
| (1) |
where is the luminosity distance and is the 0.5-8 keV X-ray flux.
4. Point Source Number Counts
To calculate the cumulative number counts, , of X-ray sources in the field of the Cl0023 system, we employed the method described by Gioia et al. (1990):
| (2) |
Here is the total number of detected point sources and is the sky area in square degrees sampled by the detector down to the flux of the th source. The variance of the number counts was in turn calculated as
| (3) |
In order to determine we constructed a flux limit map using the method employed by Kocevski et al. (2009a). First, all point sources detected by wavdetect were replaced with an estimate of the local background with the CIAO tool dmfilth and the resulting images binned to a pixel scale of pixel-1 to produce a coarse background map. This map is used to determine the flux limit, , for a point source detection in any one pixel. We can then calculate by summing the sky area covered by all pixels with equal to or greater than the flux of the th source.
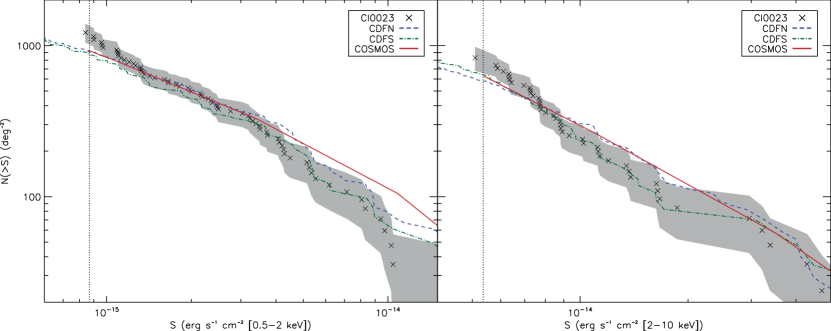
The resulting cumulative source number counts for the Cl0023 group system in the 0.5-2 keV (left panel) and 2-10 keV (right panel) bands are shown in Figure 3. The latter was chosen to ease comparison with previous studies and obtained by extrapolating our 2-8 keV fluxes to 10 keV. Also shown are the cumulative number counts measured in the COSMOS field (Scoville et al. 2007) and the Chandra Deep Field South and North (CDFS and CDFN; Rosati et al. 2002; Brandt et al. 2001). The COSMOS results are those of Cappelluti et al. (2007) converted to a spectral index of , while the CDFS and CDFN counts are the results of our own reanalysis of single ACIS-I pointings in each field333Observation ID numbers 581 and 2232..
In both the soft and hard bands, we find that the number of sources detected in the Cl0023 field is statistically consistent ( deviation) with the source counts observed in the reference blank fields. In the hard band, this agreement extends over roughly the entire sampled flux range, while in the soft band, we find an underdensity of bright sources relative to the COSMOS field, in agreement with the underdensity of soft sources previously reported at these fluxes in the CDFS (Yang et al. 2003). Our measured source counts suggest that there is no increased nuclear activity in the Cl0023 system detectable at X-ray wavelengths above our flux limit, which amounts to erg s-1 cm-2 (0.5-8 keV). At the median redshift of the Cl0023 system, this corresponds to a rest-frame 0.5-8 keV luminosity of erg s-1, making our observations sensitive to moderate luminosity Seyferts and QSOs in the complex.
To parameterize the number counts, we fit the unbinned soft- and hard-band counts in the Cl0023 field with a power-law model of the form using the maximum likelihood method of Murdoch et al. (1973). Our best-fit slopes, , to the faint- and bright-end number counts in the soft band are and , with a break in the distribution at roughly erg s-1 cm-2. In the hard band we only fit to the bright-end counts as we do not sample the faint-end population sufficiently to obtain a separate fit. Our best-fit slope above erg s-1 cm-2 is . These slopes are in good agreement (within the errors) with previous studies of the Chandra Deep Fields, which found Euclidean slopes at the bright-end and , in the soft band for the CDFS and CDFN, respectively (Brandt et al. 2001; Rosati et al. 2002).
5. Optical Source Matching
| RA | Dec | Net | † | ‡ | |
|---|---|---|---|---|---|
| (J2000) | (J2000) | Counts | () | () | |
| 00:23:47.5 | 04:21:17.6 | 1.487 | 7.7 | 1.49 | 12.02 |
| 00:23:43.3 | 04:18:06.3 | 0.169 | 6.4 | 2.94 | 0.21 |
| 00:23:56.3 | 04:17:60.0 | 0.683 | 3.8 | 1.14 | 1.71 |
| 00:23:55.2 | 04:25:20.2 | 1.091 | 13.5 | 4.77 | 19.86 |
| 00:24:02.5 | 04:22:12.9 | 0.442 | 39.5 | 11.29 | 6.46 |
| 00:23:51.1 | 04:27:19.8 | 0.113 | 19.7 | 5.34 | 0.17 |
| 00:23:52.2 | 04:25:53.7 | 0.682 | 5.7 | 0.69 | 1.03 |
| 00:23:48.9 | 04:21:23.7 | 0.745 | 43.0 | 9.53 | 17.23 |
| 00:23:58.5 | 04:24:51.1 | 1.336 | 10.5 | 3.76 | 24.13 |
Note. — All X-ray properties measured in the 0.5-8 keV band; † In units of erg s-1 cm-2; ‡ In units of erg s-1.
Despite the absence of a clear overdensity of X-ray sources in the Cl0023 field, we searched for AGN within the Cl0023 structure by matching our X-ray source list to our preexisting spectroscopic catalog. To perform this cross-correlation, we determined the positional uncertainty associated with each X-ray source using the empirical relationship of Kim et al. (2007), who find that centroiding errors increase exponentially with off-axis angle from the aimpoint of the observation and decrease as the source counts increase with a power-law form. To determine the reliability of a given match, we employed a maximum likelihood technique described by Sutherland & Saunders (1992) and more recently implemented by Kocevski et al. (2009a). The method gauges the likelihood that a given optical object is matched to an X-ray source by comparing the probability of finding a genuine counterpart with the positional offset and magnitude of the optical candidate relative to that of finding a similar object by chance. We refer the reader to Kocevski et al. (2009a) for details.
Using this technique we have matched a total of nine X-ray sources to galaxies with measured redshifts in our spectroscopic catalog. These galaxies cover a broad range in redshift () and there is no evidence for a concentration near the redshift of the Cl0023 system. In fact, we find no X-ray point sources matched to the 134 galaxies spectroscopically associated with the four groups in the Cl0023 structure. However, we should note that we did not specifically target X-ray sources with our spectroscopic observations, but instead simply cross-correlated their positions with out existing spectroscopic database. In future DEIMOS observations of the system we plan to have dedicated masks for X-ray and radio detected AGN in order to both increase our spectroscopic completeness of X-ray sources and to determine if the lack of AGN currently observed in the Cl0023 groups holds. The coordinates, redshifts, and X-ray properties of the nine galaxies currently matched to X-ray point sources in the Cl0023 field are listed in Table 1.
6. Discussion and Conclusions
Using Chandra imaging of the Cl0023 complex, we have searched for evidence of triggered nuclear activity within a dynamically active system of four galaxy groups in the early stages of cluster formation. Both the redshift distribution and cumulative number counts of X-ray point sources in the Cl0023 field reveal little evidence to suggest that the system contains X-ray luminous AGN in excess to what is observed in the field population. These results are at odds with previous reports of source excesses on the outskirts of dynamically unrelaxed clusters at high redshift. They also appear to challange the notion that AGN-driven outflows play a significant role in the preprocessing observed in galaxy groups and environments of moderate overdensity relative to the field. If preprocessing is underway in the Cl0023 system, our observations suggest that powerful (quasar mode) nuclear activity is not the predominant mechanism quenching star formation and driving the evolution of Cl0023 galaxies. Of course we cannot rule out a population of low-luminosity AGN powering “radio mode” feedback (Croton et al. 2006) in the Cl0023 complex as our observations are only sensitive to moderate luminosity Seyferts and QSOs. We are currently analyzing Very Large Array (VLA) 20-cm observations of Cl0023 to search for such a population and expect to present a full radio study of the system in a forthcoming paper (L. M. Lubin et al. 2009b, in preparation).
Our current findings are in stark contrast to the overdensity of AGN recently detected in similar Chandra observations of the Cl1604 supercluster at , where we find a population of Seyferts associated with an unrelaxed cluster and two rich groups (Kocevski et al. 2009a, 2009b). However, the galaxy populations of these groups differ in significant ways from those of the Cl0023 system. The Cl1604 groups tend to have higher velocity dispersions and more evolved galaxy populations than the Cl0023 groups, as indicated by their average SFRs and morphological fractions (Gal et al. 2008; Lubin et al. 2009a). Previous observations of Cl0023 galaxies found them to be predominately late-type systems (75%; Lubin et al. 1998) with substantial amounts of ongoing star formation444This is consistent with the galaxy properties of high redshift groups with similar velocity dispersions (e.g. Poggianti et al. 2006) (Postman, Lubin, Oke 1998; Lubin et al. 2009a), whereas the hosts of the Cl1604 AGN tend be bulge-dominated, post-starburst galaxies which show signs of recent or ongoing galaxy interactions. Therefore, while Cl0023 contains galaxies which have the gas necessary to fuel nuclear activity, it apparently lacks the bulge-dominated and massive early-type hosts in which powerful AGN have been shown to reside (Kauffmann et al. 2003).
A likely explanation for the absence of luminous AGN in the Cl0023 groups is that the system lacks galaxies with sufficiently massive nuclear black holes required to power such activity. It has previously been shown that the bulge-dominated S0 population in clusters and groups builds up over time at the expense of the spiral population and that this morphological evolution is more pronounced in lower mass systems (Poggianti et al. 2009). There is also evidence that these galaxies are typically more massive than their suspected progenitors (Dressler et al. 2009), suggesting they experience growth in their stellar bulges while in overdense environments, possibly via a centrally concentrated burst of star formation (Dressler et al. 1999). Given the correlation between bulge mass and central black hole mass (Gebhardt et al. 2000), we would expect similar growth in galactic nuclei over the same period. Therefore, if disruptive AGN-driven outflows play a role in quenching star formation in groups, as has been suggested, it may only become an important factor in the preprocessing of galaxy populations during a later stage in the evolution of such groups and structures, when sufficiently massive galaxies (and nuclear black holes) have built up, but prior to hydrodynamical processes within clusters stripping them of their gas reservoirs.
Further observations of a larger sample of systems in the early stages of cluster formation, with a variety of velocity dispersions and morphological fractions, will be required to test this scenario. In the mean time, we are planning additional spectroscopic follow-up of the Cl0023 groups targeting the radio bright population as well as the remaining X-ray point sources that currently lack redshifts. This will give us a greater spectroscopic completeness of X-ray luminous AGN in the Cl0023 field, which will enable us to test our current findings and should allow us to better discern the prevalence of powerful nuclear activity during cluster formation.
References
- Brandt et al. (2001) Brandt, W. N., et al. 2001, AJ, 122, 2810
- Canalizo & Stockton (2001) Canalizo, G. & Stockton, A. 2001, ApJ, 555, 719
- Cappelluti et al. (2005) Cappelluti, N., Cappi, M., Dadina, M., Malaguti, G., Branchesi, M., D’Elia, V., & Palumbo, G. G. C. 2005, A&A, 430, 39
- Cappelluti et al. (2007) Cappelluti, N., et al. 2007, ApJS, 172, 341
- Croton et al. (2006) Croton, D. J., et al. 2006, MNRAS, 365, 11
- D’Elia et al. (2004) D’Elia, V., et al. 2004, A&A, 422, 11
- Dickey & Lockman (1990) Dickey, J. M. & Lockman, F. J. 1990, ARA&A, 28, 215
- Dressler et al. (2009) Dressler, A., et al. 2009, ApJ, 693, 140
- Dressler et al. (1999) Dressler, A., et al. 1999, ApJS, 122, 51
- Faber et al. (2003) Faber, S. M., et al. 2003, Proc. SPIE, 4841, 1657
- Gal et al. (2008) Gal, R. R., Lemaux, B. C., Lubin, L. M., Kocevksi, D., & Squires, G. K. 2008, ApJ, 684, 933
- Garmire et al. (2003) Garmire, G. P., Bautz, M. W., Ford, P. G., Nousek, J. A., & Ricker, Jr., G. R. 2003, Proc. SPIE, 4851, 28
- Gebhardt et al. (2000) Gebhardt, K., et al. 2000, ApJ, 539, L13
- Gilmour et al. (2007) Gilmour, R., Best, P., Almaini, O. 2009, MNRAS, 392, 1509
- Gioia et al. (1990) Gioia, I. M., Maccacaro, T., Schild, R. E., Wolter, A., Stocke, J. T., Morris, S. L., & Henry, J. P. 1990, ApJS, 72, 567
- Gómez et al. (2003) Gómez, P. L., et al. 2003, ApJ, 584, 210
- Gunn et al. (1986) Gunn, J. E., Hoessel, J. G., & Oke, J. B. 1986, ApJ, 306, 30
- Hickson (1997) Hickson, P. 1997, ARA&A, 35, 357
- Hopkins et al. (2007) Hopkins, P. F., Bundy, K., Hernquist, L., & Ellis, R.S. 2007, ApJ, 659, 976
- Jeltema et al. (2007) Jeltema, T. E., Mulchaey, J. S., Lubin, L. M. & Fassnacht, C. D. 2007, ApJ, 658, 865
- Kauffmann et al. (2003) Kauffmann, G., et al. 2003, MNRAS, 346, 1055
- Kim, Kim, Wilkes, Green, Kim, Anderson, Barkhouse, Evans, Ivezić, Karovska, Kashyap, Lee, Maksym, Mossman, Silverman, & Tananbaum (2007) Kim, M., et al. 2007, ApJS, 169, 401
- Kocevski et al. (2009) Kocevski, D. D., Lubin, L. M., Gal, R., Lemaux, B. C., Fassnacht, C. D., & Squires, G. K. 2009a, ApJ, 690, 295
- Kocevski et al. (2009) Kocevski, D. D., Lubin, L. M., Lemaux, B. C., Gal, R., Fassnacht, C. D., Lin, R., & Squires, G. K. 2009b, ApJ, 700, 901
- Lubin et al. (2009) Lubin, L. M., Gal, R. R., Lemaux, B. C., Kocevski, D. D., & Squires, G. K. 2009a, AJ, 137, 4867
- Lubin et al. (2009) Lubin, L. M., et al. 2009b, in prep
- Lubin et al. (1998) Lubin, L. M., Postman, M., & Oke, J. B. 1998, AJ, 116, 643
- Lewis et al. (2002) Lewis, I., et al. 2002, MNRAS, 334, 673
- Murdoch et al. (1973) Murdoch, H. S., Crawford, D. F., & Jauncey, D. L. 1973, ApJ, 183, 1
- Oke et al. (1998) Oke, J. B., Postman, M., & Lubin, L. M. 1998, AJ, 116, 549
- Poggianti et al. (2009) Poggianti, B. M., et al. 2009, ApJ, 697, L137
- Poggianti et al. (2009) Poggianti, B. M., et al. 2006, ApJ, 642, 188
- Postman et al. (1998) Postman, M., Oke, J. B., & Lubin, L. M. 1998, AJ, 116, 560
- Rosati et al. (2002) Rosati, P., et al. 2002, ApJ, 566, 667
- Scoville et al. (2007) Scoville, N., et al. 2007, ApJS, 172, 1
- Simcoe et al. (2000) Simcoe, R. A., Metzger, M. R., Small, T. A., & Araya, G. 2000, Bulletin of the American Astronomical Society, 32, 758
- Somerville (2008) Somerville, R. S., Hopkins, P. F., Cox, T. J., Robertson, B. E., & Hernquist, L. 2008, 391, 481
- Sutherland & Saunders (1992) Sutherland, W. & Saunders, W. 1992, MNRAS, 259, 413
- Tozzi et al. (2001) TOzzi, P. , et al. 2001, ApJ, 562, 42
- Yang et al. (2003) Yang, Y., Mushotzky, R. F., Barger, A. J., Cowie, L. L., Sanders, D. B., & Steffen, A. T. 2003, ApJ, 585, L85
- Zabludoff et al. (2003) Zabludoff, A. I., Mulchaey, J. S. 1998, ApJ, 496, 39