Understanding of Ultra-Cold Neutrons Production in Solid Deuterium.
Abstract
Our recent neutron scattering measurements of phonons and other quasi-particle excitations in solid deuterium (sD2) and the extraction of the density of states for phonons and rotational transitions in sD2 have led us to a new understanding of the production of ultra-cold neutrons (UCN) in sD2. The UCN production rate reaches a maximum at an equivalent neutron temperature of =40 K for a neutron flux with Maxwellian energy distribution. The cross section for UCN production in sD2 has been determined by using the density of states in combination with the incoherent approximation as well as by a direct calibration of our measured neutron cross sections with the known cross section of the rotational transition in deuterium. Using this cross section we deduced the production rate of UCN in sD2 which agrees quite well with direct measurements of this energy averaged UCN production cross section.
pacs:
28.20.Cz, 63.20.kk∗Corresponding author; email: egutsmie@e18.physik.tu-muenchen.de
Ultra-cold neutrons (UCN) are slow enough to be confined
Golub (1965) in traps, which can be formed by materials with a
high Fermi potential (up to 300 neV) or by a magnetic field (60
neV/T). UCN can be observed for several tens of minutes in these
traps, and are excellent tools for high precision measurements, as
the life time of the neutron itself Arzumanov (2000); Serebrov (2005), and the
search for a possible electric dipole moment of the neutron
Baker (2006) (current upper limit 2.910-26 e cm).
Powerful UCN sources are needed for the here mentioned
experiments, and different groups Frei-1 (2007); LANL (2000); PSI-1 (2009); SER (1995)
are working on the development of strong sources, based on sD2
as an converter for down-scattering of thermal or sub-thermal
neutrons into the UCN energy region (typical 300 neV). A
converter based on sD2 should be operated at temperatures below
T10 K in order to avoid subsequent upscattering of UCN by
phonons within solid deuterium Liu (2000). The understanding of
the downscattering of neutrons into the UCN region crucially
relies on a detailed knowledge of the energy loss of thermal or
subthermal neutrons in the sD2 converter material. One major
reaction channel is based on phonons in the solid deuterium crystal, which are
excited by the neutrons.
We have recently measured the phonon system in sD2 by neutron time-of-flight measurements at the IN4 (ILL Grenoble) and at the TOFTOF (FRM II, Munich). These measurements are described in detail in another paper Frei (2009).
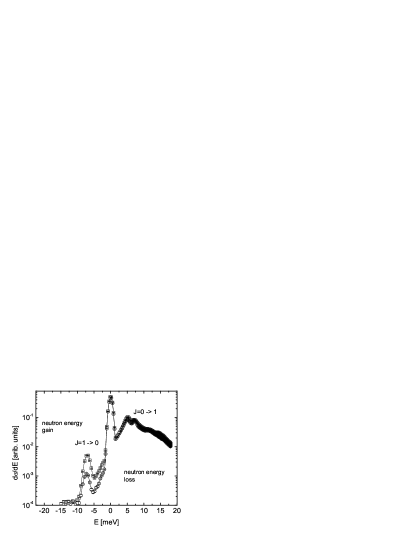
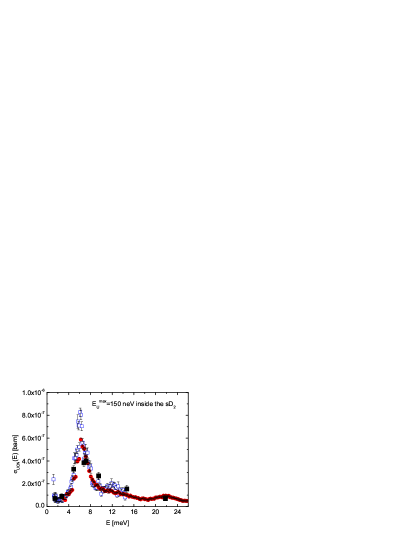
Fig. 1 shows two examples of our neutron scattering data (angular averaged) for two different concentrations co of ortho-D2 molecules. On the side of energy gain of the neutrons (positive E) we can identify the rotational transition . The intensity of this peak decreases with reduced para-D2 molecule concentration . A similar rotational transition (the transition) can also be observed on the neutron energy loss side. Furthermore it is remarkable that the elastic cross section (0 meV) of sD2 is quite large. Our data indicates that the elastic cross section makes up approximately 50% of the total cross section at thermal neutron energy. Another interesting feature is the neutron scattering intensity on the neutron energy gain side close to the elastic peak (=0 meV). An increase of the concentration of the para D2 molecules leads to a larger neutron up-scattering close to the elastic line. The origin of this cross section is very likely induced by phonons, which are interlinked with the rotational transitions of the para molecules. This up-scattering has serious implications to the up-scattering of UCN in the sD2 converter material, and reduces the achievable density of UCN in sD2. A detailed analysis of these effects will presented in a forthcoming paper.
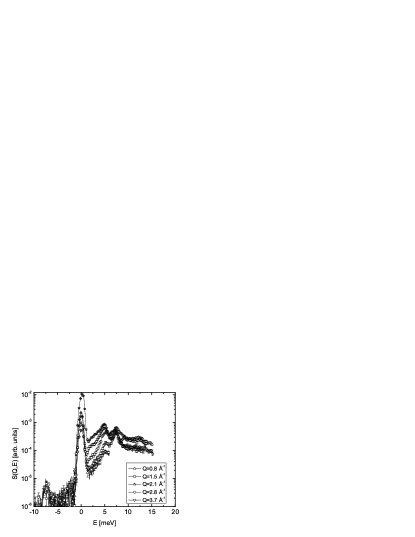
In addition the scattering function is shown for fixed values of momentum transfer in fig. 2. The dynamical scattering function comprises the phonon branches of the hcp-sD2 Nielsen (1973) crystals and the rotational transition. The acoustical phonons (transversal and longitudinal) are clearly visible in while the optical phonon branches are not. The rotational transition shows a significant Q - dependence and it is purely incoherent. The position the transition peak (=7.4 meV) does not change much at different Q-values. The cross section for this transition is shown in fig. 3. This cross section was extracted from our data by a integration of S(Q,E) at =7.4 meV with a width of = 1meV at different Q-values. The Q-dependence of this cross section was fitted using the incoherent scattering length of the transition Frei (2009)
| (1) |
The parameter Å is the distance of the deuterons within the D2 molecule, while is the mean square displacement of the D2 molecule in the lattice. The form factor for the transition is described by a spherical Bessel function of first order. The result for 0.245 0.02 is in good agreement with earlier published results Nielsen (1973). The peak-like deviations in fig. 3 at certain Q-values are the result of coherent neutron scattering on phonons.
With the aid of our neutron data we are able to determine the UCN
production cross section by two ways. One way is the determination
of the quasi-particle (phonons and rotational excitations of the
D2 molecules) density of states . The other way is the
direct integration of the dynamical neutron cross section in the
kinematical region along the free neutron dispersion parabola.
With the knowledge of the quasi-particle density of states it is possible to calculate the dynamical neutron cross section (averaged over the scattering angle, thus ). Vice versa it is also possible to extract from a measured using Turchin’s theory Turchin (1965) for this cross section applying the incoherent approximation. The absolute normalization of is not needed, because the extracted has to be normalized to unity anyway. This approach is only valid within the Born-approximation.
The method of determination of from our data is described in Frei (2009) in detail. Contributions of higher order multiphonons to are incorporated.
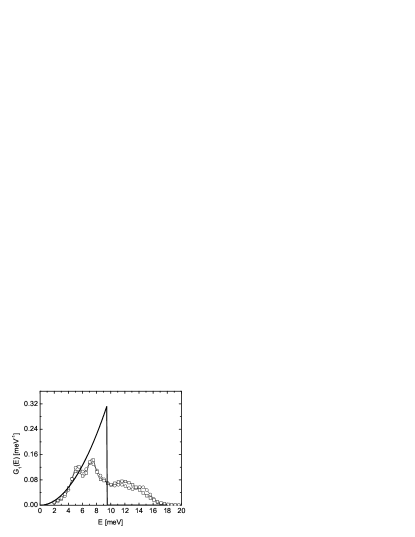
The result of our analysis Frei (2009) concerning and a
comparison with a Debye model is shown in fig. 4. The
characteristics of was already discussed in detail in
Frei (2009) but it is worth to summarizing these results again,
because they have an important impact on the UCN production cross
section. One major feature is the occurrence of these excitations
above E10 meV in the one-quasi-particle density of states
. These excitations above E10 meV are depending on
the concentration of ortho-D2. The optical phonons in the
region of E [8-10 meV] are not clear visible in
.
In the case of UCN production the energy transfer of the down-scattered neutron is approximately equal to the initial neutron energy (, : UCN energy).
The total cross section for UCN production can be calculated by
| (2) |
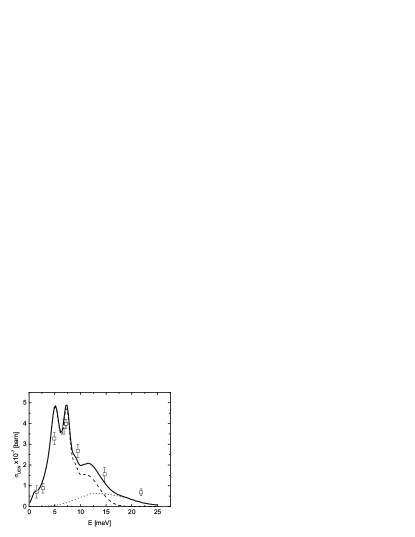
and is shown in fig. 5. It can be compared with recent published data of the UCN group at the PSI PSI (2007) which has studied UCN production at a cold neutron beam (1.4 meV to 20 meV). The agreement of data and our calculation, using our data for and Turchin’s incoherent approximation is surprisingly good. The calculated cross section comprises the contribution of one-quasi-particle and two-quasi-particle excitations. Three-quasi-particle excitations do not appear below E14 meV (see fig. 9 in Frei (2009)) and are rather small in their contribution. The authors of PSI (2007) compared their results to a calculated cross section based on a multi-phonon Debye model. They also reported, that using a ’more realistic model’ for the density of states (Yu et al. Yu (1985); Nielsen (1973)) leads to a considerably worse fit of their data. Using a Debye model with a cut-off at 9.5 meV (Debye temperature =110 K) only the contribution of two-phonon excitation have to be included in order to fit the measured cross section of =1.55 barn at E=14.7 meV PSI (2007). This also applies for the density of states model of Yu et al.. Our own calculated cross section shows a combination of one-quasi-particle and two-quasi-particle excitations contributing at these energies. In detail our data indicate (see fig. 5) that the UCN production cross section is mainly determined by one-quasi-particle excitation for energies below E=15 meV ( see fig. 4). Even though the two-quasi-particle contribution can not be neglected in the region of E 5-25 meV.
The application of the incoherent approximation in the case of sD2 has certainly to be questioned. The sD2 crystal scatters neutrons more coherently than incoherently. This fact leads to the question: Is it possible to get the UCN production cross section directly from the neutron scattering data?
The easiest way of determining the cross section for UCN production is the use of the dynamical scattering function in the -phase space along the free neutron parabola (dispersion curve with and ). This approach equally rely on the Born approximation. The UCN production cross section can be determined by
| (3) |
The term is the energy of the incoming neutron in the down-scattering process, while and are the upper limits for the UCN momentum and energy. In order to obtain absolute cross sections the dynamical scattering function of solid deuterium extracted from our neutron scattering data has to be calibrated to absolute values. This can be done by using the rotational transition as reference process for calibration. The cross section for the transition was calculated by Hamermesh and Schwinger Schwinger (1946) for ortho- and para- deuterium molecules (gas). These calculation include also thermal movements (maxwellian distribution of velocities) of the deuterium molecules in the gas. The application of these calculations to the rotational transitions of the D2 molecules, which are pinned in a crystal at fixed positions may of course be questionable. However the rotational transitions in sD2 are not very much hindered by the crystal binding of the crystal Kranendonk (1968). Indeed the molecules are of course not at rest, they perform motions around their equilibrium positions. These movements are caused by the zero-point-motions and also by existing phonon excitations in the crystal. A similar problem was considered by Lamb Lamb (1939) in the past. He calculated the capture of neutrons by atoms in crystals. His calculations for crystals with weak lattice binding delivered the finding, that atoms in such crystals can be treated as a gas with an effective temperature, which depends on the Debye temperature of the crystal. This effective temperature can be higher than the real temperature of the solid and is just a result of the average energy of the vibrational degrees of freedom plus the zero-point-motion. We used this ansatz to calculate the effective temperature (40 K at a deuterium temperature of 4 K) of the D2 molecules and used it for the calculation of the rotational transition () of our quasi free molecules, following the theory of Hamermesh and Schwinger.

The cross section in pure para deuterium has a value of =0.61 barn for =17.2 meV ( corresponding to the energy of the incoming neutrons at the IN4 experiment) at a deuterium temperature of =4 K. The comparison of our neutron scattering data of natural deuterium (=66.7) and ortho enriched deuterium indicated a ortho concentration of =(95.2 0.3).
Scaling with the para concentration of our sample (4.8) thus leads to a value of 0.029 barn for our ortho enriched solid D2 sample. This value for can be used to calculate a scaling factor for .
By means of this value it is possible to calculate the total neutron scattering cross section for =17.2 meV neutrons: =17.2 meV=23.4 barn. The assumption is of course only valid, if the kinematical area of our neutron scattering experiment covers most of the possible scattering processes. A good cross check of this value is the calculated value for the total cross section for solid poly-crystalline deuterium, using the incoherent approximation of Turchin Turchin (1965).
The result of this calculation leads to a value of =17.2 meV=23.8 barn, which is close to the value of our calibration. The dynamic response function , resolved from our data analysis, was not corrected for multiple scattering effects. Therefore the estimated error of this calibration is approximately 12 MS (2009). The result of this calibration and determination of the UCN production cross section as function of the the energy of the incoming neutrons, and a comparison with measurements of this cross section PSI (2007) is shown in fig. 6. The agreement of the absolute values of the measured cross section with the resolved values form our data is reasonable. The comparison of the calculated UCN production cross sections, extracted from the incoherent approximation and parabola method shows (see fig. 5 and fig. 6) a discrepancy in the region of 6 meV. The cross section, determined by the parabola method exhibits a pronounced maximum in the region of 6 meV as compared to the incoherent approximation result.
In fig. 7 the dynamical scattering function (neutron energy loss side) of fast frozen solid ortho-deuterium is shown. The black line corresponds to the dispersion of the free neutron.
UCN production cross section solid D2 of . A UCN energy range of 0-150 neV inside the solid D2 is assumed. Cross section determined by an integration of along the free dispersion of the neutron (sample - fast frozen solid deuterium (4 K)); data from IN4 measurements. Blue - 17.2 meV. Red filled - 67 meV, FN1 (2009). - direct UCN production data from measurements at the PSI PSI (2007). The PSI data do not show a distinct peak at 6 meV
The parabola of the free neutron crosses the acoustical phonon dispersion curve at 6 meV(see fig. 7). At this point, the UCN production cross section is predominantly determined by coherent scattering. This can explain a deviation from the production cross section in incoherent approximation. Nevertheless the general agreement of the incoherent approximation with the PSI data is remarkable (see fig. 5)
The effective UCN production rate P (UCN cm-3 s-1) from a neutron beam is determined by integrating the product of the UCN production cross section and the spectral flux (Maxwell spectrum with effective neutron temperature ) of the incoming neutrons over the finite UCN energy range ( maximum allowable UCN energy) and over the energy spectrum of the incoming neutron, still assuming .
| (4) |
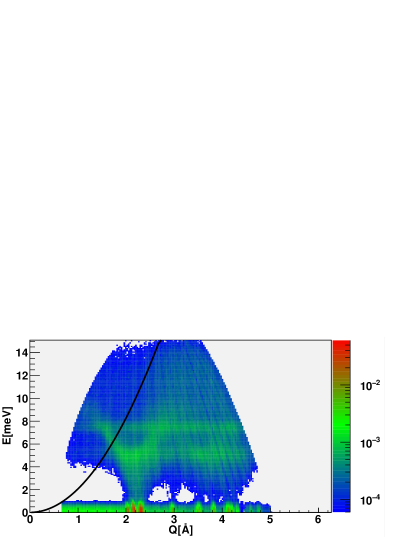
of sD2 for at K. Data from IN4 measurements. Black parabola - dispersion of the free neutron.
In fig. 8 the result for the UCN production rate in solid ortho deuterium, exposed to Maxwellian shaped neutron flux for different effective neutron temperatures is shown, using eq. 4.
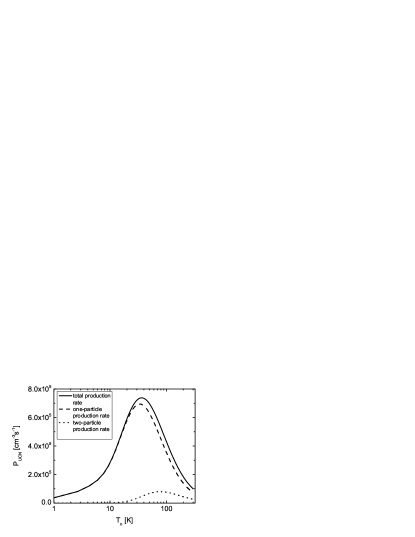
The main conclusion from these results is the new understanding of possible higher energetic loss channels (one-quasi-particle and two-quasi-particle excitations) in solid deuterium for the down scattering of thermal or cold neutrons in the conversion process to UCN. The best value for the effective neutron temperature is in the region of 40 K, which is larger than the value (30 K) reported by Yu et al. Yu (1985) in an earlier publication. A similar result was obtained by Serebrov et al. SER (1994) using a Debye-model for sD2 in a theoretical calculation, based on the incoherent approximation. The agreement of our result with the results of the calculation applying a Debye-model is not a surprise, because they include mulit-phonon excitations in their calculations, while Yu et al. considered only one-phonon excitations.
In summary, new neutron scattering data of solid deuterium leads
to a better understanding of UCN production in this converter
material. The new results for the density of states in sD2 and
the results for the UCN production cross section, extracted
directly from the dynamical scattering function predict a
significant UCN production cross section for incoming neutrons
with energies higher than 10 meV. This observation was also
confirmed PSI (2007) by direct measurements of the UCN
production cross section. An optimized sD2 UCN source should be
exposed to a cold neutron flux with an effective neutron
temperature of
40 K.
Acknowledgements.
This work was supported by the cluster of excellence ”Origin and Structure of the Universe” (Exc 153) and by the Maier-Leibnitz-Laboratorium (MLL) of the Ludwig-Maximilians- Universität (LMU) and the Technische Universität München (TUM). We thank T. Deuschle, E. Karrer-Müller, S. Materne and H. Ruhland for their help during the experiments.
References
- Golub (1965) R. Golub, D. Richardson, S.K. Lamoreaux, Ultra-Cold Neutrons, Adam Hilger,Bristol, Philadelphia and New York (1991).
- Arzumanov (2000) S. Arzumanov et al., Phys. Lett. B 483, 15 (2000).
- Serebrov (2005) A. Serebrov et al., Phys. Lett. B 605, 72 (2005).
- Baker (2006) C. A. Baker et al., Phys. Rev. Lett. 97, 131801 (2006).
- Frei-1 (2007) A. Frei et al., EPJ A 34, 119 (2007).
- LANL (2000) Roger E. Hill et al., Nucl. Instrum. Methods Phys. Res. A 440, 674 (2000).
- PSI-1 (2009) A. Anghel et al., Nucl. Instrum. Methods Phys. Res. A 611, 272 (2009).
- SER (1995) A. Serebrov et al., JETP Lett. 62, 785 (1995).
- Liu (2000) C.-Y. Liu et al., Phys. Rev. B 62, R3581 (2000).
- Frei (2009) A. Frei et al., Phys. Rev. B 80, 064301 (2009).
- Nielsen (1973) M. Nielsen and H. Bjerrum Mller, Phys. Rev. B 3, 4383 (1973).
- Turchin (1965) V.F. Turchin, Slow Neutrons, Israel Program for Scientific Translations,Jerusalem, (1965).
- PSI (2007) F. Atchison et al., Phys. Rev. Lett. 99, 262502-1 (2007).
- Schwinger (1946) M. Hamermesh and J. Schwinger, Phys. Rev. 69, 145 (1946).
- Kranendonk (1968) J. van Kranendonk and G. Karl, Rev. Mod. Phys. 40, 531 (1968).
- Lamb (1939) W.E. Lamb Jr., Phys. Rev. 55, 190 (1939).
- Yu (1985) Z-Ch. Yu, S. S. Malik and R. Golub, Z. Phys. B 62, 137 (1985).
- FN1 (2009) The calibration of at this energy was done by using the calculated total cross section 67 meV in incoherent approximation.
- SER (1994) A. Serebrov et al., JETP Lett. 59, 757 (1994).
- MS (2009) The treatment of multiple scattering effects in our solid deuterium samples are discussed in detail in ref. Frei (2009).