119–126
Open Cluster Characterization via
Cross-Correlation with Spectral Library
Abstract
We present a characterization method based on spectral cross-correlation to obtain the physical parameters of the controversial stellar aggregate ESO442-SC04. The data used was obtained with GMOS at Gemini-South telescope including 17 stars in the central region of the object and 6 standard-stars. fxcor was used in an iterative process to obtain self-consistent radial velocities for the standard-stars and averaged radial velocities for the science spectra. Spectral types, effective temperature, suface gravity and metallicities parameters were determined using fxcor to correlate cluster spectra with ELODIE spectral library and selecting the best correlation matches using the Tonry and Davis Ratio (TDR). Analysis of the results suggests that the stars in ESO442-SC04 are not bound and therefore they do not constitute a physical system.
keywords:
(Galaxy:) open clusters and associations: general, individual (ESO442-SC04)Introduction
Open clusters are destroyed over time by the action of external forces (Galactic tidal field, collisions with molecular clouds) and as a consequence of their own dynamical and stellar evolution. Studies on the subject indicate that most open clusters dissolve in 0.5-2.5 Gyr (Portegies Zwart et al., 2001) and that finding clusters in the state of dissolution should be common. However, discriminating such objects from a random over-density of field stars is a difficult task, and many authors have been developing techniques to study and properly classify them (e.g., Pavani & Bica, 2007).
Data
The Gemini Multi-Object Spectrograph (GMOS - Gemini-South) was used to collect spectra of 36 selected stars on a region centered in ESO442-SC04 and 6 standard-stars from Nordström et al. (2004). The collected spectra cover the spectral range with resolution and signal-to-noise in the range . Table 1 lists the observed standard stars and their properties as found in the literature.
| Object | ST | (km/s) | [Fe/H] ( 0.12) | Teff ( 110) (K) |
|---|---|---|---|---|
| HD104471 | G0V | -7.2 0.1 | 0.00 | 5984 |
| HD104982 | G2V | 10.5 0.1 | -0.40 | 5610 |
| HD105004 | F8VI | 121.6 0.3 | -0.79 | 5821 |
| HD107122 | F1V | 16.2 3.3 | -0.42 | 6576 |
| HD111433 | F3IV | 4.0 0.6 | 0.25 | 6471 |
| CD-289374 | — | 30.4 0.2 | -1.18 | 4830 |
We adopted ELODIE.3.1 stellar spectral library (Prugniel & Soubiran, 2001) as template spectra in the cross-correlation technique to determine the physical parameters of the targets. The library includes 1962 spectra of 1388 stars providing a large coverage of stellar atmospheric parameters , and .
Radial velocity determination
Initially fxcor task was applied on the standard-stars spectra using the values given by Table 1 as a first guess to their radial velocity. A self-consistent set of solutions was then obtained by making corrections to the velocities and redoing the correlation in order to find consistent values for the whole set. Table 2 shows the results of the correlations and the averaged radial velocities obtained.
| star/template | HD104471 | HD104982 | HD105004 | HD107122 | HD111433 | CD-289374 |
|---|---|---|---|---|---|---|
| HD104471 | -126.311.5 | -7.55.2 | 118.015.1 | 16.725.9 | -24.611.4 | 30.45.7 |
| HD104982 | -127.55.2 | -8.75.7 | 114.013.4 | 9.4 24.7 | -28.813.0 | 32.911.2 |
| HD105004 | -122.715.8 | -1.113.4 | 121.60.3 | 19.627.9 | -20.618.0 | 37.516.6 |
| HD107122 | -126.825.9 | -1.924.7 | 118.227.9 | 16.23.3 | -24.618.4 | 36.028.9 |
| HD111433 | -126.311.5 | -4.513.0 | 117.618.0 | 16.218.4 | -24.611.4 | 33.717.8 |
| CD-289374 | -128.811.2 | -8.75.2 | 114.516.6 | 10.63.3 | -27.917.8 | 30.40.2 |
| -126.46.1 | -5.45.4 | 117.37.0 | 14.89.5 | -25.26.3 | 33.56.6 |
Then fxcor was run on the science spectra using the 6 standard stars spectra as templates. The radial velocities found from each template were averaged and the dispersion calculated for all science spectra. Table 4 shows the used spectra, their corresponding S/N and the radial velocities obtained.
Cross-correlation with spectral library
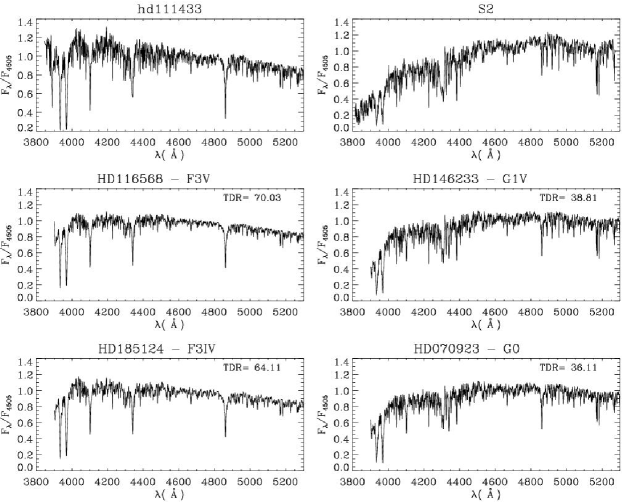
We used ELODIE library spectra as templates to the standard-stars and the task fxcor to determine, through the sharpness of the correlation function peak (TDR, Tonry & Davis, 1979), the most similar templates to each star. Fig. 1 shows the two best matching spectra found by correlation for the standard-star HD 111443 and for one of our science-spectra. Their spectral types and TDR correlation parameter are also shown.
Spectral types were determined by collecting the ten most similar templates and summing over the TDR value of those with the same spectral type. The one with the highest TDR sum, was adopted as the final spectral type. Table 3 shows the determined spectral types for standard-stars in comparison with the values provided by SIMBAD.
| HD104471 | HD104982 | HD105004 | HD107122 | HD111433 | CD-289374 | |
|---|---|---|---|---|---|---|
| Determined | G0 | G2V | F5V | F3V | F3V | G0 |
| SIMBAD | G0V | G2V | F8IV | F1V | F3IV | — |
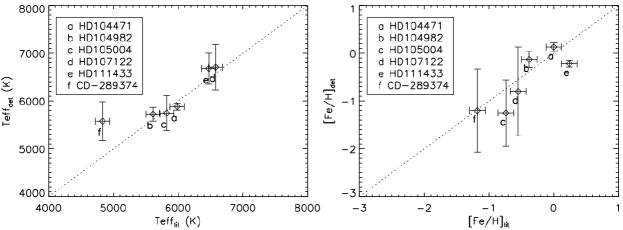
Effective temperatures, surface gravity and metallicity were calculated as the averaged values listed for the chosen templates, weighted by the TDR correlation value of each template. The uncertainties adopted correspond to the weighted standard deviation of the derived average. Figure 2 shows the relation between the determined effective temperature and metallicity and the literature parameters.
We used the same method to determine the spectral type, effective temperature, surface gravity and metallicity of our science spectra, as shown in Table 4.
Results
By employing cross-correlation techniques and using ELODIE’s spectral library we were able to determine heliocentric radial velocities, spectral types, effective temperatures, surface gravity and metallicities for 17 stars in the inner region of stellar object ESO442-SC04. These results are summarized in Table 4.
| Spectrum | S/N | () (km/s) | Sp. Type | Teff () (K) | log(g) () | [Fe/H] () |
|---|---|---|---|---|---|---|
| S2 | 15 | 75.8 (7.2 ) | G5V | 5676 (117) | 4.20 (0.21) | -0.01 (0.09) |
| S6 | 40 | 9.5 (5.2 ) | F5V | 6347 (348) | 4.24 (0.12) | -0.59 (0.27) |
| S9 | 20 | 25.1 (4.7 ) | F5V | 6309 (416) | 4.24 (0.08) | -0.52 (0.29) |
| S10 | 10 | 93.6 (10.3) | K2V | 5213 ( 61) | 4.48 (0.10) | -0.03 (0.14) |
| S12 | 20 | 227.2 (12.7) | G0 | 5380 (424) | 3.14 (0.88) | -1.60 (0.66) |
| S14 | 25 | 110.0 (10.9) | G0 | 5673 (324) | 3.75 (0.72) | -1.79 (0.57) |
| S15 | 30 | 78.5 (7.5 ) | G5V | 5606 (115) | 4.33 (0.11) | 0.02 (0.08) |
| S19 | 50 | 68.0 (8.2 ) | F3V | 6834 (261) | 4.28 (0.08) | -0.41 (0.29) |
| S20 | 25 | 74.4 (6.9 ) | G2V | 5740 ( 63) | 4.17 (0.18) | 0.03 (0.13) |
| S21 | 30 | 31.3 (5.6 ) | F7IV | 5910 (460) | 3.89 (0.75) | -0.99 (0.81) |
| S23 | 35 | 95.5 (8.5 ) | G0V | 5765 (261) | 3.99 (0.56) | -0.92 (0.67) |
| S25 | 6 | 145.9 (17.1) | F2IV | 6480 (439) | 4.14 (0.19) | -0.19 (0.16) |
| S28 | 30 | 15.0 (5.4 ) | F8V | 6005 (306) | 4.19 (0.19) | -0.57 (0.26) |
| S29 | 22 | 10.7 (7.1 ) | G8III | 4877 ( 87) | 2.76 (0.16) | -0.03 (0.15) |
| S30 | 12 | 40.0 (6.6 ) | G0III | 5721 ( 69) | 4.07 (0.18) | 0.16 (0.07) |
| S32 | 10 | 47.0 (6.7 ) | G8III | 5011 (212) | 2.76 (0.42) | -0.03 (0.13) |
| S33 | 12 | 142.4 (12.9) | G8V | 5633 (117) | 4.31 (0.18) | -0.01 (0.06) |
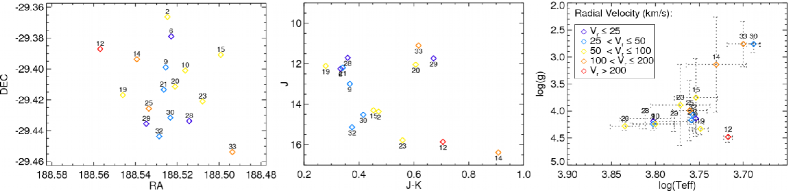
2MASS data was used to build a colour-magnitude diagram and a spatial diagram showing the relative positions of the stars in the sky, along with the radial velocity, surface gravity and effective temperature data obtained for the targets. The objects in those diagrams are labeled according their internal identification and coded with colors representing groups with a range of radial velocities. Such diagrams are shown in Fig. 3.
Conclusion
We devised a spectral cross-correlation method to determine kinematical and astrophysical parameters for stars in the central region of ESO442-SC04. Radial velocities show a dispersion greater than 50 km/s and the metallicities show a dispersion greater than 0.6 dex, suggesting that few, if any, of the studied stars are physically bound. Although the stars distribution in the CMD (Fig. 3, middle) suggests that they follow evolutionary sequences typical of old clusters, our results suggest that ESO442-SC04 does not constitute a physical system.
References
- Bica et al. (2001) Bica, E., Santiago, B. X., Dutra, C. M., Dottori, H., de Oliveira, M. R., & Pavani, D. 2001, A&A, 366, 827
- Carraro et al. (2005) Carraro, G., Dinescu, D. I., Girard, T. M., & van Altena, W. F. 2005, A&A, 433, 143
- Nordström et al. (2004) Nordström, B., et al. 2004, A&A, 418, 989
- Pavani & Bica (2007) Pavani, D. B., & Bica, E. 2007, A&A, 468, 139
- Portegies Zwart et al. (2001) Portegies Zwart, S. F., McMillan, S. L. W., Hut, P., & Makino, J. 2001, MNRAS, 321, 199
- Prugniel & Soubiran (2001) Prugniel, P., & Soubiran, C. 2001, A&A, 369, 1048
- Tonry & Davis (1979) Tonry, J., & Davis, M. 1979, AJ, 84, 1511