Numerical simulation of dark lanes in post–flare supra–arcade
Abstract
We integrate the MHD ideal equations to simulate dark void sunwardly moving structures in post–flare supra–arcades. We study the onset and evolution of the internal plasma instability to compare with observations and to gain insight into physical processes and characteristic parameters of these phenomena. The numerical approach uses a finite-volume Harten-Yee TVD scheme to integrate the 1D MHD equations specially designed to capture supersonic flow discontinuities. The integration is performed in both directions, the sunward radial one and the transverse to the magnetic field. For the first time, we numerically reproduce observational dark voids described in Verwichte et al. (2005). We show that the dark tracks are plasma vacuums generated by the bouncing and interfering of shocks and expansion waves, upstream an initial slow magnetoacoustic shock produced by a localized deposition of energy modeled with a pressure perturbation. The same pressure perturbation produces a transverse to the field or perpendicular magnetic shock giving rise to nonlinear waves that compose the kink–like plasma void structures, with the same functional sunward decreasing phase speed and constancy with height of the period, as those determined by the observations.
I Introduction
Dark sunward sinuous lanes moving along a fan of rays above post–flare loops towards a supra–arcade with a decelerating speed in the range of km s-1 were firstly described by McKenzie and Hudson mck (1999), using the Yohkoh Soft X–ray Telescope. Further observations showed that the fraction of solar flare long–duration event arcades possessing fans is not small, and that downflows above such arcades are not uncommon (McKenzie mck2, 2000). The phenomena were extensively studied by several authors (Wang et al. wan, 1999; Innes et al. inn, 2003a,b; Svestka et al. sve, 1998; Asai et al. asa, 2004; McKenzie and Savage mck3, 2009) and different theoretical explanations have been offered to give account of the physics of the underlying process. McKenzie mck2 (2000) dismissed the interpretation that X–ray voids could be explained as evidence of blobs of cool material separated from the main body of a CME falling gravitationally back to the surface of the Sun. This author supported the explanation that flux tubes linking an above current sheet retract into the arcade under the force of magnetic tension (see also Wang et al. wan, 1999). The down moving structures observed at Mm heights above the top of the arcade indicated that the reconnection site must be located above the flare arcade. Sheeley and Wang she (2002) interpreted the phenomenon as the top of collapsing loops with void tails in the wakes where reconnection occurs. Asai et al. asa (2004) proposed, based on RHESSI observations, that dark lanes are sunward voided flows generated by the reconnection process developed by a current sheet at the supra–arcade.
Verwichte et al. (ver, 2005, hereafter VNC) analyzed transverse to the magnetic field oscillations associated with sunward dark lanes in the post–flare supra–arcade of NOAA active region 9906 on the st of April They interpreted two oscillating in phase edges (C and D in VNC) as fast surface magnetoacoustic kink wave trains guided by the ray structure. They founded that the phase speeds and the displacement amplitudes decrease as they propagate downwards and derived a function to fit the amplitude of the oscillating perturbation at a given height. The period remained constant with height. As a function of time, the phase speeds decreased and periods increased.
In this Letter, based on the following arguments, we propose a new scenario to numerically give account of the phenomenology described in VNC: 1) the observational phase speed magnitude in VNC is several hundreds of km s-1 lower than the Alfvén estimations, this could suggest that slow speed sunward processes, rather than fast ones, are at work; also, 2) an impulsive energy deposition or pressure pulse can lead to lower speed void features obtained as a result of nonlinear interacting slow shocks, i.e., where the magnetic field plays the role of being the wave guide of a fundamentally hydrodynamic shock (Fernández et al. fer, 2009). This fact is a starting supposition to simulate the dynamics along the magnetic field lines. 3) The sunward dynamics is differentiated, from the transverse one because conductive energy transport along field lines is far more effective than across them, thus, we assume independence between the dynamics of two main directions: the sunward and the transverse to the magnetic field one. 4) As the impulsive triggering mechanism acts in all directions, a perpendicular magnetic shock can develop in the transverse direction. In conclusion, our modeling is accomplished supposing that a pressure pulse applied to the coronal inhomogeneous medium, structured by a main magnetic field, is a triggering mechanism of two fundamental independent shock schemes, an hydrodynamic one and a magnetic perpendicular one. On each direction the interaction of the nonlinear waves will give rise to the different patterns we are interested in. We emphasize that if the simulations reproduce the observational data, e.g., the kink–like features, the temporal cadences, the phase speed and sunward pattern functional decreases, in the frame of a few reasonable suppositions, this implies that the overall scheme could be at the bases of the underlying physical processes. Even when a full numerical simulation is required, this two 1D modeling, is a useful first approach, certainly, if due to its simplification and to the accuracy in the observational description suggests that it had captured important physical processes.
II Numerical method
To simulate time dependent MHD flows we use a method developed by us (Elaskar et al. ela, 2001). The equations used are the continuity, momentum, energy and magnetic induction equations together with the state equation forming a system of partial hyperbolic differential equations. The numerical approach consists of an approximate Riemann solver with the TVD scheme proposed by Yee for gasdynamics flows (Yee et al. yee, 1985). The “eigensystem” technique presented by Powell pow (1995) was also used with the eigenvector normalization proposed by Zarachay et al. zar (1994). The accuracy of the technique was verified by means of simulations of the Riemann problem introduced by Brio and Wu and the Hartmann flows (Maglione et al. mag, 2007).
III Results and discusion
In VNC, to study supra–arcade ray structures the authors chose a rectangular subfield of parallel and perpendicular to the supra-arcade ray coordinates where the structures were visible. They could describe the oscillatory motions of four dark transverse displacements for a fixed vertical coordinate as a function of time, i.e. Mm. Also, they displayed the intensity variations of the ray parallel coordinate as a function of time i.e., averaged over a segment of the coordinate, Mm, (Fig. 1-2 in VNC). They found that the period remains constant with height but the amplitude and phase speed decrease as the wave travels sunwards. Assuming a transverse perturbation of the form is the time, and the height, the functions that fit the amplitude and the phase speed are respectively
| (1) |
with correspondent parameters given in Table 1.
To reproduce the observations we schematically chose two set of characteristic values in VNC: edges C and D, which seem to have different structure. Edge C’s tail has a kink–like structure and edge D, more irregular, resembles a sausage–like structure in part of its tail. Table 1 shows the observational wave parameters in VNC used to adjust the numerical simulation.
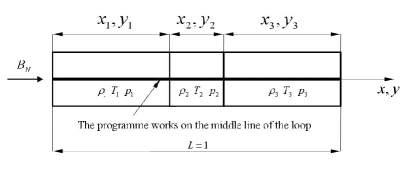
To perform the numerical simulation the physical quantities are expressed in a dimensionless form. As in VNC the coordinate represents the sunward direction and the coordinate the transverse to the magnetic field one, as seen by the line of sight. Figure 1 shows a scheme of the numerical domain of the two 1D independent integrations performed, i.e. two main initial shock wave fronts triggered by the same pressure perturbation. One directed sunwards, parallel to the field lines, and the other directed transversally to them. The composition of the two processes will give the overall description. The details of the energy deposition mechanism are not taken into account here e.g., reconnection processes as the one suggested by Asai et al. asa (2004).
III.1 Transverse perpendicular magnetic shocks
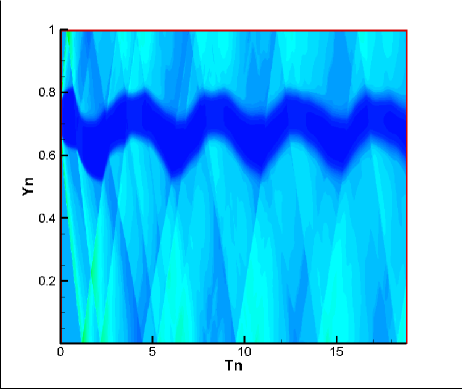
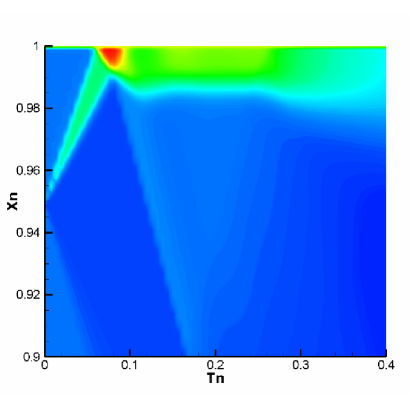
Traditionally it is expected that the observations are due to the direct action of boundary effects between the void and the surrounding medium. Our simulations show that the observational void patterns can also be obtained as a result of nonlinear evolution of waves triggered by an instantaneous pressure pulse. It is required, however, that the media has density inhomogeneities aligned with the magnetic field, in order to produce the interferences upon reflection that are responsible of sustaining the void lanes. The initial perturbation, seen as a transverse to the field line phenomenon, produces opposite magnetic shock waves that bounce in the lateral and denser boundary medium composing an oscillatory pattern of nonlinear wave interactions whose evolution leads to an internal defined central vacuum region. The effect of the density inhomogeneities -which produce partial reflections and absorptions of waves, e.g, it was estimated that density values can rise at least between two and five times from the void to the denser medium (McKenzie and Hudson mck, 1999; Innes et al. inn, 2003)- are taken into account as density steps modeled by reflecting boundaries at the extremes of the integration domain. We performed several simulation with different values of the non–dimensional boundary density, allowing partial or total rebounds of the waves, and we found that the result is robust in the sense that the oscillating pattern is conserved for a density range going from four to ten times the non–perturbed initial value. A study of sensitive to the initial and boundary conditions will be matter of a new work together with a 1D and 2D simulation. A resulting simulation that accurately fits the edge C description in VNC is shown in Fig. 2a. The non–dimensional boundary density is assumed constant and equal to The color palette indicate differences in the density values, a partial rebound of half of the momentum occurs at and . The darker region corresponds to the resulting vacuum zone pattern, with vanishing values of the density, i.e. the non–dimensional vacuum density is while the external medium value results . Note that the simulation assumes an initial pressure pulse that triggers the whole pattern, thus the following process of wave interactions produces and sustains the void cavity for a time interval which is in accordance with the observations, as it can be seen from the figure.
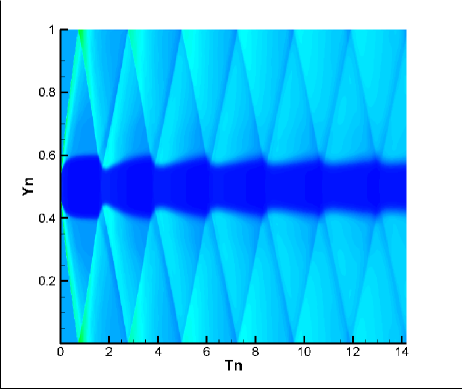
If the partition is modified, a sausage–like description can be obtained as it is shown in Fig. 2b. This figure was adjusted with the sausage–like edge D data. The differences between Fig. 2a and Fig. 2b are due to the fact that in the first case an asymmetric rebound occurs while in the second one the rebound is symmetric. Kink–like structures seem more probable than the sausage–like ones because the symmetric condition requirement of the external inhomogeneous media is more improbable. Figure 2 shows that the vacuum is immediately originated by the pulse and the interaction of the non–linear waves composes and sustains a kink–like or a sausage–like pattern for a large period of time.
The procedure of convertion into the dimensionless quantities and the relations that couple the transverse and radial parameters are described in next subsection.
III.2 Calibration
The non–dimensional quantities are the ratios of a dimensional quantity and a reference one. We assume a reference value of the magnetic field and the gas pressure of G and Pa respectively. To derive the dimensional period, amplitude, density and speed we proceeded as follows. I) Using the first two lines of non–dimensional values in Table 2, we obtained Fig. 2. II) From the figures we determined the mean non–dimensional speed chosen as:
| (2) |
where and are the non–dimensional periods and amplitudes respectively. The correspondent dimensional speed is:
| (3) |
where the dimensional values and are taken from Table 1 as reported in VNC for C and D edges. From eq. (2) and eq. (3), taking into account that , we obtain the reference value for the density Kg Note that as and that from Fig. 2a, (or equivalently from Fig. 2b) using the edge C value s, taken from Table 1 (or equivalently s from edge D) it results: s for the kink structure and s for the sausage one. Using the same argument for the amplitude, , with taken from Table 1 and from Fig. 2 we obtain km, for the kink structure, and km for the sausage one. These quantities are also used as the reference values for the simulation in the sunward direction, together with the initial conditions shown in the last line of Table 2.
III.3 Radial hydrodynamic shocks
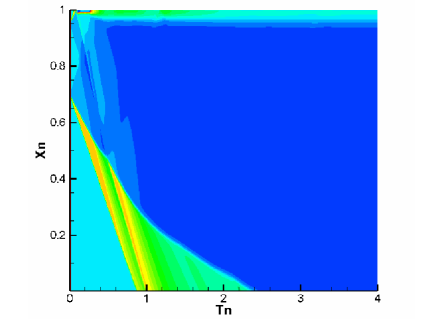
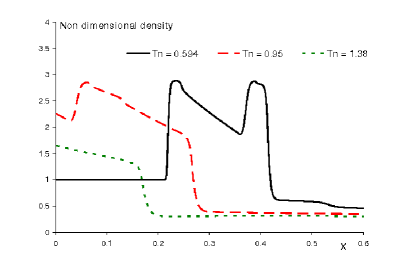
In the radial direction the same pressure pulse generates shocks traveling sunwards and outwards, along the magnetic field lines. The nonlinear interaction of outward rebound waves and sunward absorbed ones compose an overall descending void structure. The pressure pulse is supposed to be associated with a reconnection event implying that field lines should retract away from the reconnection site under the force of magnetic tension (McKenzie mck2, 2000). Thus, we suppose that a partial rebound occurs upwardly near the reconnection site. Downwardly, the background initial density is assumed constant and equal to the reference value. The sunward perturbation is absorbed by the non–perturbed media as it travels, however, a total absorption constraint is assumed at the sunward boundary. Our origin of coordinates in the radial direction is located at Mm. In VNC is the radial coordinate indicating the fixed position from where the motion is described, and Table 1 values were measured. We chose Mm as the position of the triggering pressure pulse. Thus, is also the distance traveled by the void features, i.e., taking into account different trajectories of the void heads in VNC observations this distance results a good assumption. The non–dimensional value of is and the non–dimensional initial density, corresponds to the dimensional value. Figure 3a is equivalent to Fig. (2C) in VNC. Note that the radial perturbation initially generates two shocks, one moving sunwards and the other upwards. Figure 3b is a zoom of Figure 3a showing the upward moving features, which are forced to partially rebound at The upwardly moving features in Fig. 3b correspond to a shock front, recognized because of the density enhancement at the shock front, and a contact discontinuity wave, recognized because the pressure and the speed of the flow are not changed while the wave passes. Also, an expansion wave travels downwards, it is recognized because the density is diminished at its pass. Figure 3a shows that the interaction of subsequent waves composes a downward moving void as it is indicated in by the color contrast, i.e. darker features correspond to lower values of the density. The clearest curve that originates at and ends at is the main downward shock, i.e. while crossing the shock front the density varies from to Later interactions compose a region of smooth expansion that moves sunwards until it is absorbed at Further interactions generate a low density upper zone, also formed by the coupling of nonlinear upward and downward moving perturbations, it is separated from the later zone by a sharp curve. The variation of the density as a function of the sunward direction for fixed times can also be seen from Fig. 3c. For the non–dimensional time we note a first peak corresponding to the main shock front, the posterior smooth decaying values of density corresponds to the expansion region. The interaction with descending perturbations determine another shock peak with a descending step of density at The behaviour is similar for without the second shock. At larger times, as the main shock was already absorbed, only the step of the density, while crossing the voided region, is registered.
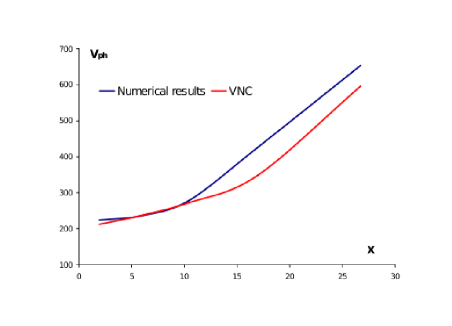
To compare our speed values with those in VNC we calculated the speed of the curve limiting the vacuum zone. The VNC curve was obtained with the speed function of eq. (1) replacing by , in accordance with our choice of the origin of coordinates. Figure 4 shows the comparison between the numerical and observational curves. Note that the the reference value kms-1, the speed measured by VNC at is the simulation speed at the origin of coordinates. The figure shows the good correspondence between the observational velocity curve and the numerical one.
IV Summary
We have integrated the MHD ideal equations to simulate observational dark lane data obtained by Verwichte et al. ver (2005) (VNC). We simulated the effects of an initial impulsive and localized deposition of energy -supposed to be associated with above reconnection processes- in a plasma structured by sunward magnetic field lines. The impulsive phase is modeled by a pressure perturbation that initiates two main different type of processes, a fundamentally hydrodynamic shock pattern directed sunwards and a perpendicular magnetic shock one, i.e., transversal to the magnetic field. The two patterns are supposed to be independent processes however linked by their common origin and background magnetic and density conditions. Firstly, we reproduced the oscillatory kink–like pattern of the transverse component. Varying the initial conditions we were able to calibrate and reproduce the C edge in VNC. Also a sausage–like pattern was obtained resembling the tail edge D in VNC. The differences between patterns are due to the non–symmetric (most probable kink–like) or symmetric (less probable sausage–like) rebounds of the magnetic transverse shocks in the denser external medium. The resulting interactions of bounced nonlinear shocks composes and sustains, in accordance with observational characteristic times of the phenomenon, a density structure with a central void resembling a kink–like mode or a sausage–like mode as shown in Fig. 2a-b.
The same reference values were used as initial condition to simulate the sunward evolution. We could qualitatively reproduce the observational data showing that initially two opposite shock evolving fronts are produced. One evolves towards the sun surface until is absorbed, and the other is forced to rebound upwardly resembling the action of a reconnection site. Afterwards, the interaction of upwardly and downwardly moving perturbations form an expansion wave region that lowers the density of the medium. Also a voided zone is formed and sustained, lasting for times comparable with observational times, due to the continued interfering of non–linear waves. This evolution is described in Fig. 3 which reproduces with good accuracy Fig. (2C) in VNC. Finally, the composition of the two dynamics, one corresponding to the sunward directed hydrodynamic shock pattern and the perpendicular magnetic shock, composes an overall description of a moving transversally shaking void, resembling a kink–like mode as it moves towards the sun surface.
Acknowledgements.
We are grateful to the unknown referee for his/her comments and suggestions that helped to understand and improve the quality of the paper.References
- (1) Asai, A., Yokoyama, T., Shimojo, M., Shibata, K., ApJ. 605, L77, 2004
- (2) Elaskar, S., Brito H., Proc. Int. Electric Propulsion Conf., IEPC-01-141, 2001
- (3) Fernández, C., Costa, A., Elaskar, S., Schulz, W., MNRAS, 2009, in press
- (4) Innes, D.E., McKenzie, D.E., Wang, T., Sol.Phys., 217, 247, 2003a
- (5) Innes, D.E., McKenzie, D.E., Wang, T., Sol.Phys., 217, 267, 2003b
- (6) Maglione, L., Elaskar, S., Brito, H., Dean, R., Lifschitz, L., PAMM, 1,7, 2007
- (7) McKenzie, D.E., Sol.Phys., 195, 381, 2000
- (8) McKenzie, D.E., Hudson, H.S., ApJ, 519, L93, 1999
- (9) McKenzie, D.E., Savage, S. L., ApJ, 697, 1569, 2009
- (10) Powell, K., C. No NAS1-19480, ICASE, NASA Langley Res. Center, 1995
- (11) Sheeley, N.R., Wang, Y.-M., ApJ, 579, 875, 2002
- (12) Svestka, Z., Farnik, F., Hudson, H.S., Hick, P., Sol.Phys., 182, 179, 1998
- (13) Verwichte, E., Nakariakov, V.M., Cooper, F.C., A&A 430, L65, 2005
- (14) Wang, Y., Sheeley, N., Howard, R., Simnett, G., Geophys.Res.L., 26, 1203, 1999
- (15) Yee, H., Warming, R., Harten, A., J. Compu. Phy., 57, 327, 1985
- (16) Zarachay, A.; Malagoli, A., Collela, P., SIAM J Scientific Comp., 15, 263, 1994