Production measurements at LHCb with the first data
Abstract
We report on the perspective measurements of inclusive particle production in high-energy p-p collisions with data to be collected by the LHCb experiment at CERN’s LHC. These include V0 and D meson production studies, which can be based on a minimum bias sample, as well as charmonia production studies, which need a muon-triggered samples. Using reconstructed decays, both the prompt and production cross-sections will be determined, in the forward pseudo-rapidity range of 2-5 covered by LHCb. Due to the large production rate, such analyses will be possible with very small integrated luminosities of the order of a few . Other charmonia related measurements will also be discussed, such as that of the polarization at production or of the production of some of the new X, Y and Z states.
I Introduction
Dedicated to the study of the -flavour quark sector, the LHCb experiment will take data in proton-proton collisions at the CERN’s LHC. At an energy in the center of mass of 14 TeV, the cross section for pair production is , so that, with a nominal luminosity of , pairs will be produced in one year ( s) of data taking. Within this frame the CP violation and rare decays will be studied and CKM matrix tests will be performed on the full -hadrons spectrum as well as in the sector in search for hints of new physics ref:TP ; ref:TDR . The detector of the LHCb experiment is presented in §II.
It is expected that the 2009 - 2010 LHC data taking will start at the center of mass energy TeV (may go up to 10 TeV) and an integrated luminosity of 100 to 200 is anticipated. With these conditions around minimum bias events will be collected during the first days of data taking. These data will allow to perform various production studies on V0 particles, mesons and ’s, which will be presented in detail in this article.
II LHCb detector
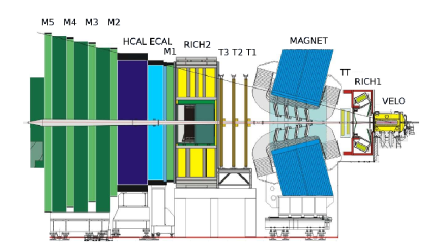
The LHCb detector is a single-arm spectrometer placed in the forward region of the p-p interaction point. With an angular coverage, with respect to the beam-axis, from 10 (15) to 300 (250) mrad in the bending (non-bending) plane, it has an acceptance from 1.9 to 4.9 in rapidity, suited to collect the quarks production which, at the LHC energies, is well peaked and correlated in the forward and backward region. Here, just a brief description of the LHCb detector is given, more details can be found in Ref. ref:jinst .
The LHCb detector is divided in several subdetectors, a simple layout is shown in Fig. 1. Around the interaction point is the Vertex Locator, a silicon detector that measures the radial and angular positions of charged tracks. The momentum measurement is ensured by the dipole magnet (integrated field of 4 Tm) and the tracking system. The latter is subdivided in a Trigger Tracker (TT), a silicon micro-strips detector, and three tracking stations (T1-T3) made up of silicon micro-strips for the inner part and straw tubes for the outer part. Particle identification, and in particular separation, is ensured by two Ring Imaging Cherenckov detectors, RICH1 and RICH2. Identification of muons is given by the MUON system, composed by one detector station (M1) placed upstream of the calorimeter system and 4 downstream (M2-M5); the stations are build up from MWPC’s with the exception of the very inner part of M1 where triple-GEM detectors are exploited. Finally, energy measurement is made by the calorimeter system: a Scintillator Pad Detector (SPD) and Pre-Shower (PS), the shashlik Electromagnetic Calorimeter (ECAL) and a hadronic calorimeter (HCAL) with Fe and scintillator tiles. A summary of the expected performances of LHCb is shown in Table 1.
| Description | Performance |
|---|---|
| Momentum resolution | |
| Energy resolution (ECAL) | |
| Energy resolution (HCAL) | |
| -hadrons mass resolution | |
| Primary [secondary] vertex position | |
| Impact parameter | |
| Time resolution on -hadrons proper lifetime | |
| Kaon identification | at of mis-id. |
| Muon identification | at of mis-id. |
A fundamental feature of LHCb is its trigger system. The rate reduction from 40 MHz, LHC bunch crossing frequency, to 2 kHz, at which events are written on tape for later analysis, is done by two trigger levels. The Level 0 trigger is hardware based, build up of custom made electronics, and reduces the rate from 40 to 1 MHz mainly requiring particles with high transverse momentum () respect to the beam direction in the calorimeters and muon system. The High Level Trigger will exploit the full event data from the detector to select events at 2 kHz. It is software based and its algorithms will evolve with the knowledge of the apparatus performance and physics programme leading to high flexibility.
III Physics with minimum bias
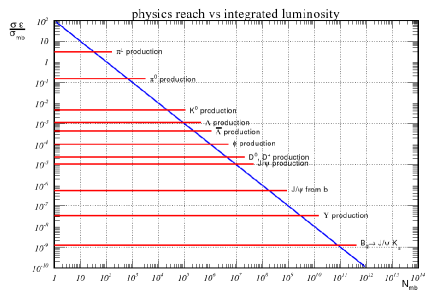
As already said the LHC 2009-2010 run conditions will not be the nominal ones, nevertheless, as soon as the collisions start, lot of interesting physics will be available to be studied. Already within the minimum bias events, many measurements can be done: in particular in Fig. 2 is shown the physics reach as a function of the number of minimum bias collected. The physics reach is defined as the relative cross-section of a process (with respect to the minimum bias one) times the global efficiency for LHCb to detect it. As it can be seen and production can start to be studied with about minimum bias events (i.e. seconds of data taking); this study is described in §IV. With minimum bias production can be studied, as described in §V, as well as production (§VI), while for something more than minimum bias events will be needed. This last sample, events, is taken as a reference for the performances of the analysis studies presented in the following. It is to be bared in mind that such a sample corresponds to days of data taking at nominal conditions, so these studies will be performed as soon as the proton collisions will take place; in particular the mentioned physics channels, apart from being interesting by themselves, are propaedeutic for the main analyses of LHCb, helping either to understand the detector performances and as building blocks of -hadrons decays (e.g. ).
IV V0 production
The hadronization process is still not well understood within the theoretical frame. At hadron colliders the strange quark production can give hints on the hadronization process since strange quarks are not present in the initial state valence quarks. Various phenomenological models are available, which are often different as philosophy, that can reproduce the fragmentation into strange hadrons and explain phenomena and distributions. Within Monte Carlo event simulators (e.g. PYTHIA) different tunings are available; but, although they do agree at Tevatron energies, there are divergences in the extrapolation at the LHC energies. Hence the study of V0 production at LHC (namely ’s and ) can shed some light in these processes.
There are also experimental motivations that justify V0 production studies. First of all these decays need minimal requirements from the detector point of view. Just information from the VELO and the Tracker is needed; moreover the simple minimum bias trigger will be available from the beginning of data taking. Being ’s and masses well known, crosschecks of the momentum calibration can be made against invariant masses. No particle identification is required so that from these samples RICH calibration will be available as well. Finally these particles are building blocks of subsequent and more complex analysis.
IV.1 V0 analysis
The study of V0 particles in LHCb will start from the following channels: , , . The results that will be presented in the following come from a study based on simulated minimum bias events with full detector simulation.
In order to deal with clean events, the ones with just one primary vertex have been selected. The analysis starts from combining two opposite charged tracks, in particular just long tracks are used: i.e. tracks with hits along the whole Tracker and in the VELO. As already said, no particle identification information is required, the analysis being based only on geometry and kinematics.
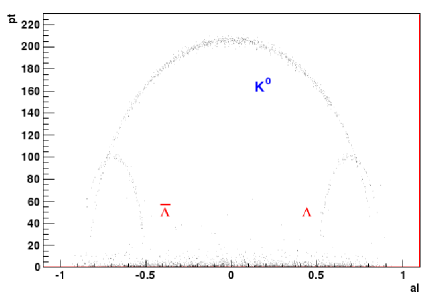
The analysis requires just the following two simple cuts: one on the distance of closest approach (DOCA) between the two tracks (required to be less than 0.2 mm) and one on the proper time . The selection imposes the same cuts, plus a cut on the impact parameter of the with respect to the Primary Vertex (PV), which is required to be less than 0.1 mm. In order to distinguish between , and decays, without particle identification, the Armenteros-Podolanski plot will be used: the transverse momentum () of decay products with respect to the mother particle is plotted versus the longitudinal momentum asymmetry, which is defined as
where is the longitudinal momentum (with respect to the mother’s direction) of the daughters particles. The Armenteros-Podolanski plot, for the studied samples, is shown in Fig. 3 where the three signal regions can be easily distinguished one from each other and from the combinatorial background in the lower part of the plot. Giving the possibility to separate the three mentioned decays, this technique leads to kinematic particle identification so that unbiased pions and protons samples are available for PID (and hence RICH) calibration.
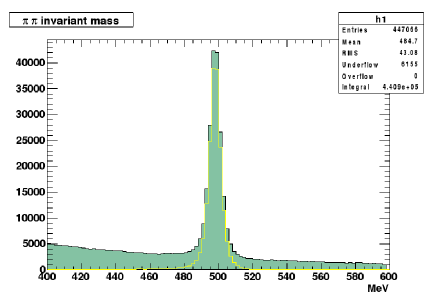
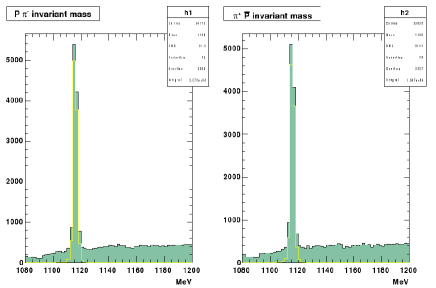
After this very simple analysis, the invariant mass distributions for and ’s can show already very prominent peaks with good signal to background ratios; the distributions are shown in Fig. 4. The production measurement of V0 particles will be made in and pseudorapidity () bins. Background subtraction will be calculated for each bin using the invariant mass distribution sidebands fit. Within a typical sample of minimum bias events around reconstructed are expected and around and .
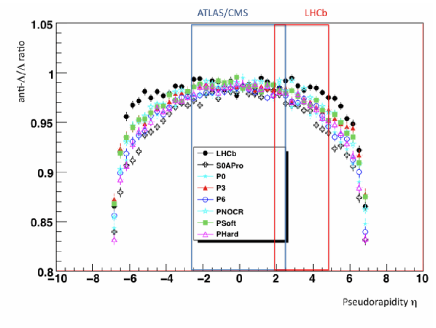
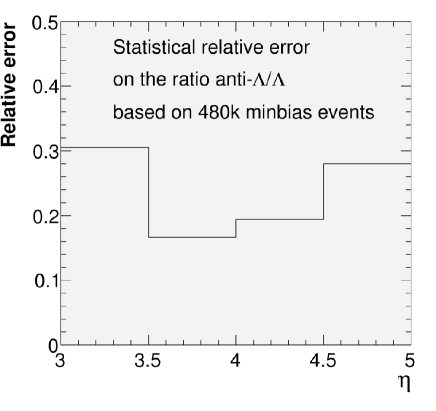
Apart from production studies, also the baryonic asymmetry will be measurable in the sector. The ratio, in fact, provides discrimination between different hadronization processes ref:skands . In Figure 5 (a) the theoretical expectation for as a function of is shown as calculated with different tunings of the Monte Carlo generators. As it can be seen from the plot, the LHCb experiment will have a larger sensitivity with respect to other LHC experiments due to its coverage in the forward region of - interactions. A first analysis within the LHCb experiment, based just on 480k Monte Carlo minimum bias events leads to the plot shown in Figure 5 (b): the relative error on the determination of ratio is shown as a function of the pseudorapidity. As it can be seen the error is already at the level of 20-30% which, extrapolated to the reference sample of minimum bias events, leads to expected statistical errors at the level of 1.5% which will provide discrimination between different models.
V D meson production studies
During the first days of data taking, as well as production,
production will also be studied.
In particular early studies on D mesons production will be made, by means of
the following decays: and plus charge conjugate modes.
The analysis strategy for the selection of these decays is very similar to the
one for V0 searches. Again only VELO and Tracker information are required, no
particle identification being needed from RICH, and using only kinematic and
geometric variables. No use of significance variables (i.e.
variables divided by their errors) will be made in order to avoid biases coming
from errors not properly understood during the early stage of the experiment.
Moreover particle ratios will only be
studied in order to cancel out largely systematics.
Finally a use of Multivariate analysis techniques is made in order to reduce
background. The particular algorithm used in this case is called
Ripper, which is a rule based classifier.
Analysis studies have been based on 9.5 M Monte Carlo minimum
bias events. Taking the decay as an example,
the
following variables have been considered both for a traditional cut based
analysis and for a Multivariate analysis: of the daughter
particles, of the , impact parameters of daughters
with respect to PV and angle between the two IP vectors, flight
length, DOCA, impact parameters of . The results of the analysis
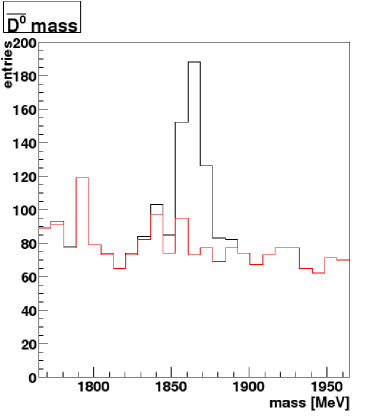
can be seen in Fig. 6, where the invariant mass distributions
obtained by selecting events with the two techniques are shown: by setting the
Multivariate method to have the same efficiency on the signal as the cut based
method, the background is reduced by the former of a
factor .
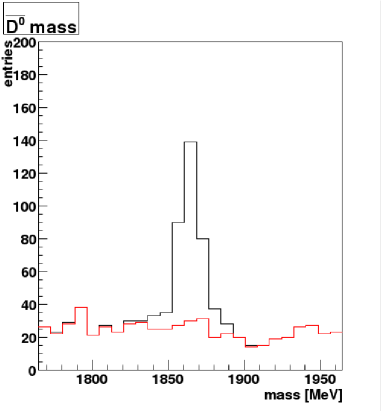
From the analyzed sample an average of about 200 events for each species has been, for the expected analysis sample of minimum bias events around 2000 events for each species are foreseen. This results lead to an expected error on the particle ratios in the sensitivity region of and .
VI production
The production of prompt is not completely understood. Using the Non-Relativistic QCD (NRQCD) with Colour Octet Model is possible to reproduce the transverse momentum spectrum measured at Tevatron; unfortunately this model foresees also an increasing of the transverse polarization with the , which has not been seen at Tevatron. Alternative models (e.g. Colour Evaporation) also predict the same spectrum but cannot account for the polarization. Hence cross-section and polarization measurements are important to understand charmonium production. Given the big cross-section of production and the unique LHCb coverage, large data samples will be available already in the first days of LHC running. At the same time also the production of from decays will be measured.
VI.1 selection
The easiest decay to look for in order to measure its production is the one into two muons. Even if, as already said, many will be already present in the minimum bias sample, the use of the Muon trigger, which is one of the main blocks of the LHCb trigger, will allow to have many more events. The selection of candidates starts from two opposite long tracks with hits also in the Muon stations. A cut is made on the of the track and of the vertex of the two tracks. One of the two muons is required to have a transverse momentum greater than 1.5 GeV. Moreover a cut on the identification likelihood () is applied, with an efficiency on the muons at a level of pion mis-identification of .
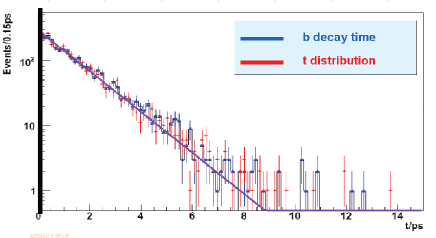
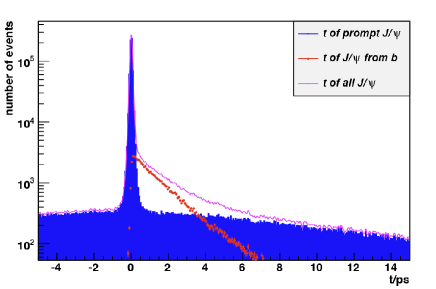
About 8% of the produced at LHC are expected to come from -hadron decays; in order to distinguish between these and the prompt ’s the following variable will be used:
where and are the two vertices coordinates and the momentum both along and the mass of the . From studies at the generator level is known to be a good approximation of the -quark lifetime. In particular in Fig. 7 the distribution of is shown together with the -decay time and the two distributions are close one to each other. In Fig. 8 instead, the distribution of the variable for different contributions is shown. In particular, apart from a flat combinatorial background (the shape of which will be estimated from invariant mass sidebands), the prompt peak at and the from exponential tail can be distinguished. Within the long tail of the distribution there is also a component due to true prompt associated to the wrong primary vertex giving so a wrong value. The amount of this component will be estimated by using true reconstructed and associating them with primary vertices coming from other events chosen randomly.
VI.2 measurement
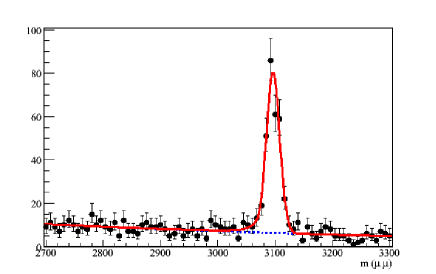
Using the first of integrated luminosity 3 million reconstructed are expected. The event counting will be made in pseudorapidity and transverse momentum bins. In order to compute the number of in each bin a fit of the invariant mass distribution will be made. In particular the plot shown in Fig. 9 shows this distribution obtained by just using 19 millions minimum bias events (corresponding to seconds of data taking at nominal luminosity), the mass resolution obtained is about 11 MeV. Monte Carlo data will be used to correct for detector acceptance and efficiencies for trigger and offline selection. Finally in order to measure the absolute cross-section, integrated luminosity measurements will be needed.
As already said, an important parameter to measure will be the polarization ; this is defined as the angle between the momentum in the rest frame and the momentum in the lab frame. In the helicity frame the distribution is parametrized as
where means transverse polarization, longitudinal polarization and no polarization. Simulation studies have shown that the LHCb geometry and L0 Trigger efficiency will induce a fake polarization on the reconstructed sample, even if the original sample were not polarized; so that in order to measure the cross-section, its polarization should be taken into account. Polarization measurement then will be made and will be also used to discriminate between different production models.
VII production
From Tevatron measurements it’s known that about of come from and hence have different polarization. The production of is also interesting by itself being the ratio important to distinguish different production models. While the NRQCD predicts to be close to 1, Colour Evaporation Model predicts it to be from the expectation from spin-counting.
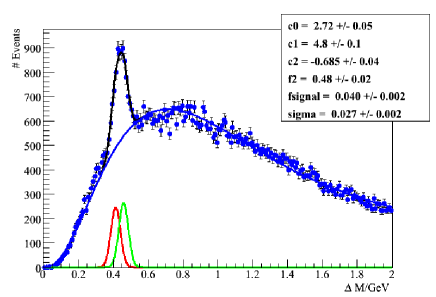
In order to select candidates a photon with MeV is combined with a selected as before (restricted to a MeV mass window). The distribution of is then used to extract the and signals. This distribution, shown in Fig. 10, will be fitted with two gaussians which represent the signal and a background component parametrized as . The obtained resolution is MeV which has to be compared with the mass difference of the two resonances, MeV; the achievable separation is limited but still some sensitivity is present leading to a discrimination between and and to the measurement of .
VIII Other quarkonia measurements
Beyond the already mentioned studies, measurements will be performed also on other charmonia and bottomonia channels. The production and in particular the ratio will be studied. Moreover, similar measurements to the charmonia case will be performed also for bottomonium production and spectroscopy (e.g. resonances, ).
The exotic , and charmonia states, recently observed, will also be studied at LHCb. In particular is under investigation the possibility to measure the quantum numbers by means of an angular analysis of the decay ; this analysis will be even more sensitive if studied in the frame of the decay where the is expected to be produced polarized: in this context will be possible to distinguish if the has equal to or .
IX Conclusions
To summarize, the LHCb experiment, ready to take data at the LHC proton collisions, will be able to exploit the very first data, apart for detector calibrations and tunings, also for very interesting physics analyses. Within a sample of minimum bias events it will be possible to probe hadronization models with V0 production studies and D-mesons ratios will be measurable with about error. Quarkonia spectroscopy will be also investigated and production and polarization will be measured.
References
- (1) LHCb Collaboration, “A Large Hadron Collider beauty experiment”, Technical Proposal, CERN/LHCC 1998-004.
- (2) LHCb Collaboration “LHCb reoptimized detector design and performance”, Technical Design Report, CERN-LHCC-2003-030.
- (3) LHCb Collaboration, Journal of Instrumentation (JINST) 3 2008, S08005
- (4) P. Skands, hep-ph:0905.3418v1, FERMILAB-CONF-09-113-T