Evidence for dust clearing through resolved submillimeter imaging
Abstract
Mid-infrared spectrophotometric observations have revealed a small sub-class of circumstellar disks with spectral energy distributions (SEDs) suggestive of large inner gaps with low dust content. However, such data provide only an indirect and model-dependent method of finding central holes. Imaging of protoplanetry disks provides an independent check of SED modeling. We present here the direct characterization of three 33-47 AU radii inner gaps, in the disks around LkH 330, SR 21N and HD 135344B, via 340 GHz (880 m) dust continuum aperture synthesis observations obtained with the Submillimeter Array (SMA). The large gaps are fully resolved at 03 by the SMA observations and mostly empty of dust, with less than 1 - 7.5 10-6 M⊙ of fine grained solids inside the holes. Gas (as traced by atomic accretion markers and CO 4.7 µm rovibrational emission) is still present in the inner regions of all three disks. For each, the inner hole exhibits a relatively steep rise in dust emission to the outer disk, a feature more likely to originate from the gravitational influence of a companion body than from a process expected to show a more shallow gradient like grain growth. Importantly, the good agreement of the spatially resolved data and spectrophotometry-based models lends confidence to current interpretations of SEDs, wherein the significant dust emission deficits arise from disks with inner gaps or holes. Further SED-based searches can therefore be expected to yield numerous additional candidates that can be examined at high spatial resolution.
1 Introduction
Knowledge of how disks dissipate is vital for our understanding of planetary system formation. Studies have shown that warm dust in the inner regions of massive, optically thick disks survives for a period of order 3-5 Myr (e.g. Strom et al. 1989; Beckwith et al. 1990). Very few objects in transition between this primordial state and the optically thin debris disk systems first discovered by IRAS (Aumann et al. 1984; Rieke et al. 2005) are known, making difficult the identification of a sample of this important, short-lived phase. One indicator of intermediate systems is the presence of an inner hole or gap indicating that the inner disk has evolved while the outer disk has not. The presence of gaps may indicate that planets have already formed in the disks and cleared the material around their orbits. Such systems can therefore strongly constrain models of planet formation, especially the role of gap formation and disk-planet interactions in various planet migration scenarios that lead to the creation of “hot Jupiters” found to orbit much older systems (Marcy et al., 2005). It is therefore essential to search for other types of evidence that either support or reject the gap hypothesis.
In theory, an inner gap in a proto-planetary disk can be identified from a depressed SED at wavelengths of 1-15 µm, as the absence of hot dust close to the star results in flux coming solely from the stellar photosphere, rather than disk surface emission. To date, such emission “deficits” are the tool most widely used to infer the presence of gaps (Brown et al. 2007, Calvet et al. 2002, Forrest et al. 2004), but spectrophotometric signatures are indirect and notoriously difficult to interpret as multiple physical scenarios can result in the same SED (Boss & Yorke, 1996). Additional constraints and detailed models are therefore required to distinguish between the possible physical scenarios that are consistent with the observed fluxes.
The relatively new field of submillimeter interferometry provides access to the small scales necessary for examining inner disk structure. Submillimeter imaging is optimal for transitional disk studies as the sources are intrinsically stronger than at longer centimeter and near-millimeter wavelengths. The spatial filtering possible with arrays can also suppress the contamination produced by the weak extended emission from nearby molecular cloud material that is routinely picked up by single dish measurements of the submillimeter flux. Long baselines and good coverage are vital to provide the high resolution/high dynamic range imaging needed to resolve the gaps. Because submillimeter observations trace optically thin emission in the Rayleigh-Jeans regime, the data are exquisitely sensitive to the mass surface density profile in the disk. However, only the brightest disks are suitable for resolving disk structure and few transitional disks have been studied on the scales necessary to resolve the central hole (LkCa 15 - Piétu et al. 2006; TW Hya - Hughes et al. 2007; LkH 330 - Brown et al. 2008; GM Aur - Dutrey et al. 2008, Hughes et al. 2009; SR 21N - Andrews et al. 2009).
Here we present further examples supporting the gap hypothesis in the form of 340 GHz (880 µm) continuum maps resolving the inner disk holes in the disks around LkH 330, SR21 and HD 135344B. Details about the sources and relevant observational details are presented in Section 2. We then turn to a discussion of the results and their implications for SED-driven searches for gaps in circumstellar disks.
2 Observations
Mid-IR spectrophotometry of LkH 330, SR 21N and HD 135344B was acquired as part of the Spitzer “From Cores to Disks” (c2d) Legacy Science project. Out of a sample of over 100 spectra in the c2d first look program, chosen from known T Tauri stars, only 5 disks (LkH 330, SR 21 N, HD 135344 B, T Cha, and CoKu Tau 4) showed SED features characteristic of an inner hole (Brown et al., 2007). Those disks visible from the northern hemisphere and with suitably large disk masses – LkH 330, SR 21N and HD 135344B – have been targeted for high spatial resolution follow-up imaging at submillimeter wavelengths.
LkH 330 is a little studied G3 star near the IC 348 region of Perseus, which is a sparse cluster with stars between a few to ten million years old (Strom et al., 1974). The distance to Perseus is an unresolved problem with values ranging from 200 to 350 pc. A distance of 250 pc is assumed here following the c2d convention.
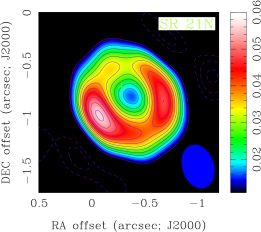
SR 21N (a.k.a. Elias 2-30) is a 3 Myr old pre-main sequence binary, with a separation of 64, in the core of the Ophiucus cloud at a distance of 160 pc (Prato et al., 2003). The primary has a spectral type of G2.5, while the companion has spectral type M4. A recent VLT/NACO AO survey found no other companions (Correia et al., 2006). Interestingly, Prato et al. (2003) found that the two companions were not coeval within their limits, although large uncertainties remain. The disks of the two components are closely aligned indicating that the stars are likely gravitationally bound but the distance between the two is large enough that we do not expect significant gravitational perturbations to the SR 21N disk, particularly in the inner regions. (Jensen et al., 2004).
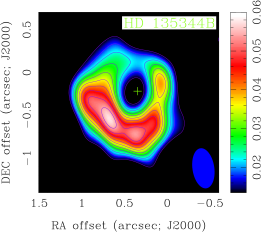
HD 135344B is an 8 Myr old F4 star in Lupus that lies 20 arcseconds from its A-type companion HD 135344A. The two stars are likely not physically associated. The dust disk around HD 135344B has been spatially resolved in UV scattered light (Grady et al., 2005; Grady & all, 2009) and the mid-IR (Doucet et al., 2006). However, the two observations provide different disk inclinations of 20∘ (Grady & all, 2009) and 46∘ (Doucet et al., 2006). A close (032 separation) binary system lies 58 to the southwest (Augereau et al., 2001). A distance of 84 pc in agreement with Dunkin et al. (1997) was used in Brown et al. (2007). A further distance of 140 pc has been suggested by van Boekel et al. (2005) and provides a better simultaneous fit of the SMA image and SED.
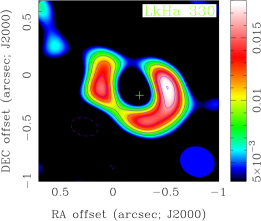
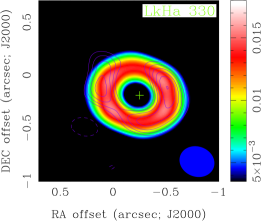
Dust emission measurements were acquired with the Submillimeter Array (SMA) using the very extended configuration with the eight 6 meter diameter antennae, which provided baselines ranging in length from 30 to 590 m. The observations of LkH 330 in 2006 November were taken with only seven antennae and the minimum length baseline was 80 m. Double sideband (DSB) receivers tuned to 341.165 GHz provided 2 GHz of bandwith/sideband, centered at an Intermediate Frequency (IF) of 5 GHz. Calibration of the visibility phases was achieved with observations of a quasar within 10 degrees of the source (listed in Table 1), typically at intervals of 25 minutes. 3C273 was used as the passband callibrator in all observations. Measurements of one of Uranus, Titan and Callisto provided the absolute scale for the flux density calibration. Uncertainties in the flux scale are estimated to be 15%. Table 1 lists the observed source position, the synthesized beam size with natural weighting, single DSB system temperatures, the phase and flux callibrators and the observation dates. Comparison of the millimeter source positions with the optical stellar positions (marked with crosses in Figure 1) show that within the position errors the millimeter emission is centered on the star. SR 21 N has the least accurate optical position and has the largest difference between the two positions. HD 135344B and SR 21N have higher system temperatures and more elongated beams than LkH 330. The data were calibrated using the MIR software package (http://cfa-www.harvard.edu/cqi/mircook.html), and processed with Miriad (Sault et al., 1995).
3 Data
3.1 Image plane
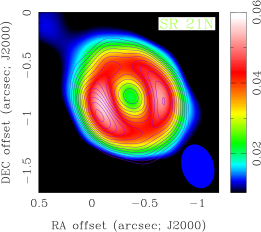
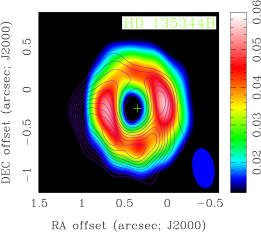
The SMA images clearly resolve the size, orientation and radial structure in all three disks (see Figure 1). The parameters found directly from the data are summerized in Table 2. The total fluxes, , were found by integrating all disk flux above a 3-sigma noise cutoff and the peak S/N ranged from 25-75 for the three disks (Table 2, columns 2 and 3). The hole radii, , (column 4) are in good agreement with the SED-determined values. The outer disk edge, , is also resolved. Due to the lower optical depths in the outer disk, this high resolution imaging is likely not sensitive to the outermost reaches of the disk, so the radii in column 6 are lower limits. For all three disks, upper limits on the integrated flux within the hole, , were derived (column 7). The SR 21N hole is smaller than those in the other disks and barely resolved, so the flux decrement is not as well constrained. In the LkH 330 image, the flux within the hole is below the 1 sigma noise level of 2.3 mJy/beam. Using the flux to disk mass conversion of Beckwith et al. (1990), which implicitly assumes a gas to dust ratio of 100, limits on the amount of mass in the hole on the order of 10-4 M⊙ were calculated (column 8). In the case of LkH 330, the significant intensity contrast between the inner and outer disk indicates a large mass surface density contrast – even for mm-sized grains.
The millimeter inclinations were found by assuming a circular disk and deprojecting the minor axis after correcting for the beam. The unusual geometries and asymmetries introduce fairly large systematic errors into these results. In the case of HD 135344B, the inclination agrees better with HST scatter light images of the outer disk (Grady & all, 2009) than resolved 20µmimages (Doucet et al., 2006). The large asymmetry, seen also in the HST images, is a potential cause of the inclination discrepancy, particularly for inclinations derived from lower spatial resolution data.
3.2 (u,v) plane
With a sufficiently sharp transition, aperture synthesis observations should detect a null in the flux versus ()-distance for disks with gaps, as opposed to the smooth drop off in flux associated with power-law mass surface density profiles that characterizes most classical T Tauri star disks (Andrews & Williams 2007). A visibility domain analysis also provides a more straightforward means of assessing the uncertainties in any fits, as the data have not been affected by the Fourier transforms and non-linear deconvolution inherent to CLEAN/MEM routines. The visibility data were averaged in concentric ellipses of deprojected (u,v) distance to account for disk inclination, , and position angle, PA (e.g. Hughes et al. 2007). Thus, the deprojected (u,v) distance is with and and where . The disks are all close to face-on and deprojecting the (u,v) distance does not make a large difference compared to a simpler annular average. All three disks do indeed show nulls (see Figure 2), the values of which are listed in Table 2.
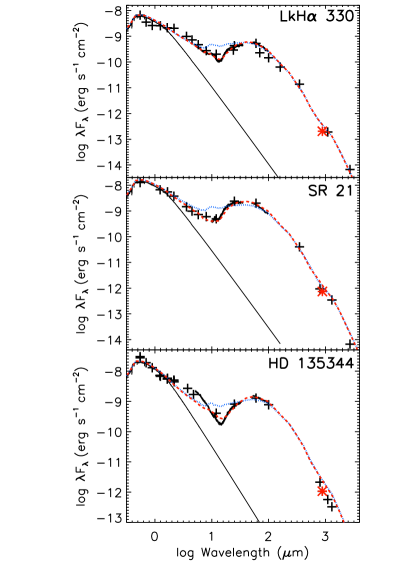
3.3 Spectral energy distributions
The dust grains that emit at 10 m versus 1 mm are very different in size, and may therefore arise from very different populations. Thus, it is of interest to examine in detail whether the SED-derived disk structure is in agreement with that dictated by the SMA images. The total 880 µm flux from the SMA observations was included in the photometry to check the overall flux in relation to other measurements (see the star-labeled points in Figure 3). The integrated fluxes do fit well with the other submillimeter measuements in the log-log plots. On average, however, the fluxes are slightly lower than other data, and the (u,v)-plane data indicate a flux deficit on the shortest spacings as compared with the model. This is likely due to the lack of short baselines in the very extended SMA configuration. Fits to the optical through millimeter-wave SED yield estimated gap outer radii for all three disks between 20 and 50 AU (see Brown et al. 2007), which are roughly in agreement with the images. The largest discrepancy is in SR 21 where the millimeter hole is significantly bigger than that found from fitting the SED. Such differences could arise either from incorrect parameterization of the central star in the model or from an intrinsic difference in the distribution of different sized grains.
4 Modeling
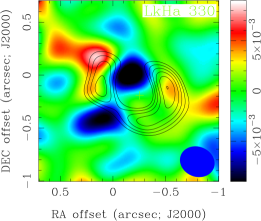
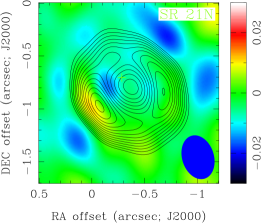
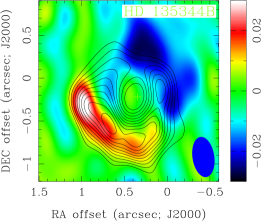
The 2-D radiative transfer model RADMC (Dullemond & Dominik, 2004), as modified to include a density reduction simulating a gap, was used to simultaneously model the resolved images (see Figure 4), the data in the (u,v)-plane (see Figure 2), and the SEDs (see Figure 3). This model assumes a passive disk, which merely reprocesses the stellar radiation field. In order to fit the missing dust emission, the model was adapted to reduce the dust density in a specific region to create a gap in the disk. The resulting image was resampled in Miriad using the same (u,v)-plane distribution as the SMA data so the two are directly comparable (see Figure 4).
In the model, the disk is assumed to be flared such that the surface height, , varies with radius, R, as , as in Chiang & Goldreich (1997). As in Brown et al. (2007), the models do not calculate the hydrostatic equilibrium self-consistently, and the pressure scale height is anchored at the outer disk edge, in this case 300 AU, in agreement with values predicted from hydrostatic equilibrium. Density is a power law of radius with an index of -1. The dust composition is set to a silicate:carbon ratio of 4:1 with only amorphous, rather than crystalline, silicate included. The grain sizes range from 0.01 m to 10 cm with a power-law index of -3.5 and a total disk mass, including both gas and dust, of 0.02 M⊙ (Osterloh & Beckwith, 1995). The inner edge of the disk, , was set at approximately the radius where the dust sublimation temperature, 1500 K, is reached.
The gap is represented in the model by three parameters: both an inner and an outer gap radius and a density reduction factor. The models were determined based primarily on the SED models found using minimization on the inner and outer gap radii in Brown et al. (2007). However, in the case of HD 135344B the SED model at 84 pc resulted in a hole of 11, significantly larger than that seen in the SMA image. In order to resolve this discrepancy, a revised distance of 140 pc and increased stellar luminosity was used (as in van Boekel et al. 2005), providing good agreement between the SED and image. The SED best fit models matched the images remarkably well, lending confidence to current SED interpretation and modeling. Both the image and the SED indicate that the gap in the LkH 330 disk has an outer radius of 47 AU. HD 135344B has a hole radius of 39 AU, while SR 21N has the smallest hole with a radius of 33 AU. The null in the (u,v) plane provides the strongest constraint on the model, limiting good fits to within 4 AU or a tenth of a beam. Large differences in the initial model parameters or distances could result in larger errors. The SMA images places no constraint on the inner gap radius, but the SEDs require hot dust with temperatures normally only found at 1 AU. The models thus have a narrow ring of hot gas extending to 0.45 AU for SR 21N and HD 135344B and 0.8 AU for LkH 330. Within our solar system, this gap corresponds to the area between Earth’s orbit and distances just beyond Pluto’s orbit.
4.1 Density contrast
The LkH 330 hole is largely empty of dust, and the intensity contrast between the hole and the outer disk is large, indicating a similarly large mass surface density contrast. The best fit models for all three disks have density reductions of 1000 within the hole. In the LkH 330 disk, this corresponds to 2.1 10-5 M⊙ of material, compared to less than 1.3 10-4 M⊙ derived from the image. For comparison, the model without the hole contains some 0.01 M⊙ of material within the same region. SR 21N and HD 135344B, with their more gradual gap edges, have less well defined density contrasts and more material within the holes. Limits on the amount of material in the hole are 3.2 10-5 M⊙ and 2.9 10-5 M⊙, respectively.
4.2 Gap edge
For all of the disks, the inner hole exhibits a relatively steep rise in dust emission to the outer disk and can be modelled satisfactorily with a step function density reduction. In order to investigate the abruptness of the transition between the inner and outer disk, a gap edge was introduced so that the density reduction rises logarithmically over a range of radii, , around the outer gap radius. This effect is similar to moving the hole radius inwards but over large scales the two disk structures can be distinguished. Figure 2 shows models with different values of compared to the data. LkH 330 is best fit by the steepest profile as might be expected from the large intensity contrast between the hole and outer disk. However, both HD 135344B and SR 21N can be fit well with much shallower slopes in density reduction, up to 0.5. A steep transition is more likely to originate from the gravitational influence of a companion body than from a process expected to show a more shallow gradient like grain growth.
4.3 Asymmetries
The most prominent asymmetry in the images is due to the inclination of the disks. The edges where more dust lies along the line-of-sight are brighter, creating two bright regions along the major axis. However, other significant asymmetries remain which cannot be explained by an axisymmetric disk model (see Figure 4). Such asymmetries could arise from gravitational perturbation caused by a large planet or binary companion.
The disk around HD 135344B is the most asymmetric with an almost horseshoe shape, so much so that modeling with an axisymmetric disk can never provide a good fit. The vast majority of the disk material lies to the south/southeast, with a cleared region in the ring to the north (see Figure 4). In order to quantitatively measure the amount of asymmetry, the ratios of integrated flux on the two sides of both the major and minor axes were measured. In all cases the asymmetries are larger around the minor axes. For HD 135344B, the flux ratio around the major axis is 1.3 but the large visible asymmetry around the minor axis is 2.2 – although the difference from the brightest point to its counterpart on the other side is a factor of 10. Both SR 21N and LkH 330 are more symmetric. SR 21N has a flux asymmetry of 1.1 around the major axis and 1.4 around the minor. LkH 330 has only a slight asymmetry around the major axis and 1.3 around the minor.
5 Discussion
We have directly imaged large inner gaps in three young protoplanetary disks. The observed sizes are in excellent agreement with those found through SED-based fits. Synthetic images, produced by the 2D radiative transfer code used to model the SEDs, fit the data well, although the asymmetry of the HD 135344B disk poses problems with the axisymmetric model used. The limits from the SMA images on the amount of material within the holes are also in agreement with the models and reveal a significant reduction in dust in the inner regions. For all of the disks, the inner hole exhibits a relatively steep rise in dust emission to the outer disk.
While the SMA images provide a large amount of information about the outer regions of the disk, information regarding the structure close to the star must come from other sources. The presence of material close to the star, making the density reduction a gap rather than a hole, places constraints on many gap producing processes. At present, the only indications of dust close to the star are the 1-10 µm excesses. All the models require a hot dust component to fit the near-IR excess in the SEDs, modeled in this paper as a ring of matter close to the star. However, the SEDs place no spatial constraints on the source of this emission. fedele08 find inner dust between 0.05 AU and 1.8 AU in HD 135344B which is consistent with a ring model as presented here. On the other hand, Eisner et al. (2009) find that mid-IR aperture masking visibilities of SR 21N are incompatible with a compact ring of emission. They preferentially model this near-IR excess as a low mass companion. However, there is little positive evidence of such a companion, with the expected degree of asymmetry not seen in either their own data or in 5 µm CO data (Pontoppidan et al. 2008; Pontoppidan, priv. comm.). In either case, the amount of mass in these scenarios is negligible compared to the outer disk and cannot be distinguished from the millimeter data presented here.
There are several indications that gas must reside close to the stars. First, LkH 330 and HD 135344B display H emission, with equivalent width measurements ranging from 11 to 20 Å (Fernandez et al. 1995, Cohen & Kuhi 1979), and so are still accreting gas. Additionally, van der Plas et al. (2008) found [O I] emission from within the dust gap in HD 135344B. SR 21N, on the other hand, does not appear to still be accreting or only very weakly (Natta et al., 2006). Second, emission from warm (800 - 1000 K) gas is seen in the 4.7 µm =10 rovibrational emission lines of CO from all three sources (Pontoppidan et al. 2008, Salyk et al. 2009). Pontoppidan et al. (2008) spatially resolved the warm CO emission in SR 21N and HD 135344B using spectro-astrometery, and placed the inner edge of the gas emission regions at 7 AU and 0.5 AU, respectively.
Formation of these dust holes by planetary companions would be the most exciting explanation for their presence, and extensive theoretical work has been done to fit transitional disk observations with models of disks with planets (Varnière et al. 2006). Theories reconciling the presence of gas within the planet-induced holes include dust filtration (Rice et al., 2006) and gas transport by magneto-rotational instability (Chiang & Murray-Clay, 2007). However, other processes which might form a hole may be effective and must be considered. Stellar mass companions in close binary orbits remain one of the most likely causes of inner disk holes and the SEDs show the defining characteristics of a transitional SEDs (e.g. CoKu Tau 4, Forrest et al. 2004, Ireland & Kraus 2008; CS Cha, Espaillat et al. 2007). Although no companions are currently known in these disks, low mass binary companions are difficult to detect without dedicated searches. Interferometric aperture-masking observations with NIRC2 on Keck reveal that LkHa330 and SR 21 have no companions with masses of 50 MJupiter, at separations larger than 10 and 5 AU, respectively (M. Ireland and A. Kraus, private communication).
One proposed process for quickly clearing the inner disk region is photoevaporation (Clarke et al. 2001, Alexander et al. 2006). An inner hole occurs when the photoevaporation rate driven by the ionizing flux from the central star matches the viscous accretion rate. However, this condition is only effectively fulfilled when accretion rates are low and would result in no gas or dust close to the star for gap radii of several tens of AU. Photoevaporation is thus extremely unlikely to be responsible for the 27-40 AU radii gaps observed in the LkH 330, HD 135344B and SR 21N disks (Salyk et al. 2009).
An alternative explanation to physical removal of the dust is that it has grown beyond the size at which it efficiently radiates as a blackbody so that it no longer emits strongly in the mid-IR and submillimeter (Tanaka et al., 2005). Within any realistic distribution of dust grain sizes, even a minimum grain diameter of 50 µm significantly overproduces the flux in the 10 µm region with no density reduction. Thus, grain growth to very large sizes with little fragmentation in collisions is needed for this scenario to be relevant for these transitional disks and seems unlikely from a theoretical point of view (Brauer et al., 2008). The sharp cutoffs in dust mass surface density between the inner and outer disk in LkH 330 and Hd 135344B are also difficult to reconcile with dust coagulation models alone.
6 Conclusions
To summarize, LkH 330, HD 135344B and SR 21N present dramatic cases of disks evolving from the inside out rather than smoothly throughout all radii as would be expected in (constant) alpha-viscosity models of disk evolution. The gaps are largely empty of dust but gas does remain, and the outer edge of the gaps rise steeply. Importantly, the good agreement of both data and model lends confidence to current interpretations of SEDs with significant dust emission deficits being due to inner holes in disks. Further SED-based searches can therefore be expected to yield numerous additional candidates that can be examined at high spatial resolution. Ultimately, in such studies it will be critical not only to image the dust but to provide estimates of the gas:dust ratios in the outer and inner disk if the different possible gap creation scenarios are to be disentangled. A combination of spatially resolved submillimeter imaging, ultimately with the Atacama Large Millimeter Array (ALMA), and high resolution infrared and millimeter-wave spectroscopy to trace the gas content will provide the key observations to drive our future understanding of these fascinating objects.
References
- Alexander et al. (2006) Alexander, R. D., Clarke, C. J., & Pringle, J. E. 2006, MNRAS, 369, 229
- Andrews & Williams (2007) Andrews, S. M. & Williams, J. P. 2007, ApJ, 659, 705
- Andrews et al. (2009) Andrews, S. M., Wilner, D. J., Hughes, A. M., Qi, C., & Dullemond, C. P. 2009, ApJ, 700, 1502
- Augereau et al. (2001) Augereau, J. C., Lagrange, A. M., Mouillet, D., & Ménard, F. 2001, A&A, 365, 78
- Aumann et al. (1984) Aumann, H. H., Beichman, C. A., Gillett, F. C., de Jong, T., Houck, J. R., Low, F. J., Neugebauer, G., Walker, R. G., & Wesselius, P. R. 1984, ApJ, 278, L23
- Beckwith et al. (1990) Beckwith, S. V. W., Sargent, A. I., Chini, R. S., & Guesten, R. 1990, AJ, 99, 924
- Boss & Yorke (1996) Boss, A. P. & Yorke, H. W. 1996, ApJ, 469, 366
- Brauer et al. (2008) Brauer, F., Dullemond, C. P., & Henning, T. 2008, A&A, 480, 859
- Brown et al. (2007) Brown, J. M., Blake, G. A., Dullemond, C. P., Merín, B., Augereau, J. C., Boogert, A. C. A., Evans, II, N. J., Geers, V. C., Lahuis, F., Kessler-Silacci, J. E., Pontoppidan, K. M., & van Dishoeck, E. F. 2007, ApJ, 664, L107
- Brown et al. (2008) Brown, J. M., Blake, G. A., Qi, C., Dullemond, C. P., & Wilner, D. J. 2008, ApJ, 675, L109
- Calvet et al. (2002) Calvet, N., D’Alessio, P., Hartmann, L., Wilner, D., Walsh, A., & Sitko, M. 2002, ApJ, 568, 1008
- Chiang & Murray-Clay (2007) Chiang, E. & Murray-Clay, R. 2007, Nature Physics, 3, 604
- Chiang & Goldreich (1997) Chiang, E. I. & Goldreich, P. 1997, ApJ, 490, 368
- Clarke et al. (2001) Clarke, C. J., Gendrin, A., & Sotomayor, M. 2001, MNRAS, 328, 485
- Cohen & Kuhi (1979) Cohen, M. & Kuhi, L. V. 1979, ApJS, 41, 743
- Correia et al. (2006) Correia, S., Zinnecker, H., Ratzka, T., & Sterzik, M. F. 2006, A&A, 459, 909
- Dent et al. (2005) Dent, W. R. F., Greaves, J. S., & Coulson, I. M. 2005, MNRAS, 359, 663
- Doucet et al. (2006) Doucet, C., Pantin, E., Lagage, P. O., & Dullemond, C. P. 2006, A&A, 460, 117
- Dullemond & Dominik (2004) Dullemond, C. P. & Dominik, C. 2004, A&A, 417, 159
- Dunkin et al. (1997) Dunkin, S. K., Barlow, M. J., & Ryan, S. G. 1997, MNRAS, 286, 604
- Dutrey et al. (2008) Dutrey, A., Guilloteau, S., Piétu, V., Chapillon, E., Gueth, F., Henning, T., Launhardt, R., Pavlyuchenkov, Y., Schreyer, K., & Semenov, D. 2008, A&A, 490, L15
- Eisner et al. (2009) Eisner, J. A., Monnier, J. D., Tuthill, P., & Lacour, S. 2009, ApJ, 698, L169
- Espaillat et al. (2007) Espaillat, C., Calvet, N., D’Alessio, P., Bergin, E., Hartmann, L., Watson, D., Furlan, E., Najita, J., Forrest, W., McClure, M., Sargent, B., Bohac, C., & Harrold, S. T. 2007, ApJ, 664, L111
- Fernandez et al. (1995) Fernandez, M., Ortiz, E., Eiroa, C., & Miranda, L. F. 1995, A&AS, 114, 439
- Forrest et al. (2004) Forrest, W. J. et al. 2004, ApJS, 154, 443
- Grady et al. (2005) Grady, C. A., Woodgate, B. E., Bowers, C. W., Gull, T. R., Sitko, M. L., Carpenter, W. J., Lynch, D. K., Russell, R. W., Perry, R. B., Williger, G. M., Roberge, A., Bouret, J.-C., & Sahu, M. 2005, ApJ, 630, 958
- Grady & all (2009) Grady, C. A. & all. 2009, ApJ, 699, 1822
- Hughes et al. (2009) Hughes, A. M., Andrews, S. M., Espaillat, C., Wilner, D. J., Calvet, N., D’Alessio, P., Qi, C., Williams, J. P., & Hogerheijde, M. 2009, ArXiv e-prints
- Hughes et al. (2007) Hughes, A. M., Wilner, D. J., Calvet, N., D’Alessio, P., Claussen, M. J., & Hogerheijde, M. R. 2007, ApJ, 664, 536
- Ireland & Kraus (2008) Ireland, M. J. & Kraus, A. L. 2008, ApJ, 678, L59
- Jensen et al. (2004) Jensen, E. L. N., Mathieu, R. D., Donar, A. X., & Dullighan, A. 2004, ApJ, 600, 789
- Marcy et al. (2005) Marcy, G., Butler, R. P., Fischer, D., Vogt, S., Wright, J. T., Tinney, C. G., & Jones, H. R. A. 2005, Progress of Theoretical Physics Supplement, 158, 24
- Natta et al. (2006) Natta, A., Testi, L., & Randich, S. 2006, A&A, 452, 245
- Osterloh & Beckwith (1995) Osterloh, M. & Beckwith, S. V. W. 1995, ApJ, 439, 288
- Piétu et al. (2006) Piétu, V., Dutrey, A., Guilloteau, S., Chapillon, E., & Pety, J. 2006, A&A, 460, L43
- Pontoppidan et al. (2008) Pontoppidan, K. M., Blake, G. A., van Dishoeck, E. F., Smette, A., Ireland, M. J., & Brown, J. 2008, ApJ, 684, 1323
- Prato et al. (2003) Prato, L., Greene, T. P., & Simon, M. 2003, ApJ, 584, 853
- Rice et al. (2006) Rice, W. K. M., Armitage, P. J., Wood, K., & Lodato, G. 2006, MNRAS, 373, 1619
- Rieke et al. (2005) Rieke, G. H., Su, K. Y. L., Stansberry, J. A., Trilling, D., Bryden, G., Muzerolle, J., White, B., Gorlova, N., Young, E. T., Beichman, C. A., Stapelfeldt, K. R., & Hines, D. C. 2005, ApJ, 620, 1010
- Salyk et al. (2009) Salyk, C., Blake, G. A., Boogert, A. C. A., & Brown, J. M. 2009, ApJ, 699, 330
- Sault et al. (1995) Sault, R. J., Teuben, P. J., & Wright, M. C. H. 1995, in ASP Conf. Ser. 77: Astronomical Data Analysis Software and Systems IV, ed. R. A. Shaw, H. E. Payne, & J. J. E. Hayes, 433
- Strom et al. (1989) Strom, K. M., Strom, S. E., Edwards, S., Cabrit, S., & Skrutskie, M. F. 1989, AJ, 97, 1451
- Strom et al. (1974) Strom, S. E., Strom, K. A., & Carrasco, L. 1974, PASP, 86, 798
- Tanaka et al. (2005) Tanaka, H., Himeno, Y., & Ida, S. 2005, ApJ, 625, 414
- van Boekel et al. (2005) van Boekel, R., Min, M., Waters, L. B. F. M., de Koter, A., Dominik, C., van den Ancker, M. E., & Bouwman, J. 2005, A&A, 437, 189
- van der Plas et al. (2008) van der Plas, G., van den Ancker, M. E., Fedele, D., Acke, B., Dominik, C., Waters, L. B. F. M., & Bouwman, J. 2008, A&A, 485, 487
- Varnière et al. (2006) Varnière, P., Bjorkman, J. E., Frank, A., Quillen, A. C., Carciofi, A. C., Whitney, B. A., & Wood, K. 2006, ApJ, 637, L125

| Source | R.A. | Dec. | Beam size | SSB Tsys | Phase | Flux | Observation dates |
|---|---|---|---|---|---|---|---|
| (J2000) | (J2000) | (K) | Calibrator | Calibrator | |||
| LkH 330 | 03:45:48.28 | +32:24:11.8 | 028x033 | 211-870 | 3C111 | Titan | 2006 November 11 |
| 210-685 | 3C111 | Uranus | 2006 November 19 | ||||
| SR 21N | 16:27:10.28 | -24:19:12.7 | 042x030 | 180-490 | 1625-254 | Callisto | 2007 June 10 |
| HD 135344B | 15:15:48.43 | -37:09:16.22 | 047x025 | 170-610 | 1454-377 | Callisto | 2007 May 27 |
| 150-424 | 1454-377 | Callisto | 2007 June 8 |
| Source | Ftotal | RMS Noise | Rhole | R | Rdisk1 | Fhole | Mhole | Inclina- | Null | Position |
|---|---|---|---|---|---|---|---|---|---|---|
| (mJy) | (mJy/beam) | (AU) | (AU) | (AU) | (mJy) | (10-4 M⊙) | tion (∘) | (k) | angle (∘) | |
| LkH 330 | 59.8 | 2.3 | 47 | 50 | 125 | 2.3 | 1.31.3 | 42 | 240-260 | 165 |
| SR 21N | 217 | 3.7 | 33 | 18 | 140 | 16.7 | 7.50.9 | 21 | 200-240 | 15 |
| HD 135344B | 314 | 4.5 | 39 | 45 | 125 | 6.7 | 1.10.8 | 21 | 160-200 | 55 |