Superconductivity at 15.6 K in Calcium-doped Tb1-xCaxFeAsO: the structure requirement for achieving superconductivity in the hole-doped 1111 phase
Abstract
Superconductivity at about 15.6 K was achieved in Tb1-xCaxFeAsO by partially substituting Tb3+ with Ca2+ in the nominal doping region . A detailed investigation was carried out in a typical sample with doping level of = 0.44. The upper critical field of this sample was estimated to be 77 Tesla from the magnetic field dependent resistivity data. The domination of hole-like charge carriers in the low-temperature region was confirmed by Hall effect measurements. The comparison between the calcium-doped sample Pr1-xCaxFeAsO (non-superconductive) and the Strontium-doped sample Pr1-xSrxFeAsO (superconductive) suggests that a lager ion radius of the doped alkaline-earth element compared with that of the rare-earth element may be a necessary requirement for achieving superconductivity in the hole-doped 1111 phase.
pacs:
74.10.+v, 74.70.Dd, 74.25.Fy, 74.62.DhI Introduction
The discovery of superconductivity in iron pnictides have generated enormous interests in the community of condensed matter physics.Kamihara2008 Up to date, the iron pnictide superconductors have developed into several families with different structures, which were abbreviated as the 1111 phase (including the oxy-arsenideKamihara2008 and fluorine-arsenideSrF ), 122 phase,Rotter ; CWCh 111 phase,LiFeAs ; LiFeAsChu ; LiFeAsUK 11 phase,FeSe 42622 phase,42622 and so on. It seems that each phase with different structure has a unique superconducting transition temperature . As for the 1111 phase, most of the discovered superconductors are characterized as electron-doped ones Pr52K ; CP ; WangC ; Mandrus ; CaoGH , while the hole-doped superconductors were only reported in the strontium-doped Ln1-xSrxFeAsO (Ln = La, Pr, Nd).WenEPL ; LaSr2 ; PrSr ; NdSr The hole-doped superconductivity in 1111 phase by substituting other ion-dopants with valence of ”+2”, such as barium or calcium, seems quite difficult to be achieved, at least in many of the rare-earth based systems. Obviously, it is important to carry out more explorations in this direction in order to extend the family of the hole-doped superconductors in 1111 phase. And it is also significant to investigate the factors which govern the electronic properties (superconducting or non-superconducting) in the hole-doped side based on the 1111 phase.
In this paper we report a new hole-doped superconductor in the 1111 phase, calcium-doped Tb1-xCaxFeAsO, with the maximum superconducting transition temperature of 15.6 K (95% ). It is found that superconductivity appears in the nominal doping region . The physical properties of a selected sample with = 0.44 were investigated in depth. We estimated the upper critical field of this sample to be 77 Tesla based on the Werthamer-Helfand-Hohenberg (WHH) formula.WHH The conducting charge carriers in this sample were characterized to be hole type in a wide low-temperature region by the Hall effect measurements. Meanwhile, we have also successfully synthesized calcium-doped Pr1-xCaxFeAsO, which also displays hole-type charge carriers in low-temperature region but doesn’t superconduct at all. We attribute this different behavior to the sensitive electronic response to the relative radii of the doped ions compared with that of the rare-earth ions.
II Experimental Details
The Tb1-xCaxFeAsO samples were prepared using a two-step solid state reaction method. In the first step, TbAs and CaAs were prepared by reacting Tb flakes (purity 99.99%), Ca flakes (purity 99.9%) and As grains (purity 99.99%) at 500 oC for 10 hours and then 700 oC for 16 hours. They were sealed in an evacuated quartz tube when reacting. Then the resultant precursors were thoroughly grounded together with Fe powder (purity 99.95%) and Fe2O3 powder (purity 99.5%) in stoichiometry as given by the formula Tb1-xCaxFeAsO. All the weighing and mixing procedures were performed in a glove box with a protective argon atmosphere. Then the mixtures were pressed into pellets and sealed in an evacuated quartz tube. The materials were heated up to 1150-1170 oC with a rate of 120 oC/hr and maintained for 40 hours. Then a cooling procedure was followed. After that, we can get the superconducting polycrystalline samples. The process of preparing Pr1-xCaxFeAsO samples is quite similar to that of Tb1-xCaxFeAsO.
The x-ray diffraction (XRD) measurements of our samples were carried out by a - MXP18A-HF equipment with Cu-Kα radiation. The ac susceptibility of the samples were measured on the Maglab-12T (Oxford) with an ac field of 0.1 Oe and a frequency of 333 Hz. The resistance and Hall effect measurements were done using a six-probe technique on the Quantum Design instrument physical property measurement system (PPMS) with magnetic fields up to 9 T. The current direction was changed for measuring each point in order to remove the contacting thermal power. The temperature stabilization was better than 0.1% and the resolution of the voltmeter was better than 10 nV.
III Experimental data and discussion
III.1 Sample characterization for Tb0.56Ca0.44FeAsO
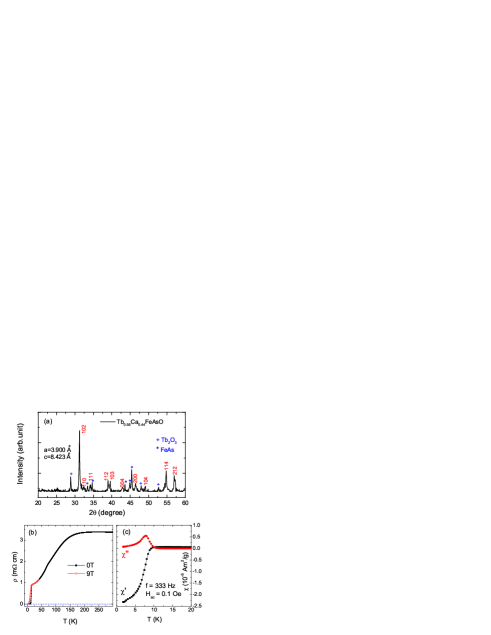
The x-ray diffraction pattern for the sample Tb1-xCaxFeAsO with the nominal doping level of = 0.44 is shown in Fig. 1(a). It is clear that all the main peaks can be indexed to the 1111 phase with the tetragonal ZrCuSiAs-type structure.ZrCuSiAs The main impurity phases were identified to be Tb2O3 and FeAs, which are all not superconducting in the measuring temperature. By using the software Fullprof, we can determine the lattice constants as and for this sample. By comparing with the lattice constants of the parent phase TbFeAsO ( , ) reported by other group,JieY we find that the -axis lattice constant in the present sample is slightly larger than that of the parent phase, while the expansion along the -axis direction is more distinct. In fact, the similar tendency has been observed in other hole-doped systems in the 1111 phase.LaSr2 ; PrSr This indicates that the calcium atoms go into the crystal lattice of the TbFeAsO system because the radius of Ca2+ is larger than that of Tb3+ (see Fig. 7).
In Fig. 1(b) we present a typical set of resistive data for the same sample Tb0.56Ca0.44FeAsO under 0 T and 9 T. The data under 0 T is shown up to 300 K. A clear superconducting transition can be seen in the low temperature region. Taking a criterion of 95% , the onset transition temperature is determined to be 15.6 K. A magnetic field of 9 T only suppresses the onset transition temperature about 1.6 K, indicating a rather high upper critical field in our sample. In the high temperature region, the resistivity anomaly coming from the antiferromagnetic (AF) or structural transition has been suppressed and a flattening feature was observed clearly. The similar behavior has been observed in other hole-doped 1111 systems Ln1-xSrxFeAsO (Ln = La, Pr, Nd).WenEPL ; LaSr2 ; PrSr ; NdSr Figure 1(c) shows the ac susceptibility data measured with Hz and Oe. A rough estimate from the diamagnetic signal shows that the superconducting volume fraction of the present sample is beyond 50%, confirming the bulk superconductivity in our samples. The onset critical temperature by magnetic measurements is roughly corresponding to the zero-resistance temperature.
III.2 Upper critical field for Tb0.56Ca0.44FeAsO
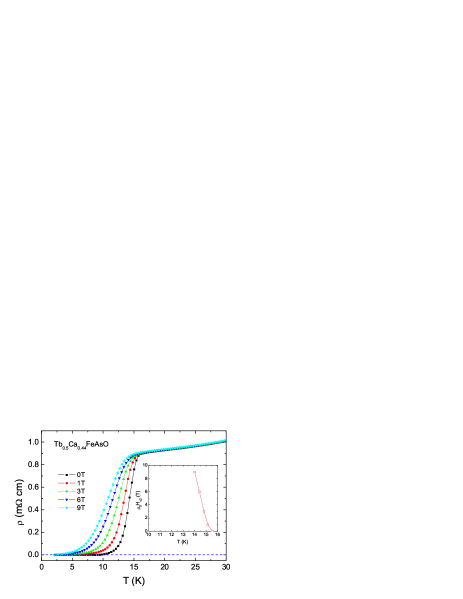
We attempted to estimate the upper critical field of the sample Tb0.56Ca0.44FeAsO from the resistivity data. Temperature dependence of resistivity under different magnetic fields is shown in the main frame of Fig. 2. It is found that the onset transition point, which reflects mainly the upper critical field in the configuration of Hab-plane, shifts more slowly than the zero resistivity point to low temperatures under fields. The magnetoresistance in the normal state is found to be quite small. We take a criterion of 95% to determine the onset transition points under different fields, which are represented by the red open circles in the inset of Fig. 2. From these data we can determine the slope of near , T/K. By using the WHH formulaWHH the value of zero temperature upper critical field can be estimated through:
| (1) |
Taking = 15.6 K, we get T. Regarding the relatively low value of =15.6 K in the present sample, this value of upper critical field is actually quite high.
Actually, in the strontium-doped Ln1-xSrxFeAsO (Ln = La, Pr), the rather high and large slope ( T/K) have been observed when comparing with the F-doped LaFeAsO sample, which was attributed to higher quasiparticle density of states (DOS) near the Fermi level in the hole-doped samples.PrSr Surprisingly, the slope found here is even larger than that of the strontium-doped samples. The essential physical mechanism for this behavior may still need more investigation in this system, including that from the theoretical side.
III.3 Hall effect of Tb1-xCaxFeAsO
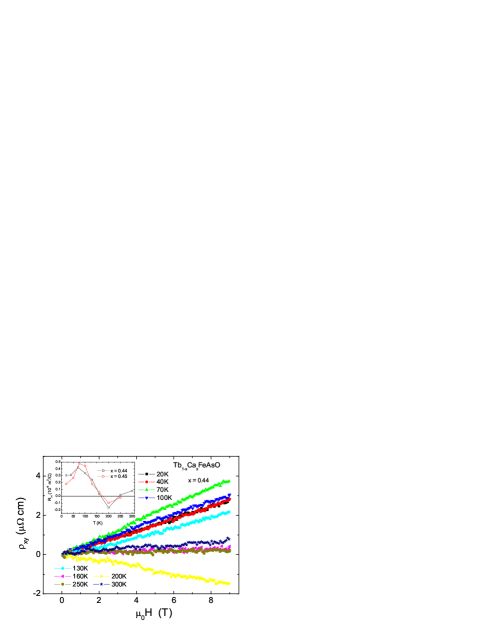
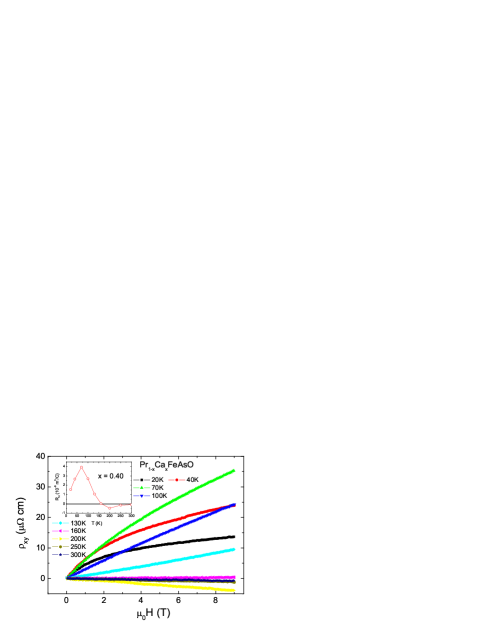
It is known that Hall effect measurement is a useful tool to investigate the information of charge carriers and the band structure. For a conventional metal with Fermi liquid feature, the Hall coefficient is almost independent of temperature. However, this situation is changed for a multiband materialHY or a sample with non-Fermi liquid behavior, such as the cuprate superconductors.Ong To examine the type of the conducting carriers, we measured the Hall effect of the samples Tb1-xCaxFeAsO. The main frame of Fig. 3 shows the magnetic field dependence of Hall resistivity () at different temperatures for the sample with = 0.44. In the experiment was taken as = [(+H) - (-H)]/2 at each point to eliminate the effect of the misaligned Hall electrodes. We can see that all curves in Fig. 3 have good linearity versus the magnetic field. Moreover, is positive at all temperatures below 160 K giving a positive Hall coefficient , which actually indicates that hole-type charge carriers dominate the conduction below 160 K in the present sample.
The temperature dependence of for two samples with = 0.44 and 0.45 is shown in the inset of Fig. 3. One can see that the evolution of with temperature are quite similar for the two samples, indicating the reliability of the Hall data. The hump feature in low temperature region is quite similar to that observed in strontium-doped Ln1-xSrxFeAsO (Ln = La, Pr) samples.WenEPL ; LaSr2 ; PrSr However, there is still some differences obviously. Firstly, the Hall coefficient changes its sign at about 160 K which is remarkably lower than that observed in the strontium-doped systems ( K). This character seems to be quite common in the calcium-doped 1111 phase because the sign changing of was also found to occur at about 160 K in Pr1-xCaxFeAsO (see Fig. 5) and Nd1-xCaxFeAsO (data not shown here). Secondly, the negative at about 200 K has a rather large absolute value. This feature seems to be unique in the calcium-doped superconducting samples, since it can’t be observed in Ln1-xSrxFeAsO (Ln = La, Pr) or Pr1-xCaxFeAsO. Assuming a simple two-band scenario with different types of carriers, we can express the Hall coefficient in the low-field limit as
| (2) |
where and are the conductivity and the mobility of the band, respectively. They are determined by the charge-carrier density and scattering rate of each band. We attribute the strong and complicated temperature dependence of in the present system to the competing effect of the scattering rate as well as the charge-carrier density in different bands.
III.4 The case in the calcium-doped Pr1-xCaxFeAsO
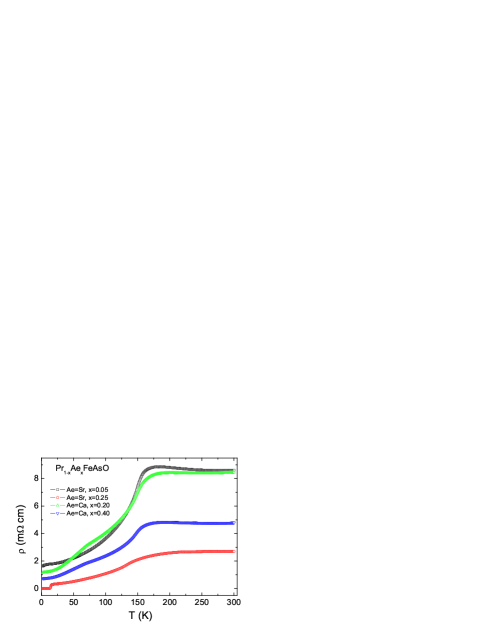
One may be curious to know what would happen if we substitute calcium to the systems based on other rare-earth elements. Actually, we have tried the case of calcium-doped LaFeAsO, PrFeAsO, NdFeAsO, GdFeAsO, and so on. Here we just show the results of Pr1-xCaxFeAsO for example. No superconductivity was found in the calcium-doped Pr1-xCaxFeAsO samples in quite wide doping range (). In Fig. 4, we show the temperature dependence of resistivity for two selected samples with and 0.40. In order to have a comparison, we also display the resistivity data for two strontium-doped Pr1-xSrxFeAsO samples with different doping levels ( = 0.05 and 0.25). It is clear that the resistivity anomaly from the AF or structural transition around 160 K is suppressed gradually with the increase of strontium contents. By having a closer scrutiny, we find that the behavior of the calcium-doped samples is between that of the two strontium-doped samples in high temperature region. This may suggest that the real doped charge carriers in the calcium-doped PrFeAsO are roughly corresponding to of that of the strontium-doped PrFeAsO system and the AF order has been suppressed to a certain extent by the calcium-doping.
To further investigate the conducting properties of the Pr1-xCaxFeAsO sample, we have measured the Hall effect of them and display the data of one typical sample with in Fig. 5. Nonlinear behavior was observed in the field dependent data below 100 K. The hump feature and positive value of can be seen below about 160 K, which is rather similar to that observed in Tb1-xCaxFeAsO (see Fig. 3). This behavior indicates strongly that the hole-type charge carriers have been induced to the system and they dominate the conducting in low temperature region.
| sample | () | () | Fe-As-Fe (o) | dPrOPr () | dAsFeAs () | dinter () |
|---|---|---|---|---|---|---|
| PrFeAsO | ||||||
| Pr0.87Ca0.13FeAsO | ||||||
| Pr0.84Sr0.16FeAsO |
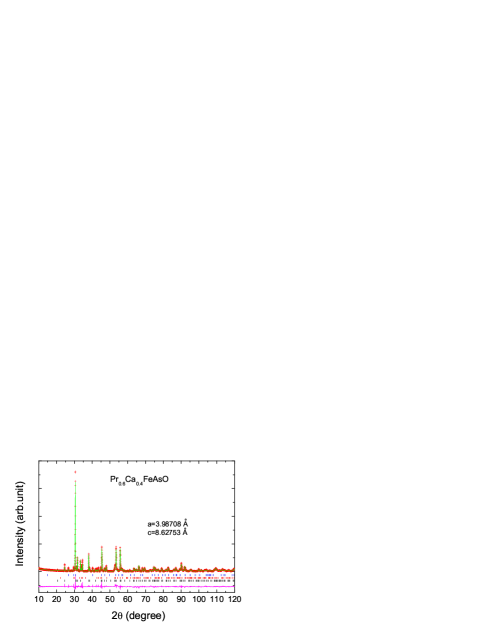
In order to find the factors which prevent Pr1-xCaxFeAsO from superconducting even if hole-type charge carriers have been doped into the system, we analyzed the structural details of one calcium-doped Pr1-xCaxFeAsO with nominal = 0.4. Selected Rietveld refinement results are listed in table I, and the refinement pattern is shown in Fig. 6. Only small amounts of Pr2O3 and FeAs can be seen as the impurities. From the refinement, we find that the actual doping concentration for the sample Pr1-xCaxFeAsO with nominal = 0.4 is only about 0.13, which is quite consistent with the argument we obtained from the resistivity data (see Fig. 4). In order to have a comparison with the strontium-doped PrFeAsO system where superconductivity has been obtained, we also display the structural parameters of the parent phase PrFeAsO and strontium-doped Pr1-xSrxFeAsO with = 0.16 (the value from refinement) Jeitschko ; Ju in table I. Here we define dPrOPr and dAsFeAs as the vertical distance between the Pr atoms residing at the top and bottom of the PrO layer and that between the As atoms in the FeAs layer, respectively. And dinter is the interlayer space between the Pr-O-Pr block and the As-Fe-As block. It is clear that the lattice constant along -axis remains nearly unchanged while that along -axis expands clearly when calcium is doped to PrFeAsO. Both dPrOPr and dAsFeAs shrink slightly while dinter expands distinctly with the actual calcium doping of 0.13, resulting in the expansion behavior of the lattice along -axis. Surprisingly, we find that calcium doping gives a rather similar influence to the crystal structure to that of strontium doping, when we compare the parameters of Pr0.87Ca0.13FeAsO and Pr0.84Sr0.16FeAsO as shown in table I, even if the radius of Ca2+ is smaller than that of Pr3+ while the radius of Sr2+ is larger (see Fig. 7). We note that the sample Pr0.84Sr0.16FeAsO still doesn’t superconduct and superconductivity was achieved in the samples with even higher doping, as reported in Ref.[25]. However, the fact that the radius of Ca2+ is smaller than that of Pr3+ seems to prevent from doping even more calcium to PrFeAsO and consequently prevent from achieving superconductivity in Pr1-xCaxFeAsO system, because the effect of doped calcium is to expand the lattice along -axis. This argument is reinforced by the fact that only 13% of calcium can be doped into the system even if the nominal doping concentration is 40%.
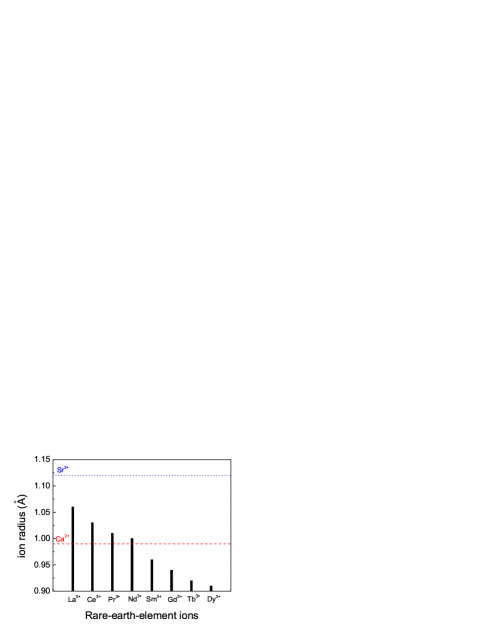
To validate our supposition, we have tried the case of other calcium-doped samples. In La1-xCaxFeAsO, we found that it is quite difficult to dope charge carriers (probably also Ca) to the system and the Hall coefficient remains negative, and very similar behaviors to that of Pr1-xCaxFeAsO were observed in Nd1-xCaxFeAsO. Very small superconducting signal can be observed in Sm1-xCaxFeAsO sometimes. Zero resistance can be obtained easily in Gd1-xCaxFeAsO, but the diamagnetic signal is smaller than that of the Tb1-xCaxFeAsO system. We can’t get the 1111 phase on the heavy rare-earth (Dy, Ho, et al) side under ambient pressure. By summarizing the phenomena mentioned above, we argue that the relationship between the ion radii of the rare-earth elements and the alkaline-earth element may play a key role in achieving superconductivity in the hole-doped 1111 phase (see Fig. 7). That is, superconductivity emerges only when the ion radius of the rare-earth element is smaller than that of the alkaline-earth element. At this time, we can say safely that it is rather difficult, if not impossible, to obtain superconductivity when the ion radius of the rare-earth element is larger. Moreover, it seems that superconductivity favors the situation when the difference between the two radii is lager, within the tolerance of crystal lattice. These arguments are quite consistent with that stated in the previous paragraph. This actually gives a restriction in exploring new superconductors in hole-dope side of 1111 phase.
IV Concluding remarks
In summary, bulk superconductivity was achieved by substituting Tb3+ with Ca2+ in TbFeAsO system. The maximum superconducting transition temperature = 15.6 K is found to appear around the nominal doping level = 0.40 0.50. The positive Hall coefficient in a wide low-temperature range suggests that the hole-type charge carriers dominate the conduction in this system. Surprisingly, the slope of the upper critical magnetic field vs. temperature near in calcium-doped Tb1-xCaxFeAsO is found to be much higher than that of the electron-doped and strontium-doped ones. Moreover, we have investigated the structural and conducting properties of other calcium-doped systems (taking Pr1-xCaxFeAsO for example). We found that the relationship between the ion radii of the rare-earth elements and alkaline-earth elements may play a key role in achieveing superconductivity in the hole-doped 1111 phase.
Acknowledgements.
We acknowledge the help of XRD experiments from L. H. Yang and H. Chen. This work is supported by the Natural Science Foundation of China, the Ministry of Science and Technology of China (973 project: 2006CB01000, 2006CB921802), the Knowledge Innovation Project of Chinese Academy of Sciences (ITSNEM).References
- (1) Y. Kamihara, T. Watanabe, M. Hirano, and H. Hosono, J. Am. Chem. Soc. 130, 3296 (2008).
- (2) X. Zhu, F. Han, P. Cheng, G. Mu, B. Shen, and H. H. Wen, Europhys. Lett. 85, 17011 (2009).
- (3) M. Rotter, M. Tegel, and D. Johrendt, Phys. Rev. Lett. 101, 107006 (2008).
- (4) K. Sasmal, B. Lv, B. Lorenz, A. M. Guloy, F. Chen, Y. Y. Xue, and C. W. Chu, Phys. Rev. Lett. 101, 107007 (2008).
- (5) X. C. Wang, Q. Q. Liu, Y. X. Lv, W. B. Gao, L. X. Yang, R. C. Yu, F. Y. Li, and C. Q. Jin, arXiv: Condat/0806.4688.
- (6) J. H. Tapp, Z. Tang, B. Lv, K. Sasmal, B. Lorenz, P. C.W. Chu, and A. M. Guloy, Phys. Rev. B 78, 060505(R) (2008).
- (7) M. J. Pitcher, D. R. Parker, P. Adamson, S. J. C. Herkelrath, A. T. Boothroyd, and S. J. Clarke, Chem. Commun. (Cambridge) 2008, 5918.
- (8) F.C. Hsu, J.Y. Luo, K.W. Yeh, T.K. Chen, T.W. Huang, P.M. Wu, Y.C. Lee, Y.L. Huang, Y.Y. Chu, D.C. Yan, M.K. Wu, Proceedings of National Academy of Sciences 105, 14262 (2008).
- (9) X. Zhu, F. Han, G. Mu, P. Cheng, B. Shen, B. Zeng, and H. H. Wen, Phys. Rev. B 79, 220512(R) (2009)
- (10) Z. Ren, J. Yang, W. Lu, W. Yi, G. C. Che, X. L. Dong, L. L. Sun, and Z. X. Zhao, Materials Research Innovations 12, 105, (2008).
- (11) P. Cheng, L. Fang, H. Yang, X. Zhu, G. Mu, H. Luo, Z. Wang, and H. H. Wen, Science in China G, 51(6), 719-722 (2008).
- (12) C. Wang, L. Li, S. Chi, Z. Zhu, Z. Ren, Y. Li, Y. Wang, X. Lin, Y. Luo, S. Jiang, X. Xu, G. Cao, and Z. Xu, Europhys. Lett. 83, 67006 (2008).
- (13) A. S. Sefat, A. Huq, M. A. McGuire, R. Jin, B. C. Sales, D. Mandrus, L. M. D. Cranswick, P. W. Stephens, and K. H. Stone, Phys. Rev. B 78, 104505 (2008).
- (14) G. Cao, C. Wang, Z. Zhu, S. Jiang, Y. Luo, S. Chi, Z. Ren, Q. Tao, Y. Wang, and Z. Xu, Phys. Rev. B 79, 054521 (2009).
- (15) H. H. Wen, G. Mu, L. Fang, H. Yang, and X. Y. Zhu, Europhys. Lett. 82, 17009 (2008).
- (16) G. Mu, L. Fang, H. Yang, X. Zhu, P. Cheng, and H. H. Wen, J. Phys. Soc. Jpn. Suppl. 77, 15-18 (2008).
- (17) G. Mu, B. Zeng, X. Zhu, F. Han, P. Cheng, B. Shen, and H. H. Wen, Phys. Rev. B 79, 104501 (2009).
- (18) K. Kasperkiewicz, J. G. Bos, A. N. Fitch, K. Prassides, and S. Margadonna, Chem. Commun. (Cambridge) 2009, 707.
- (19) N. R. Werthamer, E. Helfand and P. C. Hohenberg, Phys. Rev. 147, 295 (1966).
- (20) V. Johnson, and W. Jeitschko, J. Solid State Chem. 11, 161 (1974).
- (21) J. Yang, X. L. Shen, W. Lu, W. Yi, Z. C. Li, Z. A. Ren, G. C. Che, X. L. Dong, L. L. Sun, F. Zhou, and Z. X. Zhao, New J. Phys. 11 025005 (2009).
- (22) H. Yang, Y. Liu, C. G. Zhuang, J. R. Shi, Y. G. Yao, S. Massidda, M. Monni, Y. Jia, X. X. Xi, Q. Li, Z. K. Liu, Q. R. Feng, H. H. Wen, Phys. Rev. Lett. 101, 067001 (2008).
- (23) T. R. Chien, D. A. Brawner, Z. Z. Wang, and N. P. Ong, Phys. Rev. B, 43, 6242-6245 (1991).
- (24) P. Quebe, L.J. Terbüchte, and W. Jeitschko, New J. Phys. 11 083003 (2009).
- (25) J. Ju, Z. Li, G. Mu, H. H. Wen, K. Sato, M. Watahiki, G. Li, and K. Tanigaki, New J. Phys. 11 083003 (2009).